. 2021 Mar;115(2):442-459.
doi: 10.1002/jeab.672. Epub 2021 Jan 25.

Resurgence and repeated within-session progressive-interval thinning of alternative reinforcement

Affiliations

Resurgence and repeated within-session progressive-interval thinning of alternative reinforcement

Anthony N Nist et al. J Exp Anal Behav. 2021 Mar.

Abstract

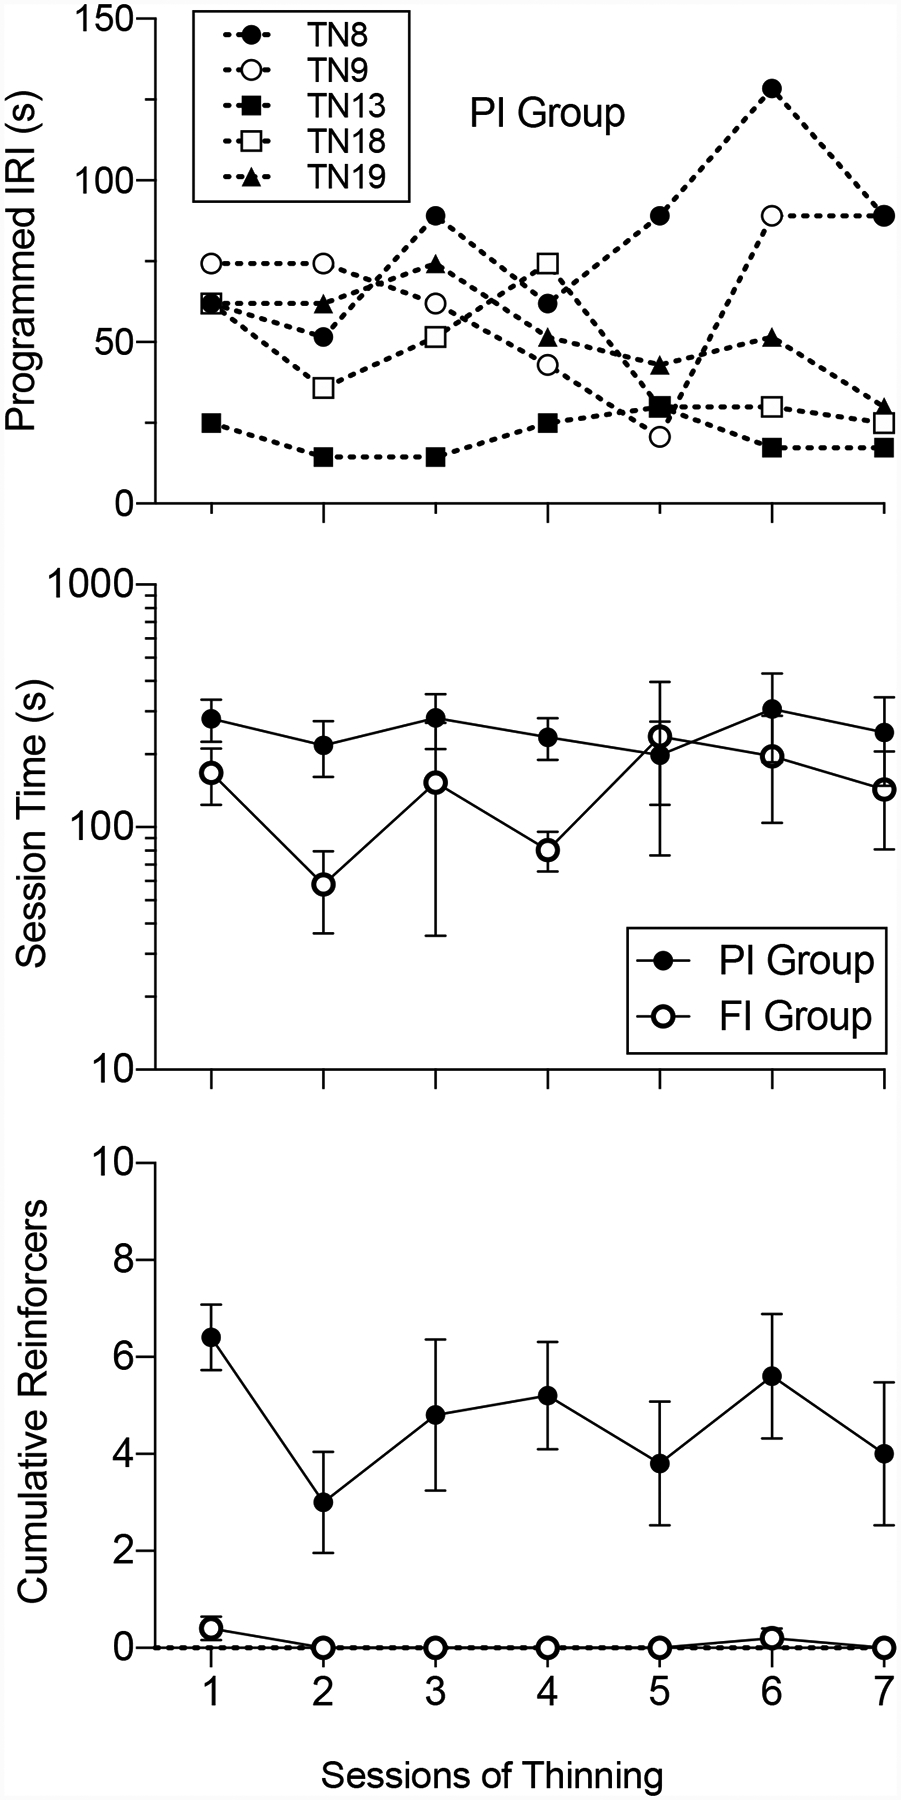
Resurgence of a previously suppressed target behavior is common when reinforcement for a more recently reinforced alternative behavior is thinned. To better characterize such resurgence, these experiments examined repeated within-session alternative reinforcement thinning using a progressive-interval (PI) schedule with rats. In Experiment 1, a transition from a high rate of alternative reinforcement to a within-session PI schedule generated robust resurgence, but subsequent complete removal of alternative reinforcement produced no additional resurgence. Experiment 2 replicated these findings and showed similar effects with a fixed-interval (FI) schedule arranging similarly reduced session-wide rates of alternative reinforcement. Thus, the lack of additional resurgence following repeated exposure to the PI schedule was likely due to the low overall obtained rate of alternative reinforcement provided by the PI schedule, rather than to exposure to within-session reinforcement thinning per se. In both experiments, target responding increased at some point in the session during schedule thinning and continued across the rest of the session. Rats exposed to a PI schedule showed resurgence later in the session and after more cumulative alternative reinforcers than those exposed to an FI schedule. The results suggest the potential importance of further exploring how timing and change-detection mechanisms might be involved in resurgence.

Keywords: alternative reinforcement; lever pressing; rats; reinforcement thinning; relapse; resurgence.


Figures

Figure 1.
Figure 1.
Target and alternative response rates for individual subjects from the final 3 sessions of Phase 1 (Baseline) and all subsequent sessions of Experiment 1. Top and bottom panels display target and alternative responding, respectively. Different symbols represent individual subjects and are consistent across panels.
Figure 2.
Figure 2.
Pearson’s product-moment correlation coefficient in four-session blocks during Phase 3 (PI Thinning) in Experiment 1. Data points correspond to correlations between target response rates (resp/min) and alternative IRI length (s) over four-session blocks of PI thinning. An asterisk indicates a statistically significant correlation coefficient with the criterion of α = .05.
Figure 3.
Figure 3.
Cumulative target responding as a function of session time in the last session of Phase 2 (FI 10 DRA) and the first session of Phase 3 (PI thinning) in Experiment 1. The solid and dotted lines represent the last session of Phase 2 and the first session of Phase 3, respectively. The dotted line represents the first session of Phase 3. The symbols on the dotted lines represent the time at which a reinforcer was delivered on the PI schedule in Phase 3. The insets in each panel show this same data but with zoomed-in axes. The arrows indicate the time at which resurgence began to occur based on visual inspection with text noting the session time (i.e., value of x) and the programmed alternative IRI at that time.
Figure 4.
Figure 4.
Programmed alternative IRI during which resurgence began to occur within-session across the first six sessions of exposure to the Phase 3 PI thinning condition in Experiment 1. Details of how IRIs were identified can be found in the text.
Figure 5.
Figure 5.
Average target and alternative responding in all phases of Experiment 2. Closed circles represent the PI group, and open circles represent the FI Control group. Dotted and solid lines represent target and alternative responding, respectively. Error bars represent standard error of the mean.
Figure 6.
Figure 6.
Pearson’s product-moment correlation coefficient in four-session blocks during Phase 3 (PI Thinning) for the PI group in Experiment 2. Data points correspond to correlations between target response rates (resp/min) and alternative IRI length (s) over four-session blocks of PI thinning. An asterisk indicates a statistically significant correlation coefficient with the criterion of α = .05.
Figure 7.
Figure 7.
Cumulative target responding as a function of session time in the last session of Phase 2 (FI 10 DRA) and the first session of Phase 3 (Thinning) in Experiment 2. The solid and dotted lines represent the last session of Phase 2 and the first session of Phase 3, respectively. The symbols on the dotted lines represent the time at which a reinforcer was delivered on the PI or FI 105-s schedule in Phase 3. Other details are as in Figure 3.
Figure 8.
Figure 8.
Cumulative target responding as a function of cumulative alternative reinforcer deliveries in the last session of Phase 2 (FI 10 DRA) and the first session of Phase 3 (Thinning) in Experiment 2. The symbols on the dotted lines represent the time at which a reinforcer was delivered on the PI or FI 105-s schedule in Phase 3. Note that only the first 15 reinforcer deliveries are shown and some subjects have their data paths clipped at the y-axis limit.
Figure 9.
Figure 9.
The onset of resurgence across the first seven Phase 3 thinning sessions in Experiment 2. The top panel shows the programmed alternative IRI during which resurgence began for individual rats in the PI group. The middle panel shows the mean session time at which resurgence began for both groups (note the logarithmic y-axis). The bottom panel shows the mean cumulative number of reinforcers after which resurgence began for both groups.

Similar articles

References

    1. Bai JYH, Cowie S, & Podlesnik CA (2017). Quantitative analysis of local-level resurgence. Learning & Behavior, 45(1), 76–88. 10.3758/s13420-016-0242-1 - DOI - PubMed
    1. Bouton ME (2019). Extinction of instrumental (operant) learning: interference, context, and contextual control. Psychopharmacology, 236(1), 7–19. 10.1007/s00213-018-5076-4 - DOI - PMC - PubMed
    1. Bouton ME, & Todd TP (2014). A fundamental role for context in instrumental learning and extinction. Behavioural Processes, 104, 13–19. 10.1016/j.beproc.2014.02.012 - DOI - PMC - PubMed
    1. Bouton ME, Winterbauer NE, & Todd TP (2012). Relapse processes after the extinction of instrumental learning: Renewal, resurgence, and reacquisition. Behavioural Processes, 90, 130–141. 10.1016/j.beproc.2012.03.004. - DOI - PMC - PubMed
    1. Briggs AM, Fisher WW, Greer BD, & Kimball RT (2018). Prevalence of resurgence of destructive behavior when thinning reinforcement schedules during functional communication training. Journal of Applied Behavior Analysis, 51(3), 620–633. 10.1002/jaba.472 - DOI - PMC - PubMed

Publication types