. 2021 May;99(5):446-461.
doi: 10.1002/cyto.a.24317. Epub 2021 Feb 16.

A streamlined whole blood CyTOF workflow defines a circulating immune cell signature of COVID-19

Affiliations

A streamlined whole blood CyTOF workflow defines a circulating immune cell signature of COVID-19

Daniel Geanon et al. Cytometry A. 2021 May.

Abstract

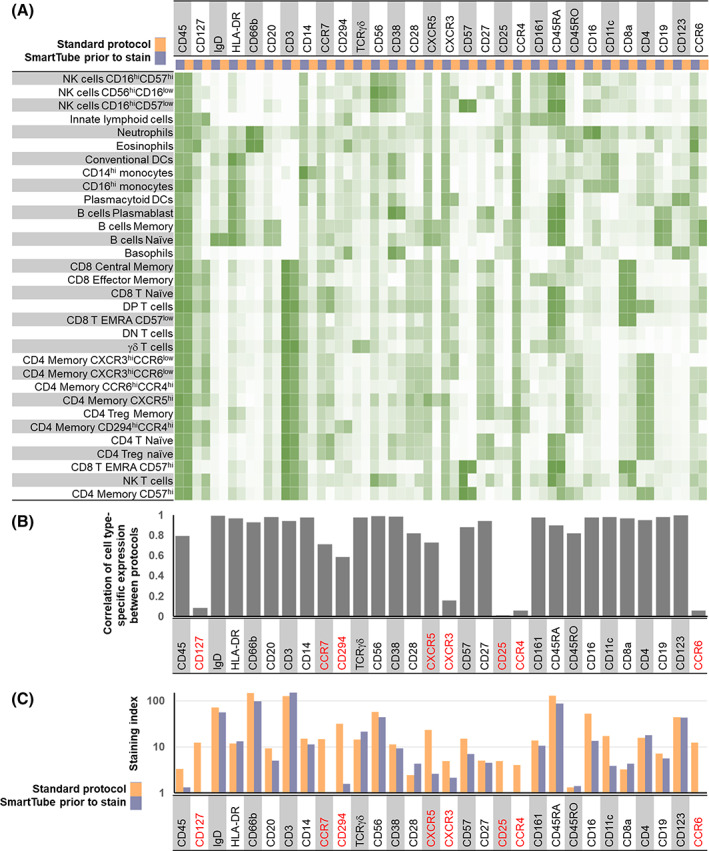
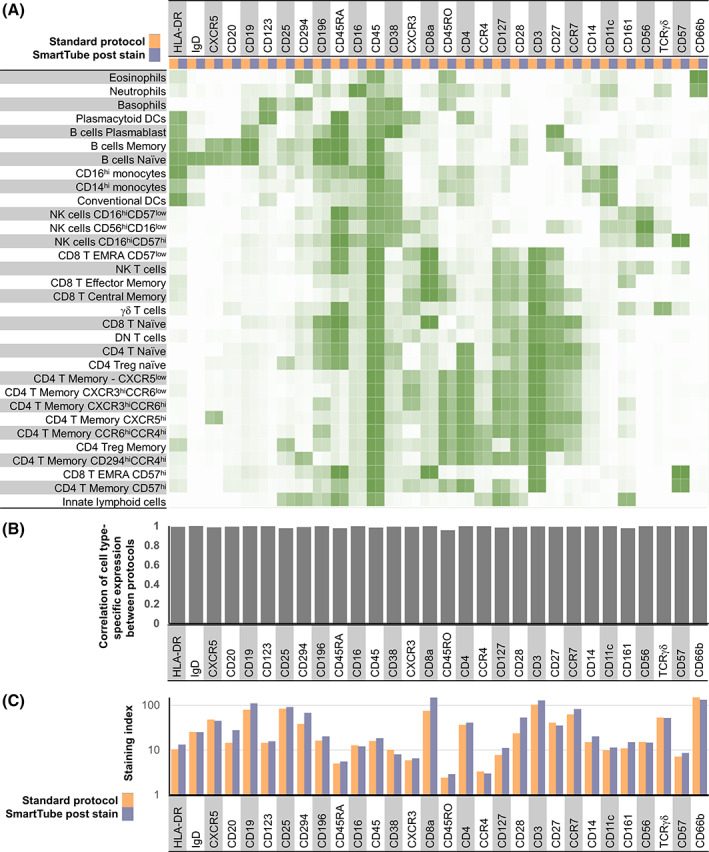
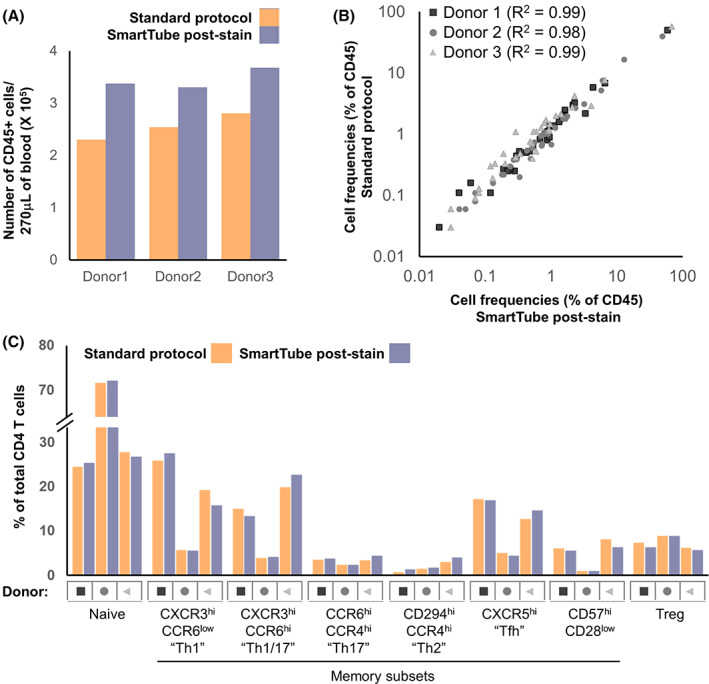
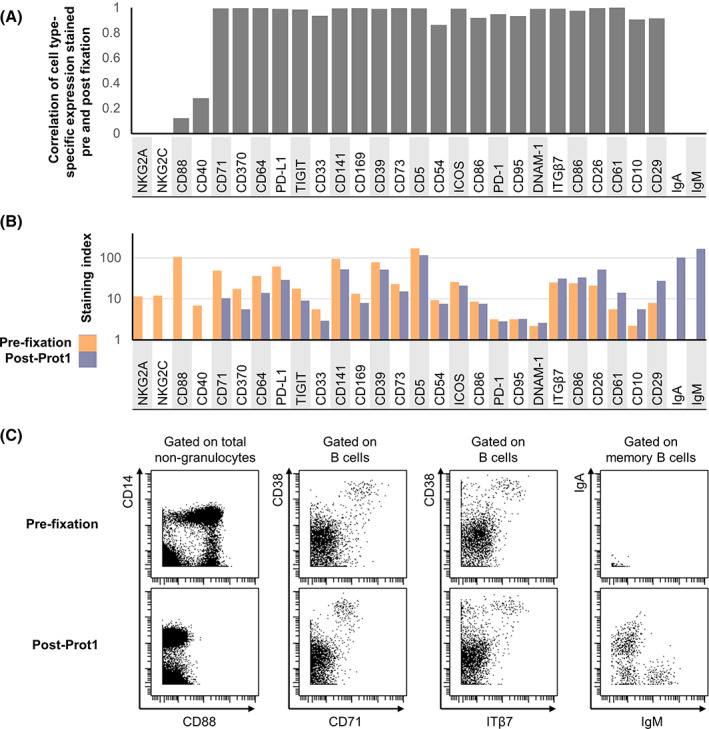
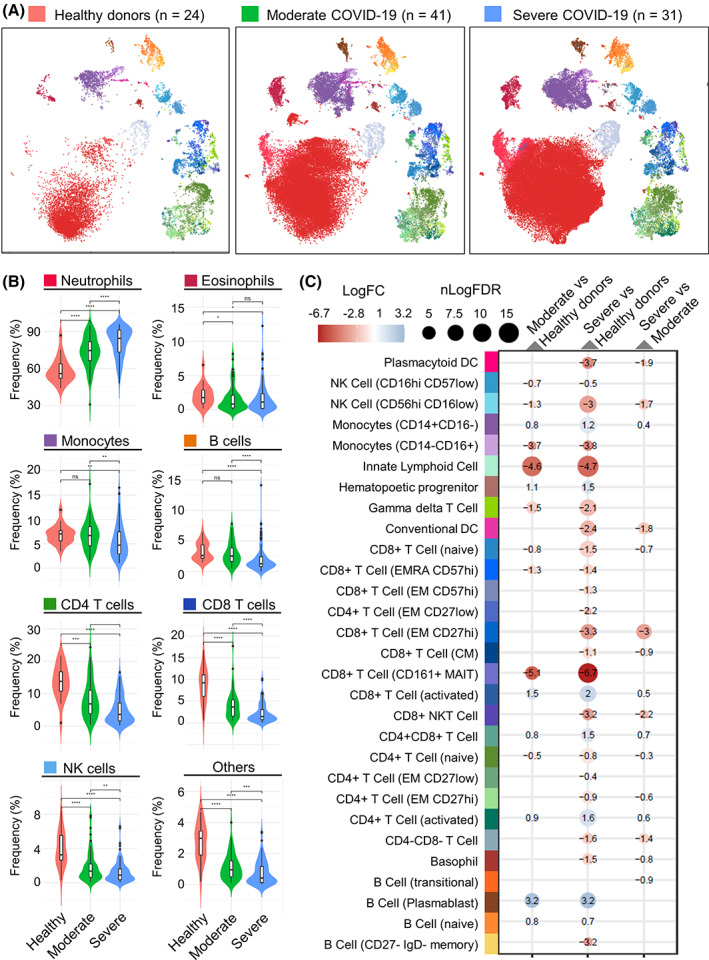
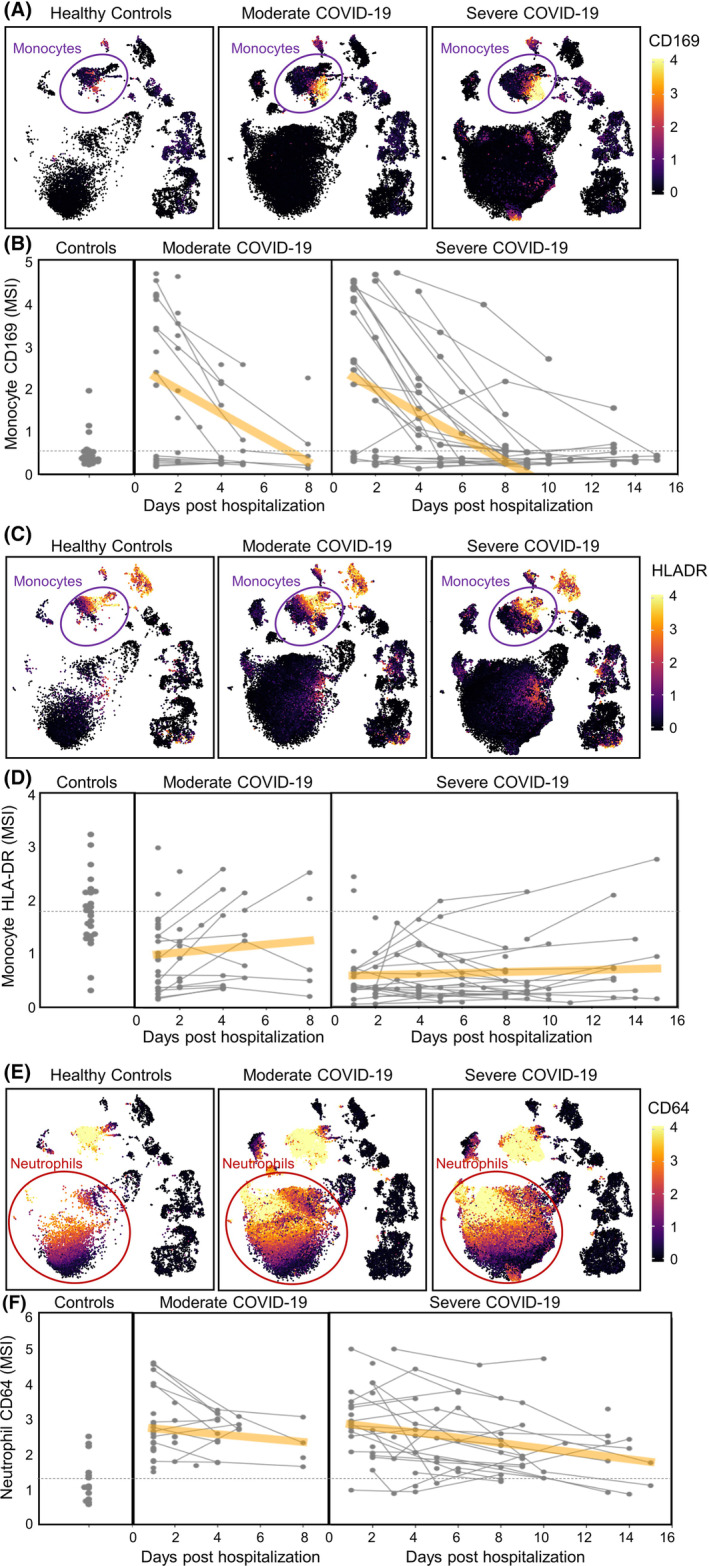
Mass cytometry (CyTOF) represents one of the most powerful tools in immune phenotyping, allowing high throughput quantification of over 40 parameters at single-cell resolution. However, wide deployment of CyTOF-based immune phenotyping studies are limited by complex experimental workflows and the need for specialized CyTOF equipment and technical expertise. Furthermore, differences in cell isolation and enrichment protocols, antibody reagent preparation, sample staining, and data acquisition protocols can all introduce technical variation that can confound integrative analyses of large data-sets of samples processed across multiple labs. Here, we present a streamlined whole blood CyTOF workflow which addresses many of these sources of experimental variation and facilitates wider adoption of CyTOF immune monitoring across sites with limited technical expertise or sample-processing resources or equipment. Our workflow utilizes commercially available reagents including the Fluidigm MaxPar Direct Immune Profiling Assay (MDIPA), a dry tube 30-marker immunophenotyping panel, and SmartTube Proteomic Stabilizer, which allows for simple and reliable fixation and cryopreservation of whole blood samples. We validate a workflow that allows for streamlined staining of whole blood samples with minimal processing requirements or expertise at the site of sample collection, followed by shipment to a central CyTOF core facility for batched downstream processing and data acquisition. We apply this workflow to characterize 184 whole blood samples collected longitudinally from a cohort of 72 hospitalized COVID-19 patients and healthy controls, highlighting dynamic disease-associated changes in circulating immune cell frequency and phenotype.

Keywords: COVID-19; CyTOF; human whole blood immunophenotyping; mass cytometry.


Conflict of interest statement

The authors have no conflicts to disclose.

Figures

FIGURE 1
FIGURE 1
Application of the MDIPA panel to whole blood post‐SmartTube fixation negatively impacts resolution of some markers in the panel. Parallel aliquots of whole blood from the same heparin collection tube were stained using the conventional MDIPA workflow or post‐SmartTube fixation. (A) Heatmap of median marker expression of each marker on manually gated immune subsets using the two workflows. (B) Pearson's coefficient of the correlation of the expression of each marker across all subsets using the two workflows. (C) Staining index of each marker using the two workflows [Color figure can be viewed at wileyonlinelibrary.com]
FIGURE 2
FIGURE 2
SmartTube‐fixation of MDIPA‐stained blood accurately reproduces staining patterns obtained with the conventional MDIPA workflow. Parallel aliquots of whole blood from the same heparin collection tube were stained using MDIPA panel and subsequently processed using the conventional MDIPA workflow or the modified SmartTube workflow. (A) Heatmap of median marker expression of each marker on manually gated immune subsets using the two workflows. (B) Pearson's coefficient of the correlation of the expression of each marker across all subsets using the two workflows. (C) Staining index of each marker using the two workflows [Color figure can be viewed at wileyonlinelibrary.com]
FIGURE 3
FIGURE 3
SmartTube‐fixation of MDIPA‐stained blood improves recovery and accurately reproduces cell frequencies obtained with the conventional MDIPA workflow. Parallel aliquots of whole blood from three donors were stained and analyzed as in Figure 3. (A) Overall recovery of CD45+ cells using the two workflows. (B) Correlation of overall cell frequencies for each gated cell type across all three donors. (C) Frequency of CD4+ memory T helper subsets defined by chemokine receptor expression using the two workflows [Color figure can be viewed at wileyonlinelibrary.com]
FIGURE 4
FIGURE 4
Evaluation of fixation‐stable markers to supplement the core MDIPA panel on SmartTube‐fixed whole blood. Aliquots of whole blood were stained with several panels of antibodies either prior to or following SmartTube fixation to evaluate the fixation sensitivity of different antibody clones. Each panel shared a core set of fixation‐stable markers, which were used to gate major immune cell subsets. (A) Pearson's coefficient of the correlation in the staining pattern of each antibody across the defined immune cell subsets when stained on fresh blood or post‐SmartTube fixation. (B) Staining index of each antibody when stained on fresh blood or post‐SmartTube fixation. (C) Representative biaxial plots highlighting staining patterns for antibodies where SmartTube fixation resulted in complete signal loss (CD88), reduced but still resolvable signal (CD71) or improved signal (ITß7, IgM, and IgA) [Color figure can be viewed at wileyonlinelibrary.com]
FIGURE 5
FIGURE 5
Application of the SmartTube MDIPA workflow to immune monitoring of COVID‐19 patients. A total of 184 whole blood aliquots were collected from 24 healthy donors and 72 hospitalized COVID‐19 patients (61 samples from 41 patients with moderate disease and 102 samples from 31 patients with severe disease) and stained with the MDIPA‐SmartTube workflow as described above. Samples were clustered and meta‐clustered with using the Leiden community detection algorithm and the meta‐clusters were aggregated and annotated to define cell subsets. (A) UMAP plots showing the phenotypic distribution of cells in aggregated samples across the three subject groups with colors representing annotated immune cell subsets. To allow effective visualization of the large volume of data, each point on each UMAP represents a K‐means down‐sampled cluster from each of the analyzed samples (1000 clusters per sample). (B) Violin plots showing the changes in relative frequency of major immune cell subsets as a percentage of all CD45+ cells across the three cohorts. Cell type colors are broadly aligned to the UMAP plots in A, and asterisks indicate statistically significant differences between groups based on Wilcoxon signed‐rank tests. (C) Integrated heatmap/dotplot showing fold change and false discovery rate (FDR) between the three cohorts of more granularly‐defined immune cell subsets as a percentage of non‐neutrophils. The only cell types shown are those that passed FDR threshold in one of the comparisons. Cell type colors are exactly aligned to the UMAP plots in A [Color figure can be viewed at wileyonlinelibrary.com]
FIGURE 6
FIGURE 6
Identification of both dynamic and durable changes in myeloid cell phenotype in COVID‐19 patients. Longitudinal aliquots of whole blood from 72 hospitalized COVID‐19 patients (41 with moderate disease and 31 with severe disease) and 24 healthy donors were stained with the MDIPA‐SmartTube workflow and analyzed as described. (A) UMAP plots matched to those in Figure 5A showing median expression of CD169 on aggregated samples from each of the three cohorts. Each point on each UMAP represents a K‐means down‐sampled cluster from each of the analyzed samples (1000 clusters per sample), colored by median arcsinh‐transformed CD169 intensity. (B) Median arcsinh‐transformed CD169 intensity on annotated CD14 + CD16− monocytes is shown for each sample in each cohort over the collection period. Each point represents a whole blood sample and collection date relative to initial date of hospitalization, and longitudinal samples from the same subject are indicated by linked lines. The dashed line indicates the mean CD169 expression in the control cohort and the orange line represents a linear regression to indicate the time dependency of marker changes within each of the COVID‐19 cohorts. (C and D) Similar representations of HLA‐DR intensity visualized by UMAP, and longitudinal changes of arcsinh‐transformed median HLA‐DR intensity on CD14 + CD16− monocytes. (E and F) Similarly representations of CD64 intensity visualized by UMAP, and longitudinal changes of arcsinh‐transformed median CD64 intensity on annotated neutrophils [Color figure can be viewed at wileyonlinelibrary.com]

Update of

References

    1. Chan RC‐F, Kotner JS, Chuang CM‐H, Gaur A. Stabilization of pre‐optimized multicolor antibody cocktails for flow cytometry applications. Cytometry B Clin Cytom. 2017;92:508–24. - PubMed
    1. Bagwell CB, Hunsberger B, Hill B, Herbert D, Bray C, Selvanantham T, et al. Multi‐site reproducibility of a human immunophenotyping assay in whole blood and peripheral blood mononuclear cells preparations using CyTOF technology coupled with Maxpar Pathsetter, an automated data analysis system. Cytometry B Clin Cytom. 2020;98:146–60. - PMC - PubMed
    1. Charney AW, Simons NW, Mouskas K, Lepow L, Cheng E, Le Berichel J, et al. Sampling the host response to SARS‐CoV‐2 in hospitals under siege. Nat Med. 2020;26:1157–8. - PubMed
    1. Jureka AS, Silvas JA, Basler CF. Propagation, inactivation, and safety testing of SARS‐CoV‐2. Viruses. 2020;12(6):622. 10.3390/v12060622. - DOI - PMC - PubMed
    1. Amir E‐AD, Guo XV, Mayovska O, Rahman AH. Average overlap frequency: a simple metric to evaluate staining quality and community identification in high dimensional mass cytometry experiments. J Immunol Methods. 2018;453:20–9. - PubMed

Publication types

MeSH terms

LinkOut - more resources