. 2021 Mar 1;220(3):e202007059.
doi: 10.1083/jcb.202007059.

ANO5 ensures trafficking of annexins in wounded myofibers

Affiliations

ANO5 ensures trafficking of annexins in wounded myofibers

Steven J Foltz et al. J Cell Biol. .

Abstract

Mutations in ANO5 (TMEM16E) cause limb-girdle muscular dystrophy R12. Defective plasma membrane repair is a likely mechanism. Using myofibers from Ano5 knockout mice, we show that trafficking of several annexin proteins, which together form a cap at the site of injury, is altered upon loss of ANO5. Annexin A2 accumulates at the wound to nearly twice the level observed in WT fibers, while annexin A6 accumulation is substantially inhibited in the absence of ANO5. Appearance of annexins A1 and A5 at the cap is likewise diminished in the Ano5 knockout. These changes are correlated with an alteration in annexin repair cap fine structure and shedding of annexin-positive vesicles. We conclude that loss of annexin coordination during repair is disrupted in Ano5 knockout mice and underlies the defective repair phenotype. Although ANO5 is a phospholipid scramblase, abnormal repair is rescued by overexpression of a scramblase-defective ANO5 mutant, suggesting a novel, scramblase-independent role of ANO5 in repair.


Figures

Figure 1.
Figure 1.
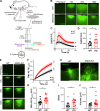
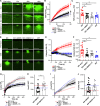
Plasma membrane repair is defective in ANO5-KO mouse muscle fibers. (A) Workflow for laser injury assay. FDB myofibers were isolated and damaged with 405-nm light directed at the plasma membrane on the lateral edge of the fiber. (B) Representative images of cytosolic Ca2+ detected with Cal-520 following membrane damage in WT or ANO5-KO fibers. t = 0 is before injury (WT and ANO5-KO data points superimposed). Scale bars = 10 µm. (C and D) Cal-520 fluorescence time course after injury, normalized to initial fluorescence (C) and AUC values (D) for individual WT or KO fibers. ANO5-KO n = 12 fibers from three mice, WT n = 18 fibers from two mice. (E) Representative images of FM1-43 infiltration following membrane damage in WT or ANO5-KO fibers. Scale bars = 10 µm. (F and G) Time course of FM1-43 fluorescence normalized to average maximal fluorescence in ANO5-KO fibers (FmaxKO; G) and AUC values for individual WT or KO fibers (G). ANO5-KO n = 17 fibers from three mice, WT n = 22 fibers from three mice. (H) Maximum intensity projections of FM1-43 fluorescence generated from z-stacks of WT or ANO5-KO fibers acquired ∼10 min after injury. (I and J) Quantification of FM1-43–labeled blebs in the repair patch following injury (I) and patch volumes (J). Blebbing of the patch in ANO5-KO fibers contributed to a significant increase in overall patch volume. ANO5-KO n = 17 fibers from three mice, WT n = 14 fibers from two mice. Data are mean ± SEM. *, P < 0.05. Scale bar = 10 μm.
Figure 2.
Figure 2.
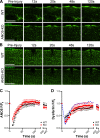
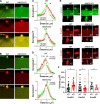
ANO5 accumulates at the plasma membrane in response to wounding. (A and B) Deconvolved images of ANO5 (A) or dysferlin (B) translocation to wound-adjacent plasma membrane in WT or ANO5-KO fibers after injury. Scale bars = 10 µm. (C) Quantification of ANO5 fluorescence at the site of injury in ANO5-KO or WT fibers, normalized to fluorescence before injury. ANO5-KO n = 16 fibers from four mice, WT n = 15 fibers from four mice. (D) Quantification of dysferlin fluorescence in ANO5-KO (red squares) or WT (black circles) myofibers following injury. The time course of hANO5 accumulation in WT fibers is shown as a blue dotted line. ANO5-KO n = 11 fibers from two mice, WT n = 9 fibers from three mice. Data are mean ± SEM.
Figure S1.
Figure S1.
Rapid ANO5 accumulation at injury sites is not explained by FRAP or localized fiber contraction. (A) Time constants and associated errors from single exponential fits of ANO5 or dysferlin accumulation time courses (from Fig. 2). (B) Deconvolved images showing human ANO5-tomato after bleaching with an 8-s 561-nm laser pulse. (C) Quantification of human ANO1 fluorescence at wound-adjacent sarcolemma following 405-nm laser injury or ANO5 fluorescence after 561-nm laser bleaching in WT mouse myofibers. Fluorescence is normalized to prelaser fluorescence values. Time course of human ANO5 accumulation in WT fibers (from Fig. 2) is shown as a blue dotted line for comparison. ANO1 n = 10 fibers pooled from two mice, ANO5 n = 8 fibers from one mouse. (D) Images showing the contribution of localized myofiber contraction after injury to the apparent accumulation of plasma membrane proteins at the wound site. (E and F) Line profile analysis of ANO1 (E) or ANO5 (F) fluorescent intensity before (Initial) or after (Max) laser injury. Fluorescence values are measured from dotted lines as shown in top-row images of D. “Distance” is in units of micrometers along the analysis line, centered on the maximal relative fluorescence. ANO1 n = 8 fibers pooled from two mice, ANO5 n = 9 fibers pooled from four mice. Data are mean ± SEM. Scale bar = 10 μm.
Figure S2.
Figure S2.
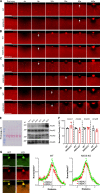
Abnormal annexin trafficking and accumulation in ANO5-KO mouse muscle fibers. (A–D) Representative images of ANXA1 (A), ANXA2 (B), ANXA5 (C), and ANXA6 (D) in WT or ANO5-KO fibers following laser-induced injury. White arrows mark the first appearance of annexin in the cap. Scale bars = 10 µm. ANXA1: ANO5-KO n = 18 fibers, WT n = 14 fibers; ANXA2: ANO5-KO n = 42 fibers, WT n = 37 fibers; ANXA5: ANO5-KO n = 36 fibers, WT n = 29 fibers; ANXA6: ANO5-KO n = 20 fibers, WT n = 31 fibers. (E) Western blot analysis of annexin expression in WT or ANO5-KO mice. Ponceau S is shown as a loading control. (F) Densitometry of annexin Western blots, normalized to Ponceau S and expressed as %WT expression. WT n = 3 mice, ANO5-KO n = 3 mice. (G) Images and quantification of spatial organization of ANXA1 in the repair cap as in Fig. 4, A–D. WT n = 14 fibers pooled from two mice, KO n = 15 fibers pooled from two mice.
Figure 3.
Figure 3.
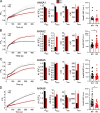
The kinetics of annexin trafficking are changed in ANO5-KO fibers. (A–D) Time courses of annexin fluorescence as a function of time after injury were fitted to the sum of two exponentials (black lines). Amplitudes, A, and time constants, τ, are shown for the fast and slow components of the curves. AUCs for individual WT or KO fibers are also shown. Data were compared for WT or ANO5-KO fibers expressing ANXA1 (A), ANXA2 (B), ANXA5 (C), and ANXA6 (D). ANXA1: ANO5-KO n = 18 fibers from three mice, WT n = 14 fibers from two mice; ANXA2: ANO5-KO n = 42 fibers from five mice, WT n = 37 fibers from five mice; ANXA5: ANO5-KO n = 36 fibers from four mice, WT n = 29 fibers from three mice; ANXA6: ANO5-KO n = 20 fibers from three mice, WT n = 31 fibers from four mice. Data are mean ± SEM. *, P < 0.05.
Figure 4.
Figure 4.
Architecture of the annexin repair cap is lost in ANO5-KO fibers. (A and B) Representative images of coelectroporated ANXA2 and ANXA5 (A) or ANXA2 and ANXA6 (B) in injured muscle fibers. Scale bars = 10 µm. (C and D) Quantification of the spatial organization of annexin proteins derived from line profiles drawn through the repair cap images taken ∼7 min after injury. ANXA2 and ANXA5: ANO5-KO n = 23 fibers from three mice, WT n = 26 fibers from three mice; ANXA2 and ANXA6: ANO5-KO n = 18 fibers from three mice, WT n = 14 fibers from two mice. (E) Orthogonal views of the annexin repair cap generated from z-stacks acquired ∼10 min after injury. Scale bars = 5 µm. (F) Volumes for individual annexin proteins in repair caps following injury. Z-plane images were acquired every 0.5 µm. ANXA2: ANO5-KO n = 35 fibers from four mice, WT n = 36 fibers from four mice; ANXA5: ANO5-KO n = 32 fibers from three mice, WT n = 37 fibers from four mice; ANXA6: ANO5-KO n = 13 fibers from two mice, WT n = 21 fibers from three mice. Data are mean ± SEM. *, P < 0.05.
Figure 5.
Figure 5.
ANO5 is not required for exposure of PtdSer or PtdEtn following injury. (A) Representative images showing accumulation of the PtdSer sensor LactC2-Clover after laser-mediated injury. The cell boundary is indicated by a dotted white line. Scale bars = 10 µm. (B) Time course of LactC2-FP accumulation after damage, normalized to initial fluorescence at the injury site. (C) LactC2 AUC for initial (0–100 s) and late (100–437 s) stages of the repair time course. ANO5-KO n = 23 fibers from six mice, WT n = 20 fibers from two mice. (D) PtdEtn, detected by Cy3-conjugated duramycin, appears rapidly at the repair patch following wounding. The cell boundary is marked by a dotted white line. Scale bar = 10 µm. (E) Quantification of PtdEtn kinetics, indicating rapid, ANO5-independent recruitment of PtdEtn to the extracellular surface of muscle fibers after damage. Inset in top left of plot highlights the difference in initial PtdEtn accumulation. (F) Dur-Cy3 AUC for initial (0–100 s) and late (100–437 s) stages of the repair time course. ANO5-KO n = 9 fibers from two mice, WT n = 21 fibers from two mice. Data are mean ± SEM. *, P < 0.05.
Figure S3.
Figure S3.
Ano5 but not Ano6 mRNA is increased during myogenesis, and Ano6 expression is not changed in myocytes or myotubes from ANO5-KO mice. (A) mRNA expression of Ano5 in WT or ANO5-KO mouse MPCs differentiated for 18 h (myocytes, left) or 72 h (myotubes, right). *, P < 0.05; **, P < 0.01. (B) mRNA expression of Ano6 in WT or ANO5-KO mouse MPCs differentiated for 18 h (myocytes, left) or 72 h (myotubes, right). WT n = 3, ANO5-KO n = 2. Data are mean ± SEM.
Figure 6.
Figure 6.
ANO5 does not require “scrambling domain” to rescue defective repair. (A) Deconvolved images of FM1-43 infiltration in ANO5-KO, ANO5-KO + hANO5, or ANO5-KO + ANO5-1-5 fibers before and following injury. Scale bars = 10 µm. (B and C) FM1-43 accumulation time course (B) and AUC values (C) for individual ANO5-KO, KO + hANO5, KO + ANO5-1-5, or WT fibers. ANO5-KO n = 11 fibers from three mice, ANO5-KO + hANO5 n = 16 fibers from three mice, ANO5-KO + ANO5-1-5 n = 10 fibers from three mice. Blue dotted line represents the average FM1-43 F/FmaxKO value from 11 injured WT fibers. (D) Representative images of Ca2+ transients visualized in damaged fibers with Calbryte 520. (E and F) Calbryte 520 time course (C) and AUC values (F) for individual ANO5-KO, KO + hANO5, KO + ANO5-1-5, or WT fibers. ANO5-KO n = 15 fibers from three mice, KO + ANO5 n = 16 fibers from two mice, KO + ANO5-1-5 n = 13 fibers from two mice, WT n = 9 fibers from three mice. (G and H) ANXA2 F/F0 time course (G) and AUC values (H) for individual ANO5-KO fibers + ANO5 or ANO5-1-5. KO + ANO5 n = 16 fibers from two mice, KO + ANO5-1-5 n = 16 fibers from two mice. Blue and red dotted lines represent ANXA2 accumulation in WT and ANO5-KO fibers, respectively. (I and J) ANXA6 F/F0 time course (I) and AUC values (J) for individual ANO5-KO fibers + ANO5 or ANO5-1-5. KO + ANO5 n = 24 fibers from five mice, KO + ANO5-1-5 n = 18 fibers from three mice. Blue and red dotted lines represent ANXA6 accumulation in WT and ANO5-KO fibers, respectively. Data are mean ± SEM. *, P < 0.05. Scale bar = 10 μm.
Figure 7.
Figure 7.
An R58W mutation in human patients causes defective repair in cultured muscle cells. (A) Representative images of FM1-43 infiltration in control or R58W human patient myocytes following injury. (B and C) FM1-43 accumulation time course following injury (B) and AUC values (C) for individual R58W or control myocytes. Control 1 n = 9 cells, Control 2 n = 8 cells, Patient n = 11 cells. (D) Images showing FM1-43 uptake in injured mouse ANO5-KO (KO), ANO5-KO + R58W ANO5 (KO+R58W), and WT fibers. (E and F) Kinetics of FM1-43 accumulation (E) and FM1-43 time course AUCs (F) from mouse myofibers with or without expression of R58W ANO5. ANO5-KO n = 22 fibers from four mice, ANO5-KO + R58W n = 31 fibers from four mice, WT n = 11 fibers from one mouse. (G) FM1-43 patch volumes obtained by integrating patch areas from individual slices (separated by 0.5 µm) of z-stacks acquired ∼10 min after injury. ANO5-KO n = 12 fibers from three mice, ANO5-KO + R58W n = 16 fibers from two mice. Data are mean ± SEM.
Figure S4.
Figure S4.
Expression of ANO5-R58W mutant in human or mouse muscle. (A) Quantitative RT-PCR analysis from biopsied deltoid muscle of a human LGMD2L patient (n = 1) and tibialis anterior muscles of healthy control patients (Con, n = 2) with primers directed at three regions. ANO5-R58W mutant does not produce degraded ANO5 transcript. However, because exon 4 expression is reduced, there is the possibility that the transcript is alternatively spliced or uses an alternative start codon. ANO6 mRNA is shown as a comparison. Data are mean ± SEM. (B) ANO5-R58W-mCherry is detectable when expressed in mouse muscle fibers. Left panel is differential interference contrast (DIC). Middle panel is ANO5-R58W-Cherry fluorescence of the same fibers. White boxes indicate areas enlarged in the right panels. Scale bars = 10 µm.
Figure 8.
Figure 8.
ANO5 coordinates annexin-mediated plasma membrane resealing. Top: damage to the plasma membrane leads to Ca2+ influx and initiation of repair processes. Bottom left: in normal muscle, ANO5 and dysferlin are enriched around plasma membrane wounds. Annexins are recruited to the lesion, where they assemble into an ordered cap along with PtdSer and PtdEtn. ANXA2 vesicles are shed from the cap. Bottom right: in the absence of ANO5, ANXA2 overaccumulates while ANXA5 and ANXA6 underaccumulate. Normal hierarchy of annexin species is lost within the repair cap, which features increased blebbing. Created with BioRender.com.
Figure S5.
Figure S5.
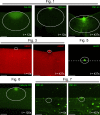
ROIs used for quantification. ROIs described in Materials and methods are shown (white ovals) on representative images from denoted figures. ROIs were moved if fibers contracted. If necessary, ROIs were reshaped to fit within fiber boundaries, but total ROI size was maintained (see Fig. 1, FM1-43). Dotted line in Fig. 5 image is the cell boundary. Scale bars = 10 µm.

Similar articles

Cited by

References

    1. Accardi, A. 2016. Mechanisms of Ion and Lipid Transport by TMEM16 Scramblases. Biophys. J. 110:174a. 10.1016/j.bpj.2015.11.968 - DOI
    1. Andreeva, T.V., Tyazhelova T.V., Rykalina V.N., Gusev F.E., Goltsov A.Y., Zolotareva O.I., Aliseichik M.P., Borodina T.A., Grigorenko A.P., Reshetov D.A., et al. . 2016. Whole exome sequencing links dental tumor to an autosomal-dominant mutation in ANO5 gene associated with gnathodiaphyseal dysplasia and muscle dystrophies. Sci. Rep. 6:26440. 10.1038/srep26440 - DOI - PMC - PubMed
    1. Andrews, N.W., and Corrotte M.. 2018. Plasma membrane repair. Curr. Biol. 28:R392–R397. 10.1016/j.cub.2017.12.034 - DOI - PubMed
    1. Bansal, D., Miyake K., Vogel S.S., Groh S., Chen C.C., Williamson R., McNeil P.L., and Campbell K.P.. 2003. Defective membrane repair in dysferlin-deficient muscular dystrophy. Nature. 423:168–172. 10.1038/nature01573 - DOI - PubMed
    1. Barthélémy, F., Defour A., Lévy N., Krahn M., and Bartoli M.. 2018. Muscle Cells Fix Breaches by Orchestrating a Membrane Repair Ballet. J. Neuromuscul. Dis. 5:21–28. 10.3233/JND-170251 - DOI - PMC - PubMed

Publication types

MeSH terms