. 2021 Jan 26;5(2):399-413.
doi: 10.1182/bloodadvances.2020002754.

PPARγ increases HUWE1 to attenuate NF-κB/p65 and sickle cell disease with pulmonary hypertension

Affiliations

PPARγ increases HUWE1 to attenuate NF-κB/p65 and sickle cell disease with pulmonary hypertension

Andrew J Jang et al. Blood Adv. .

Abstract

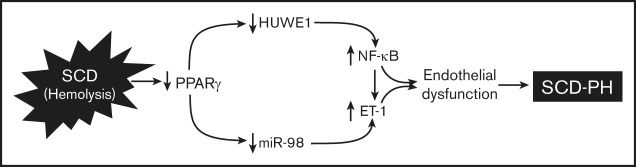
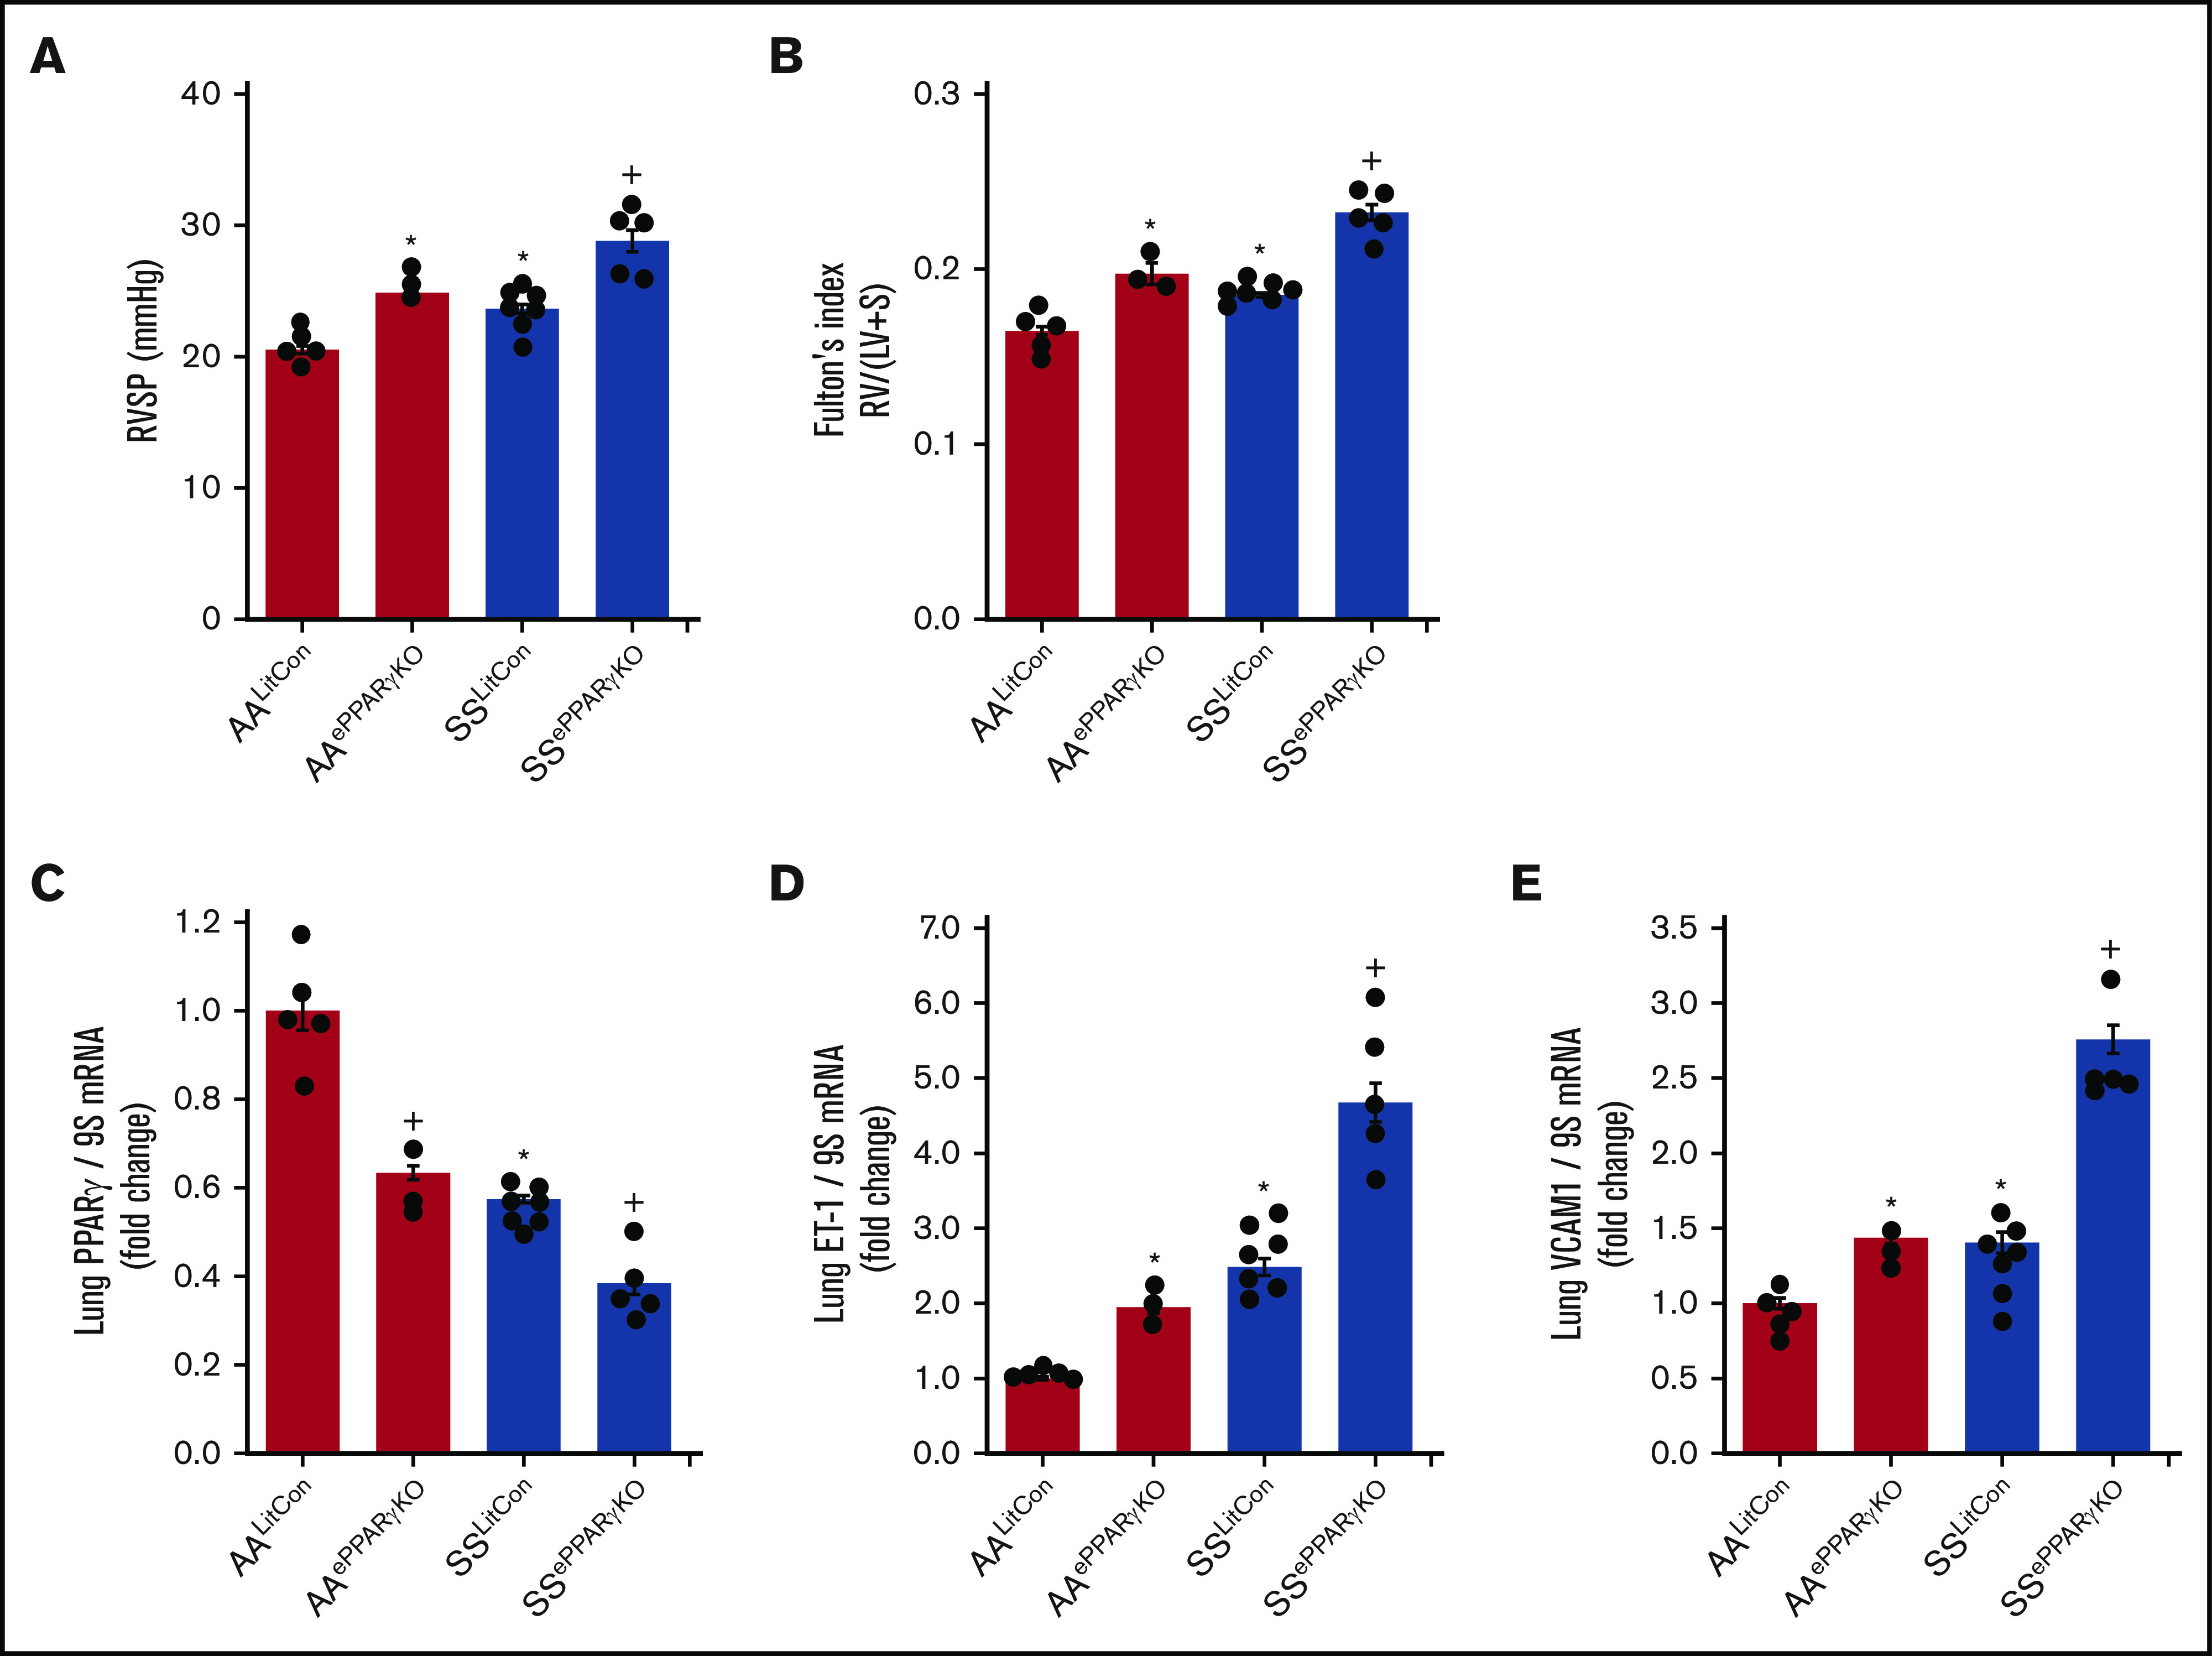
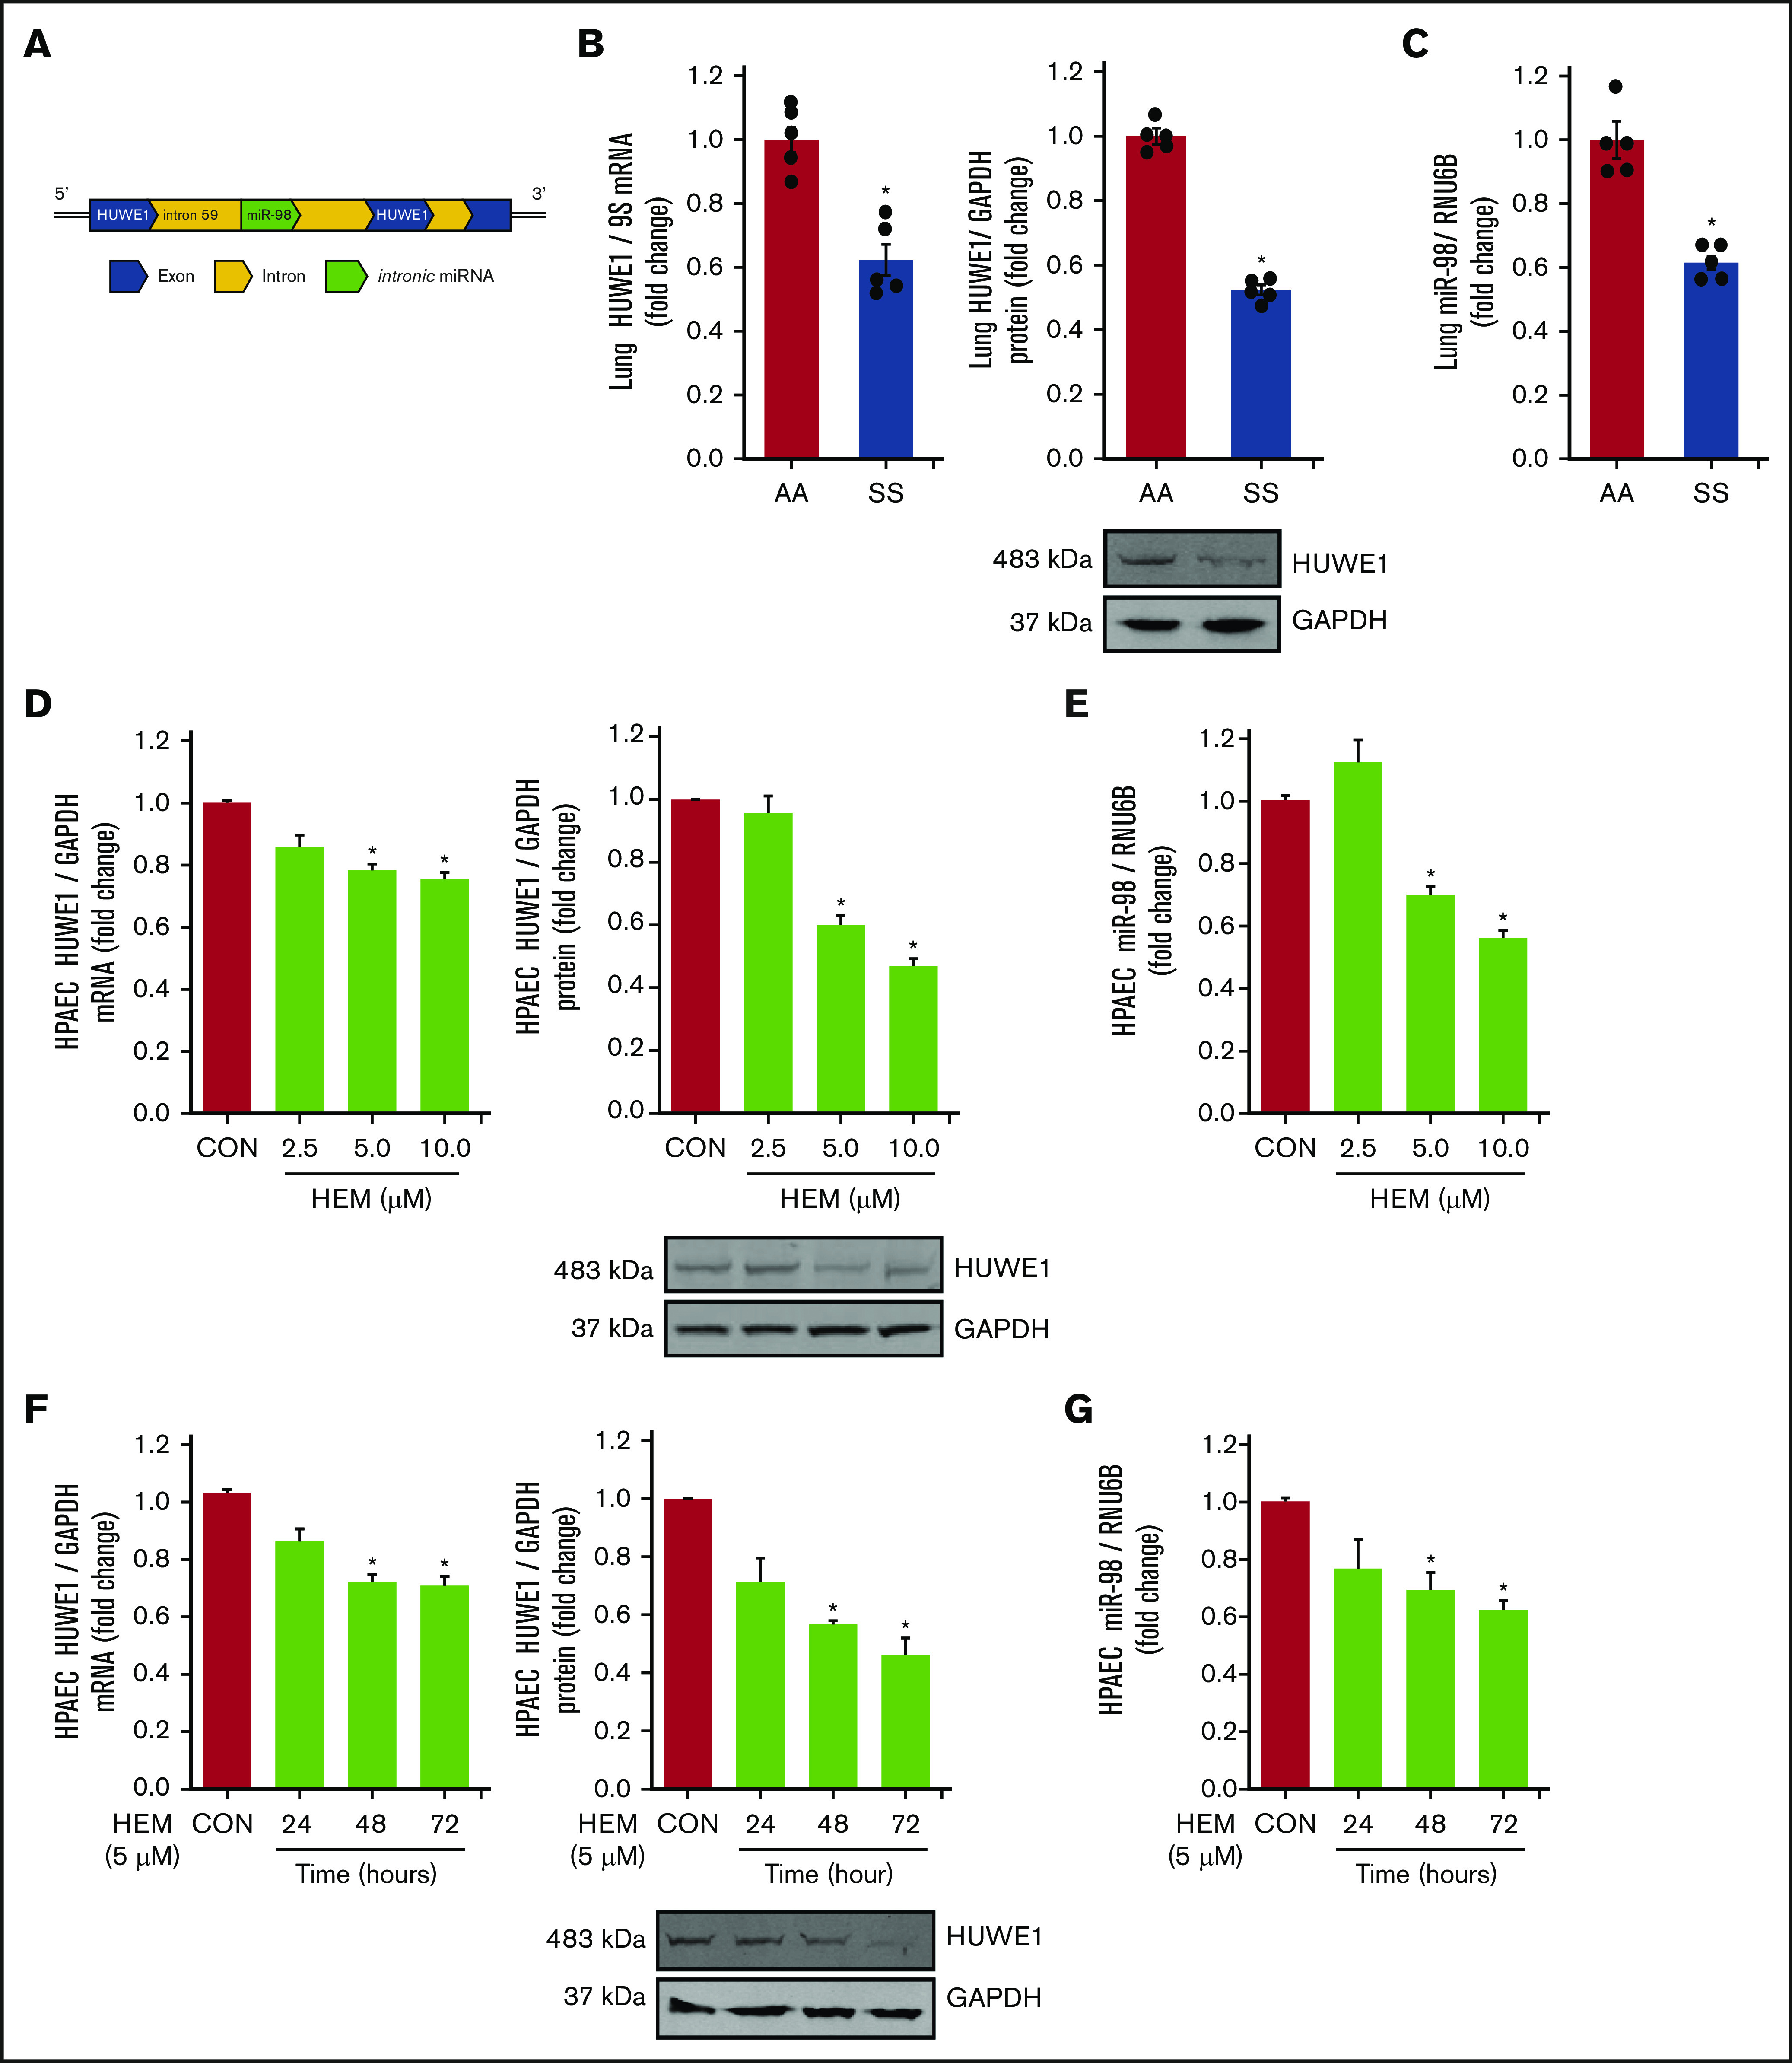
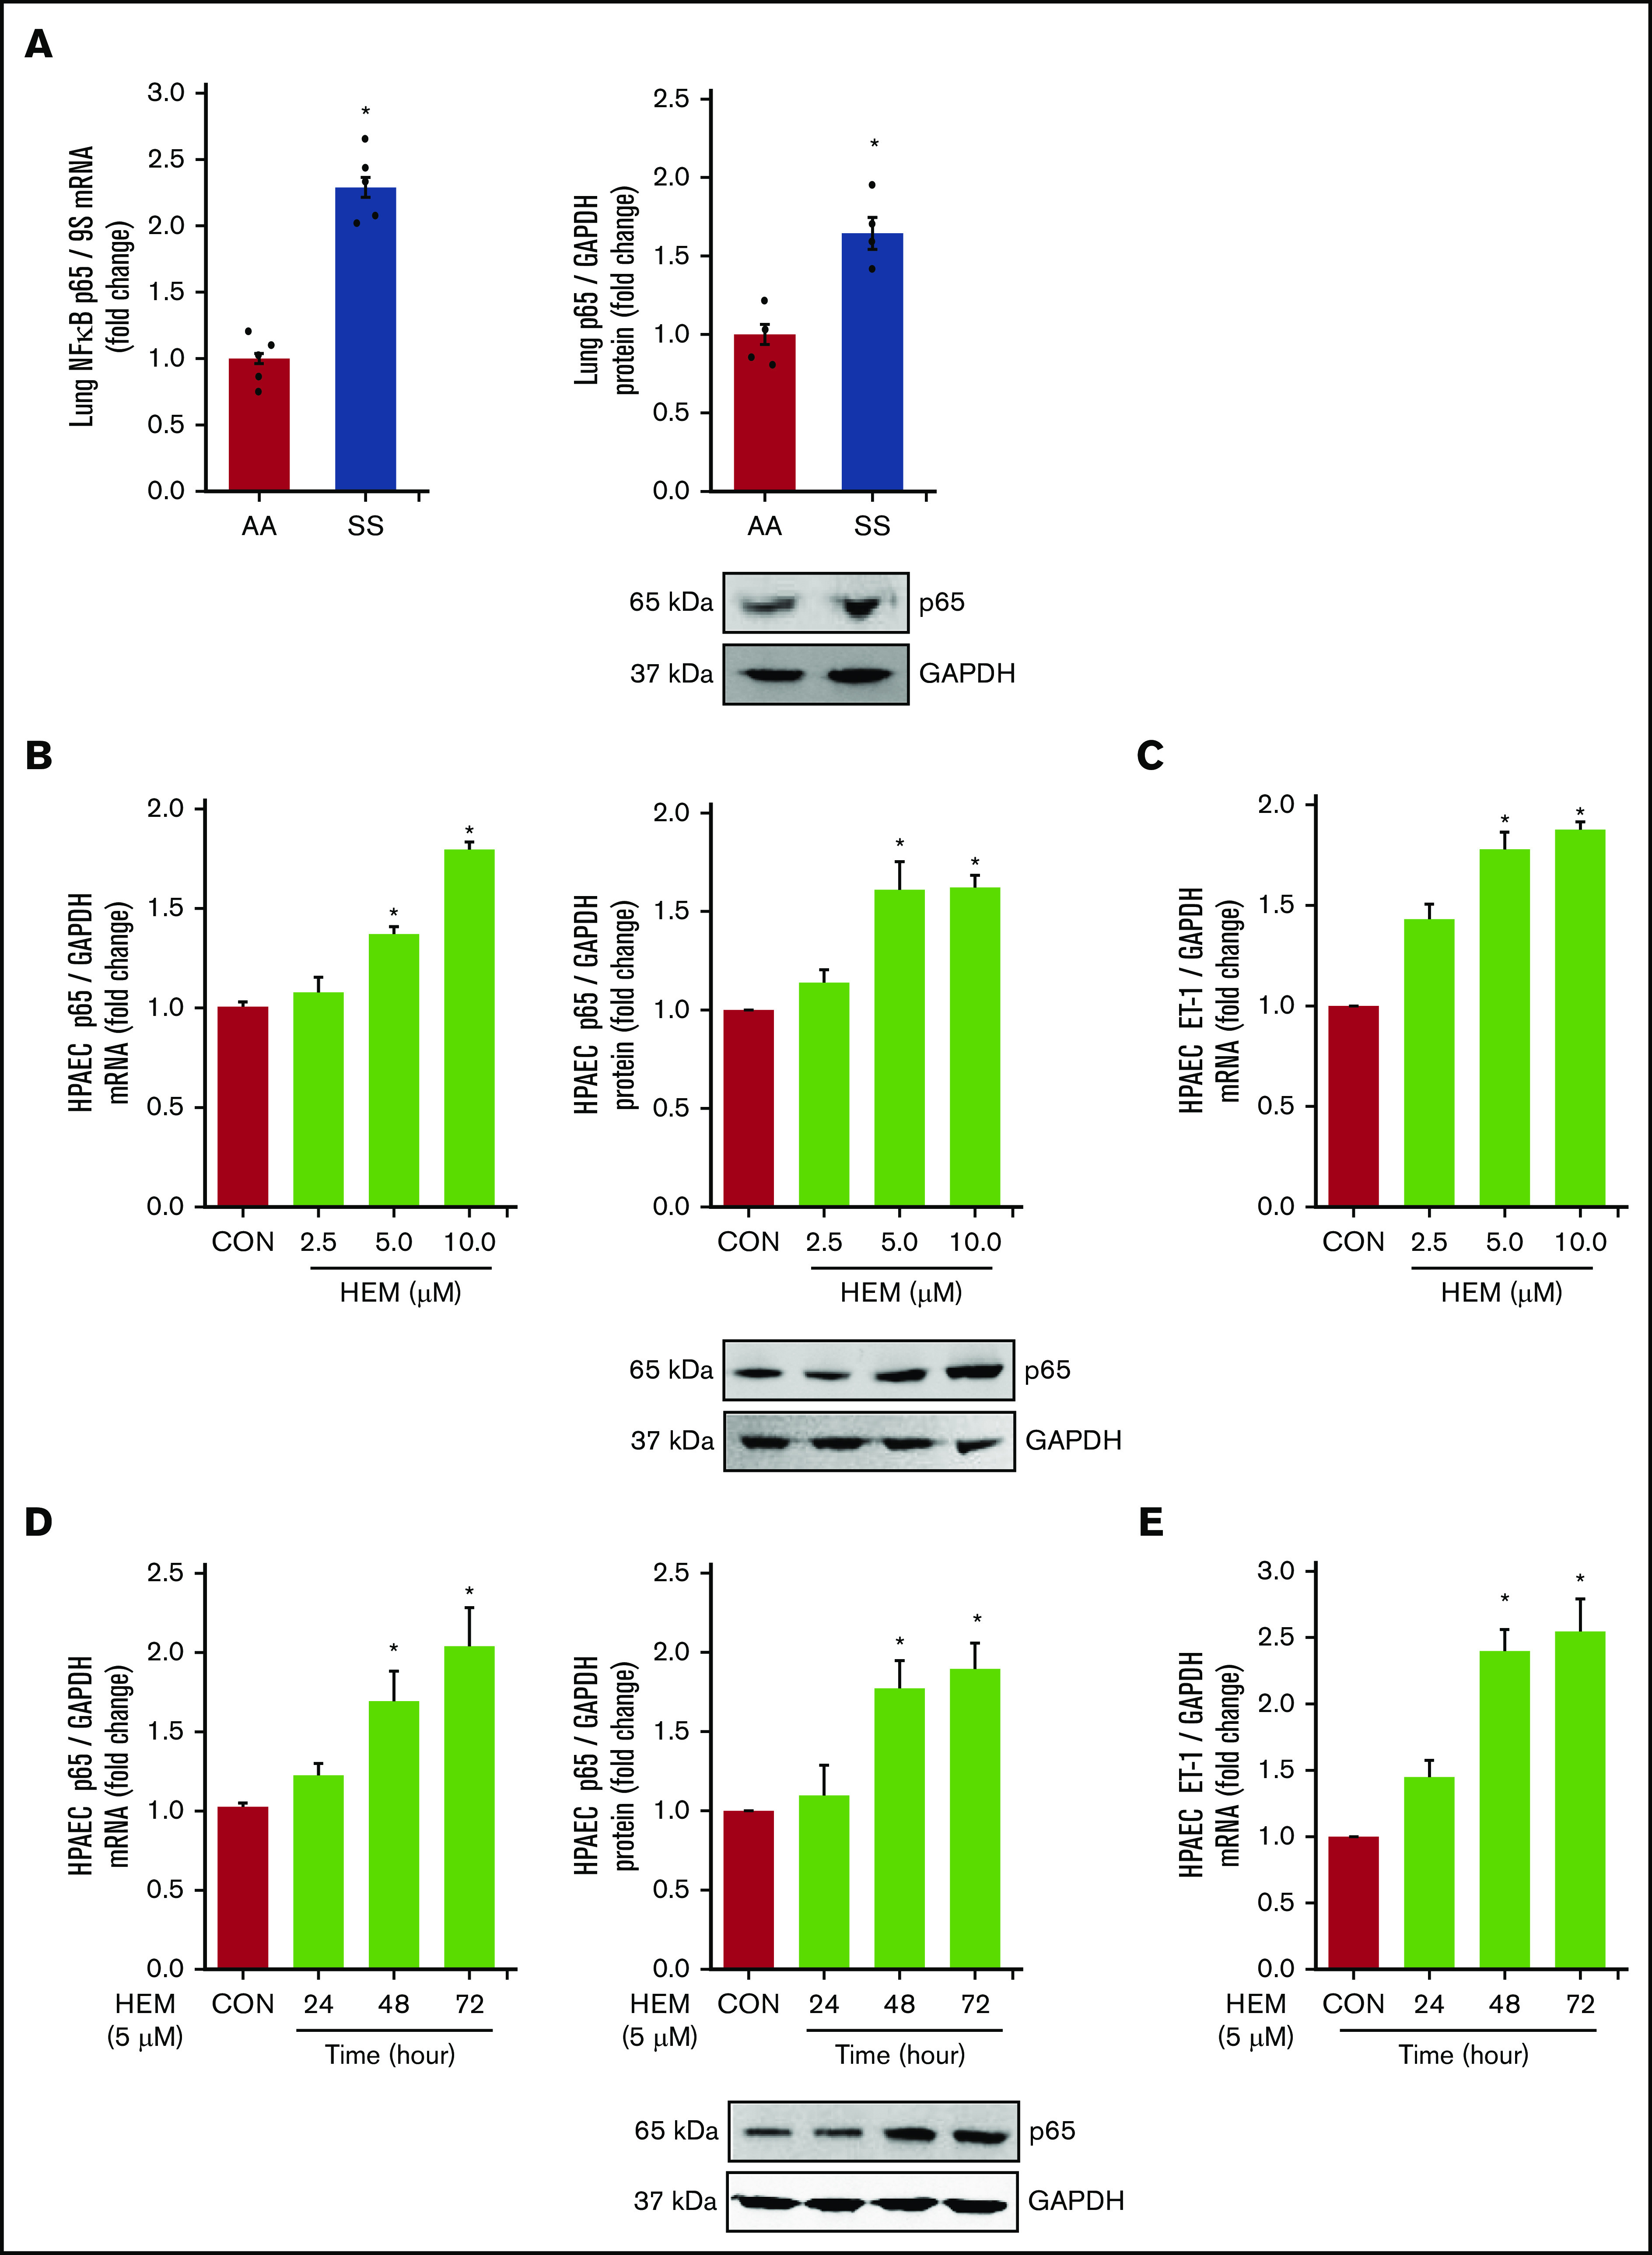
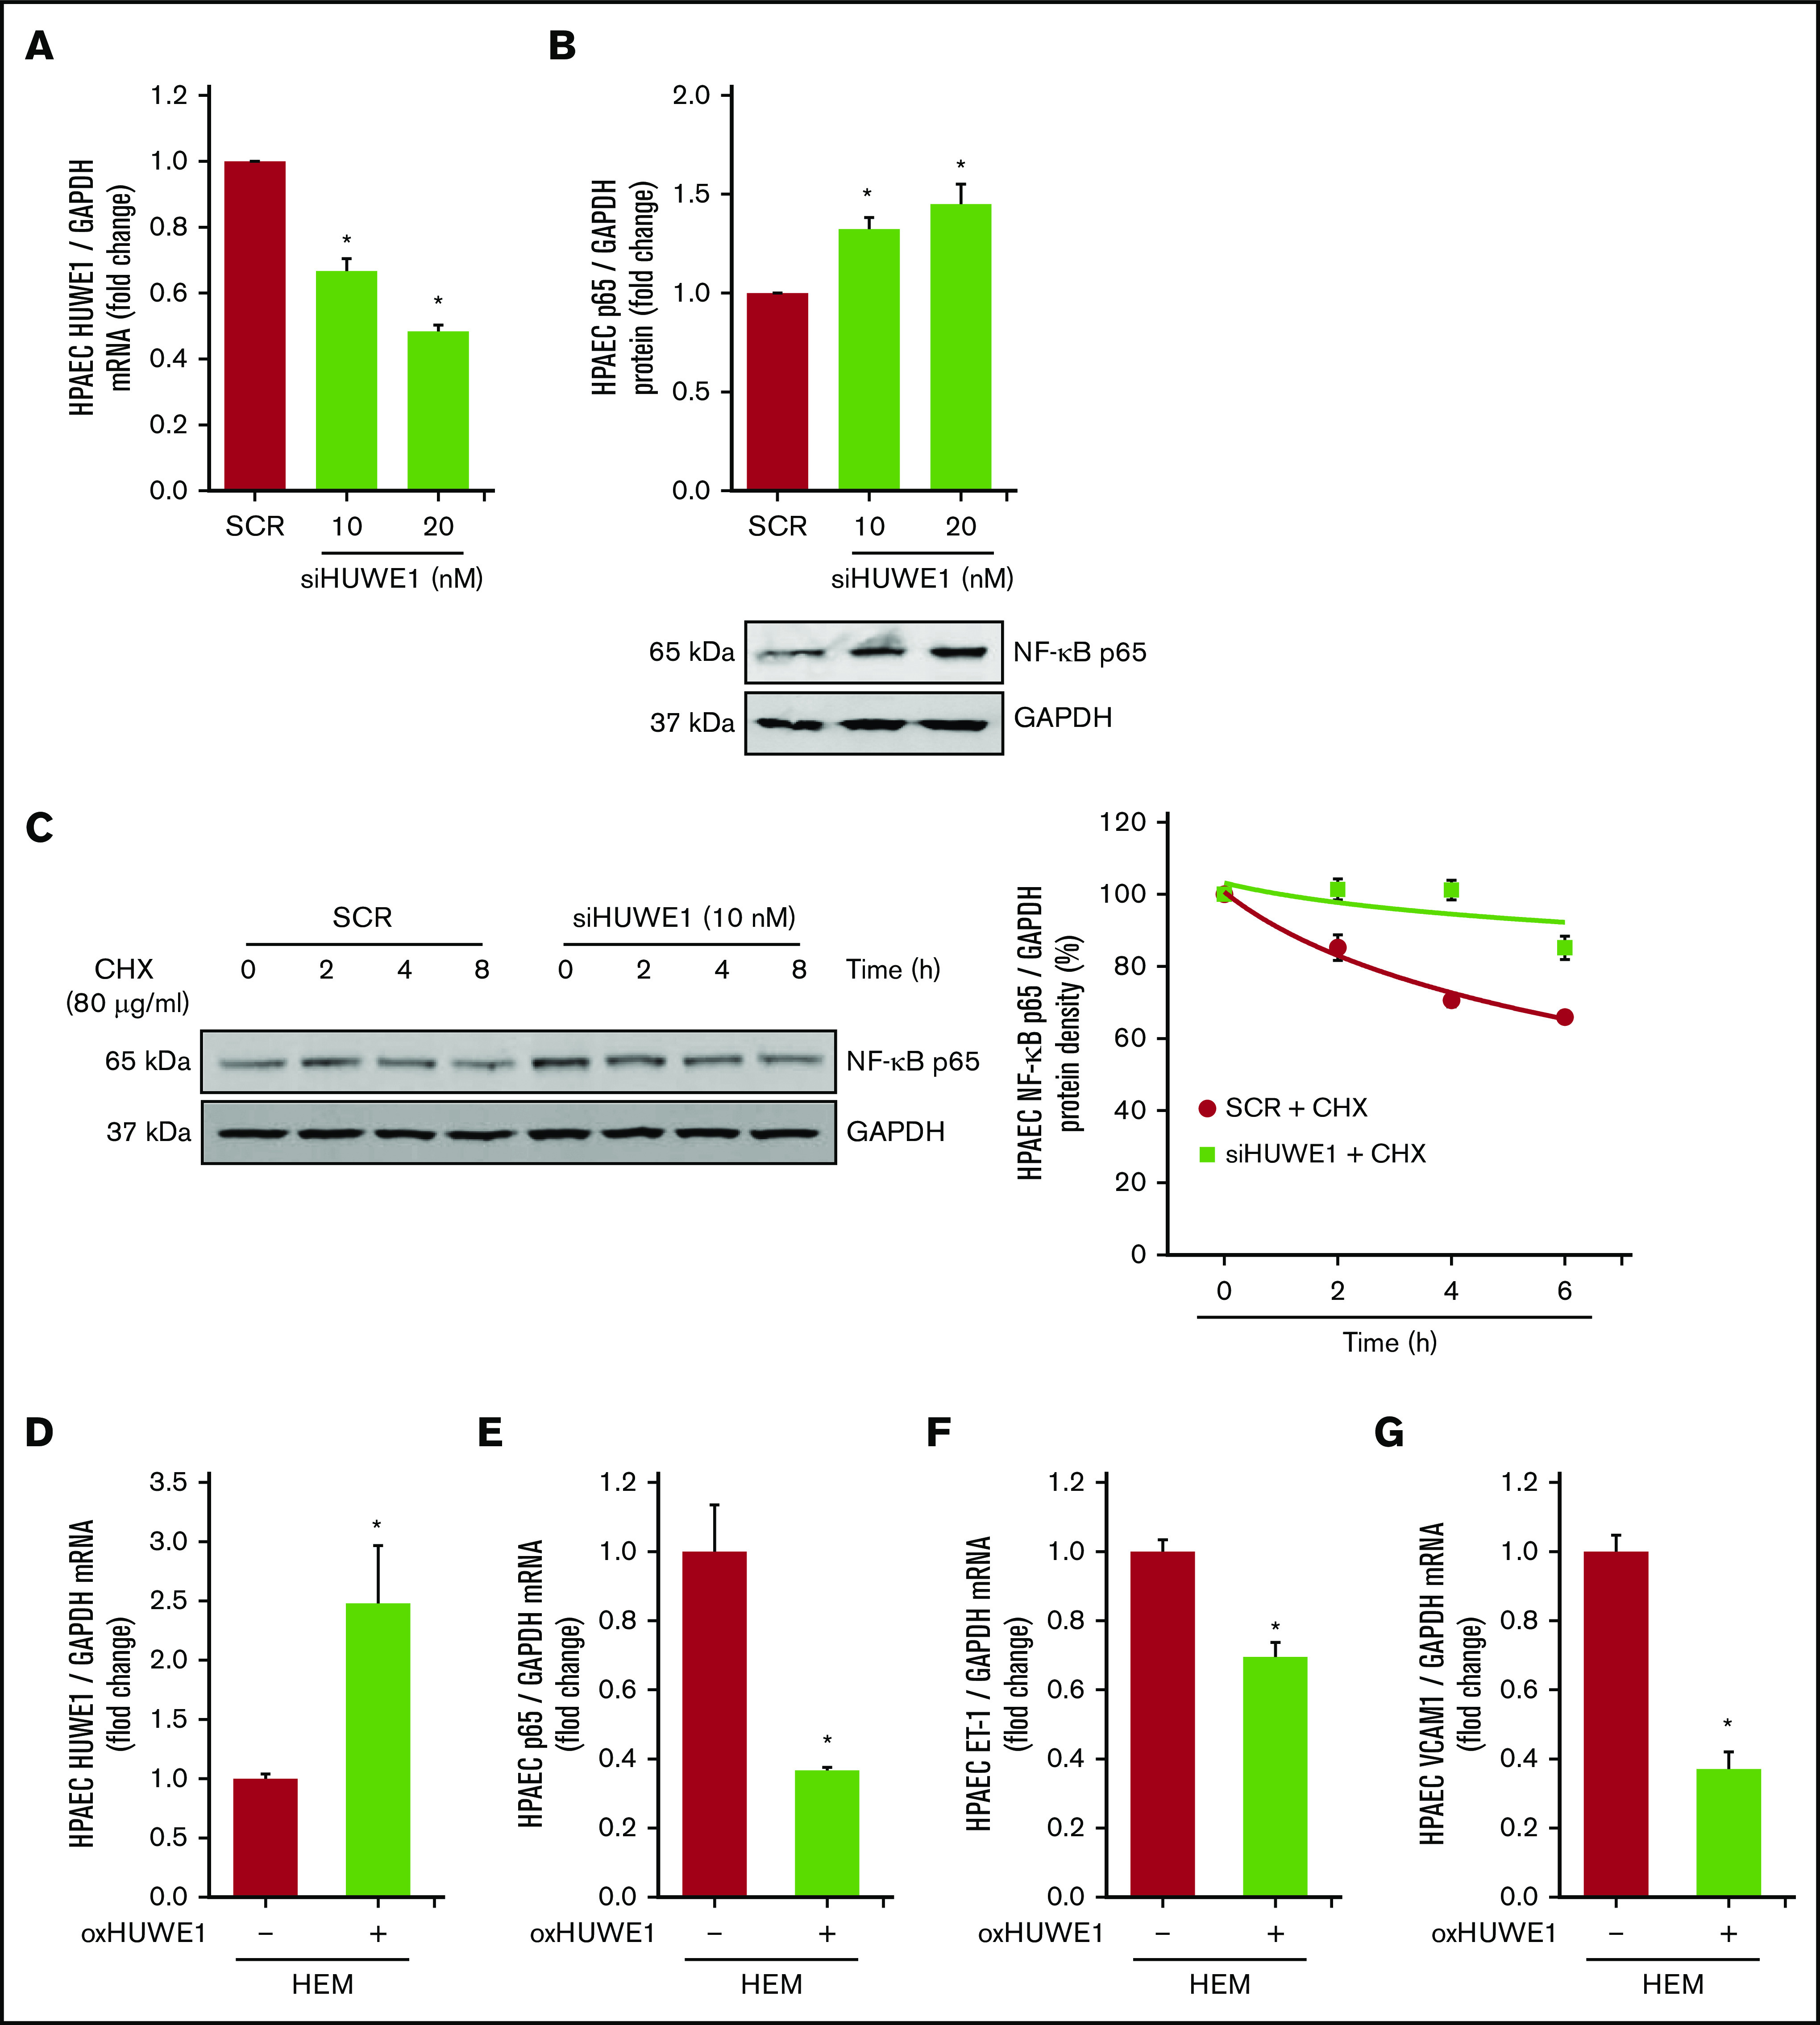
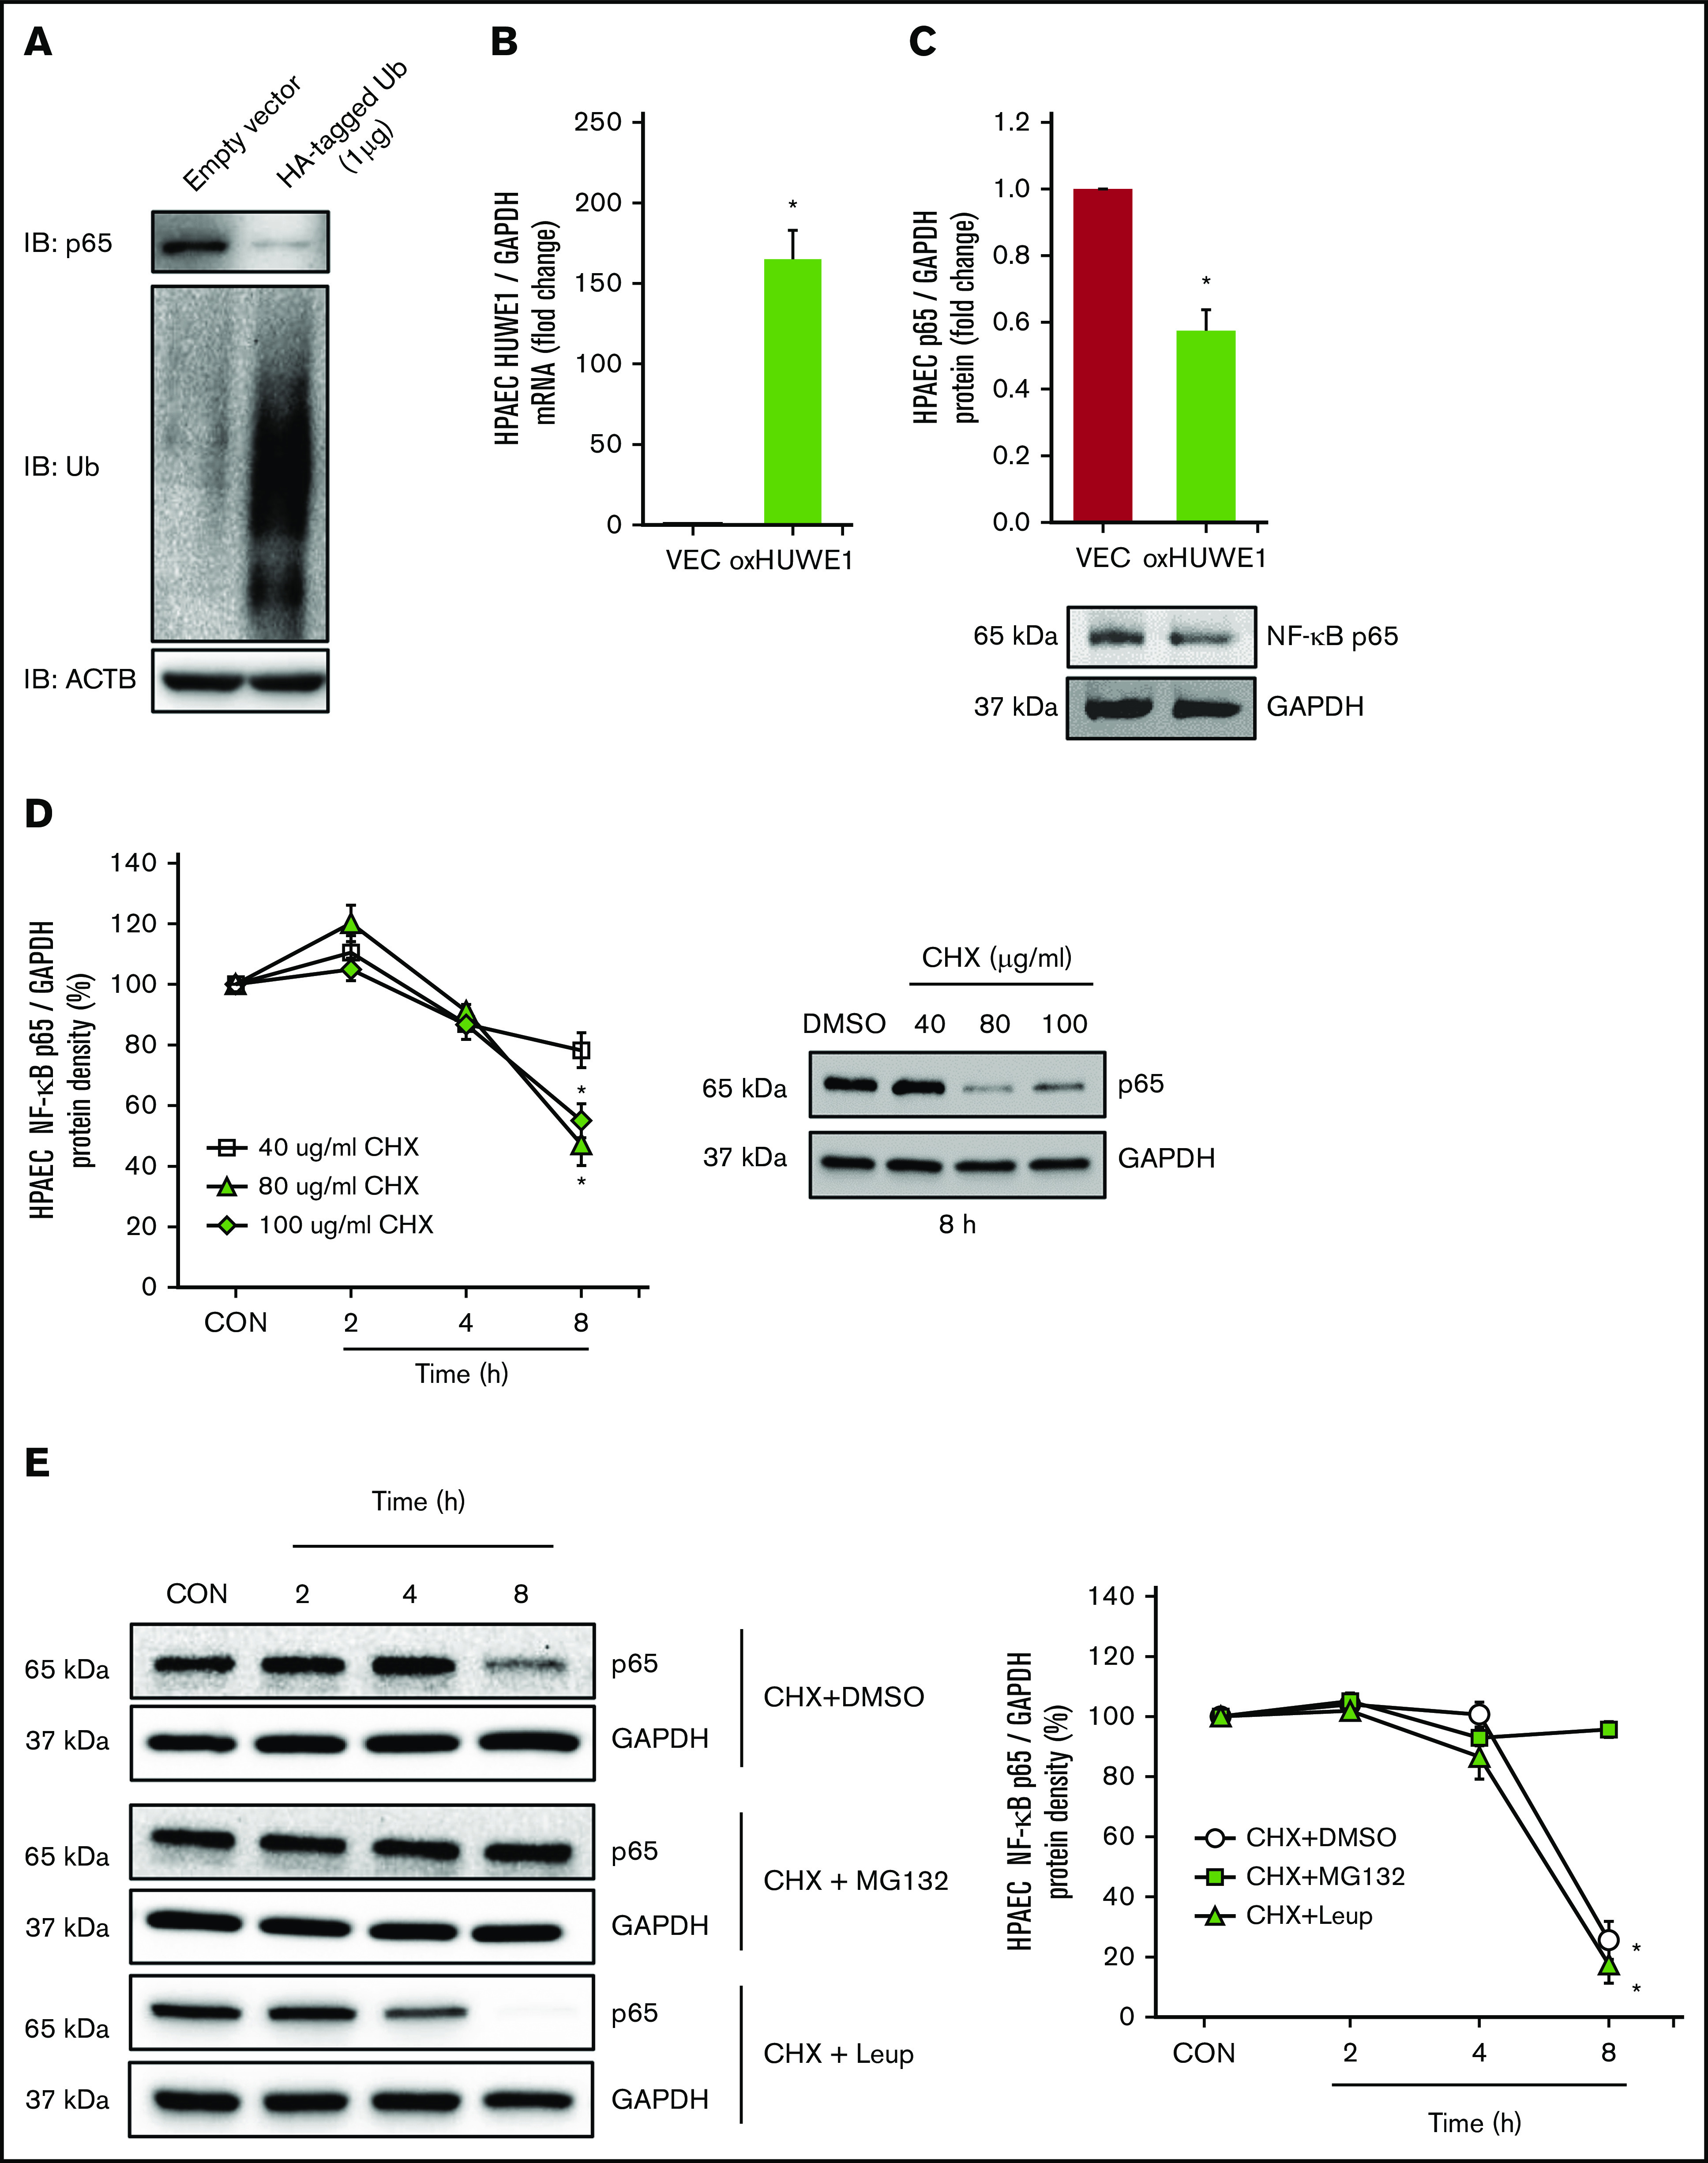
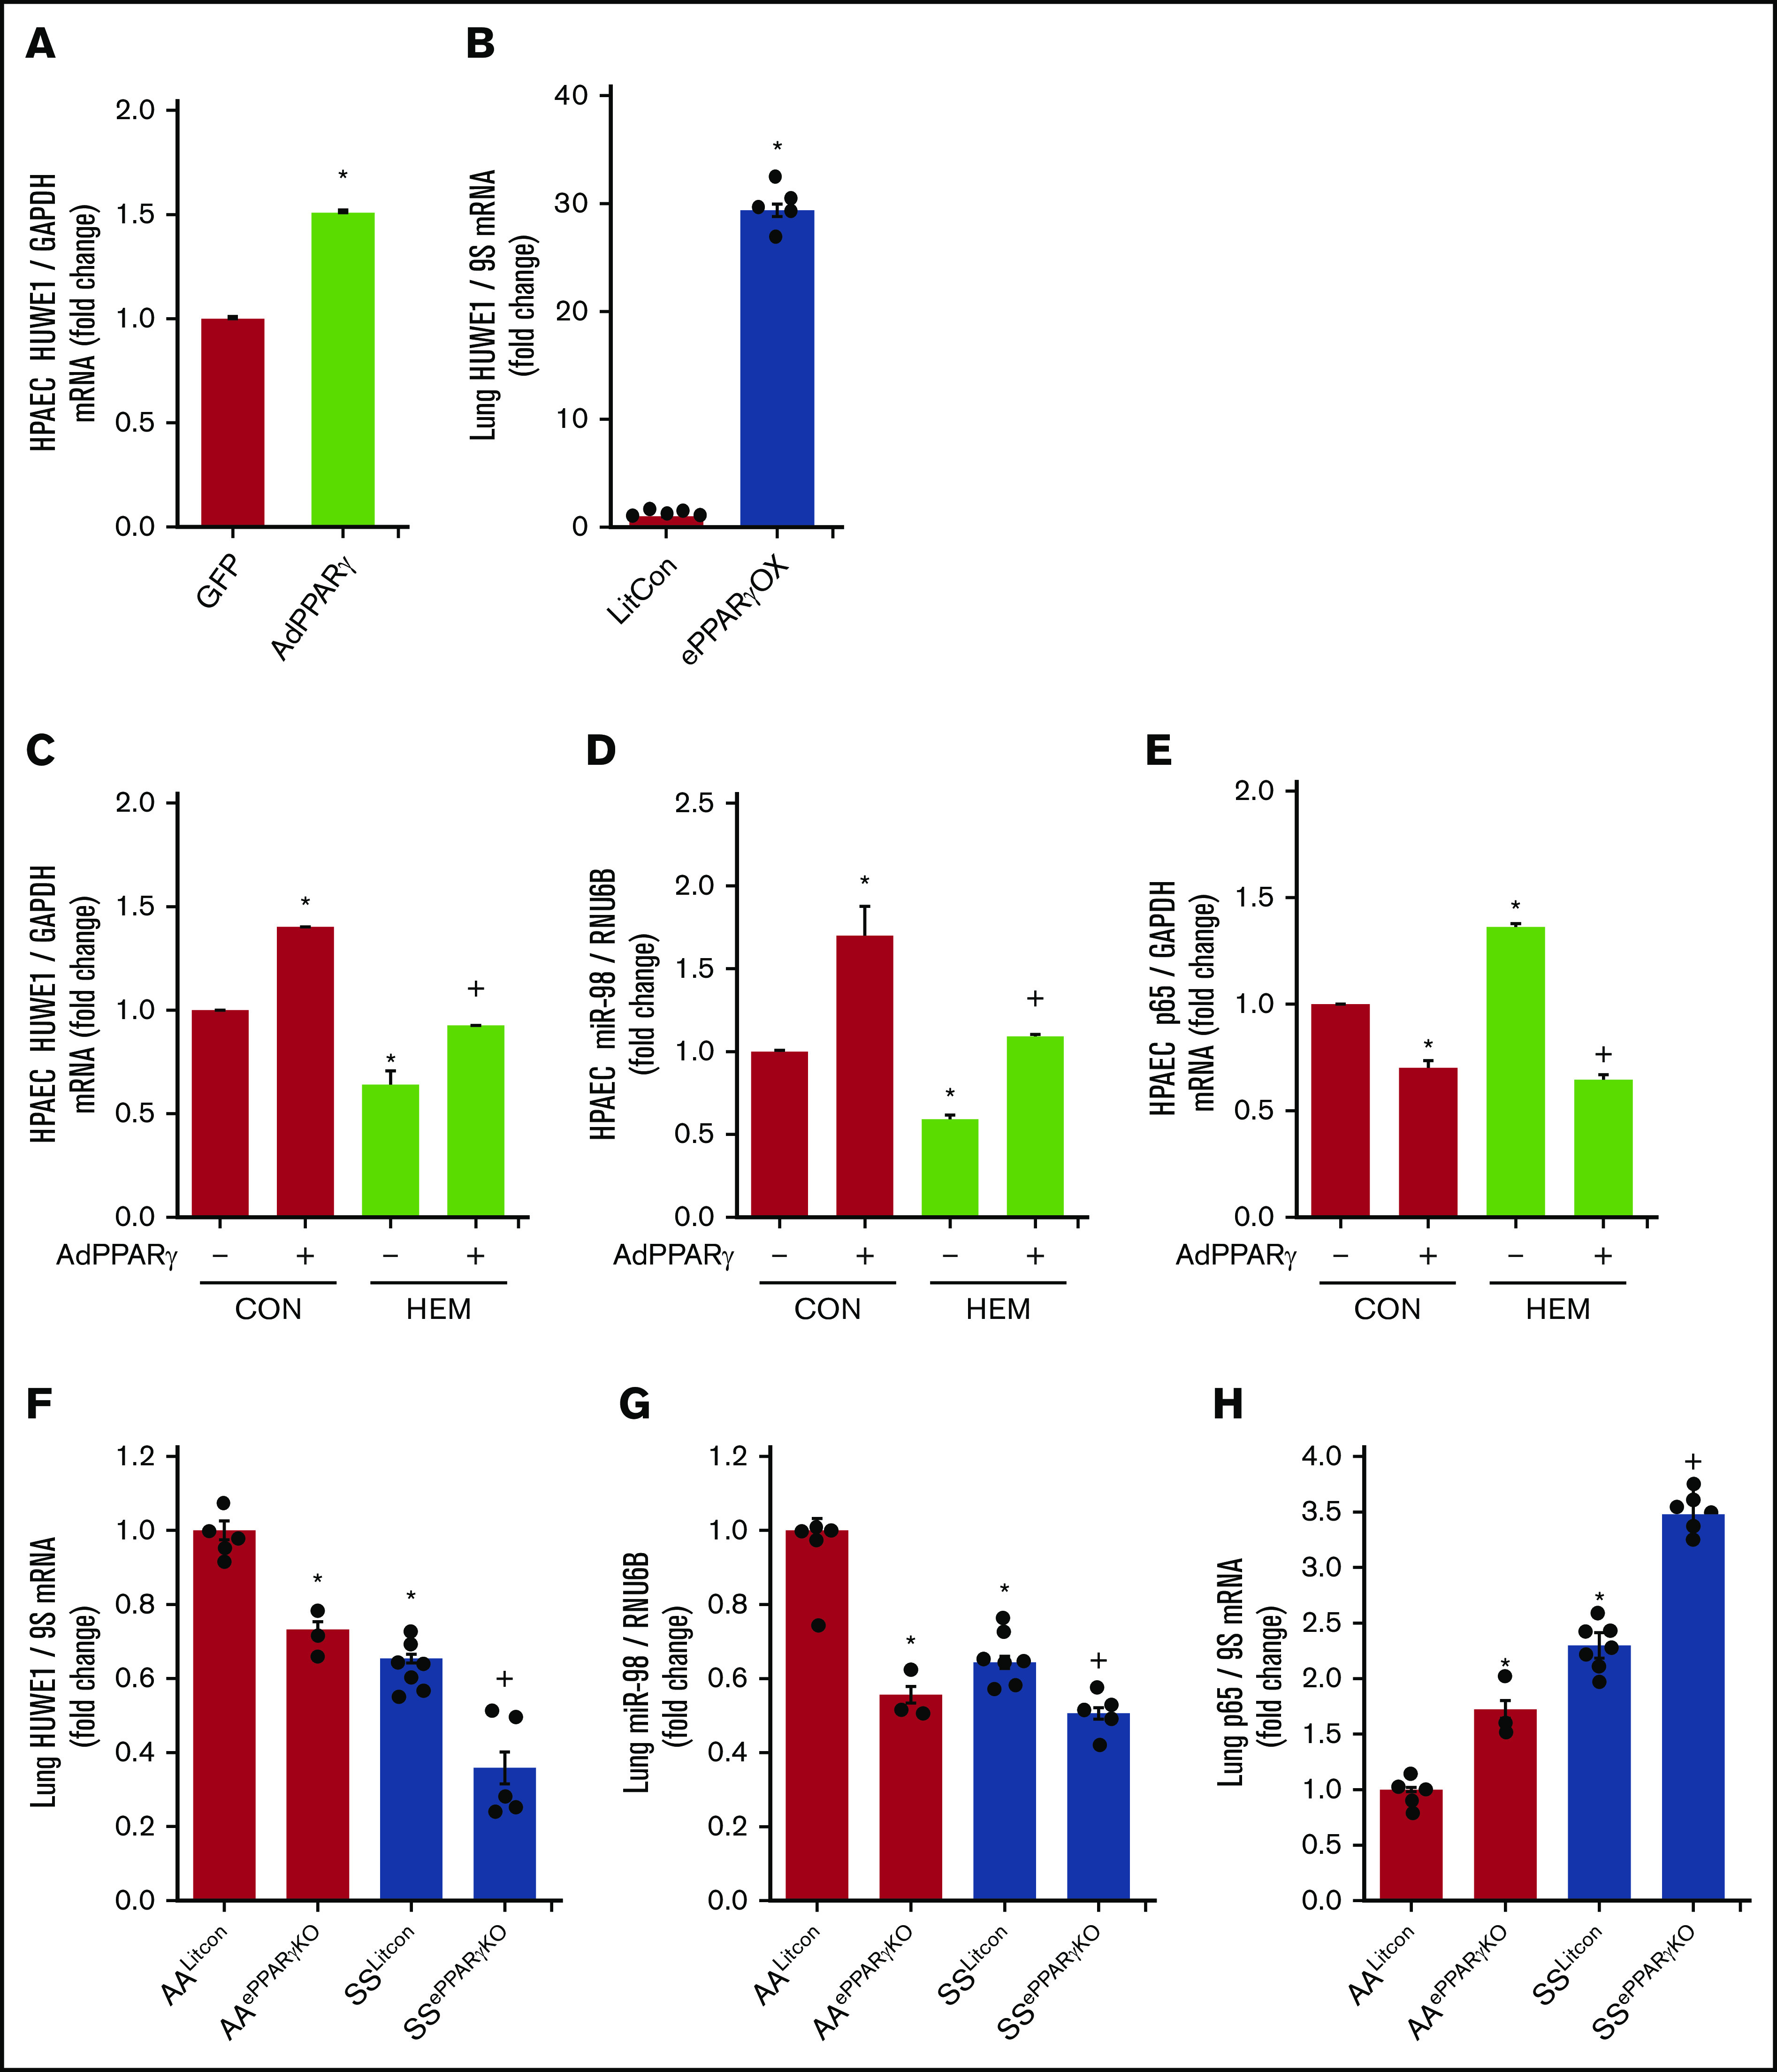
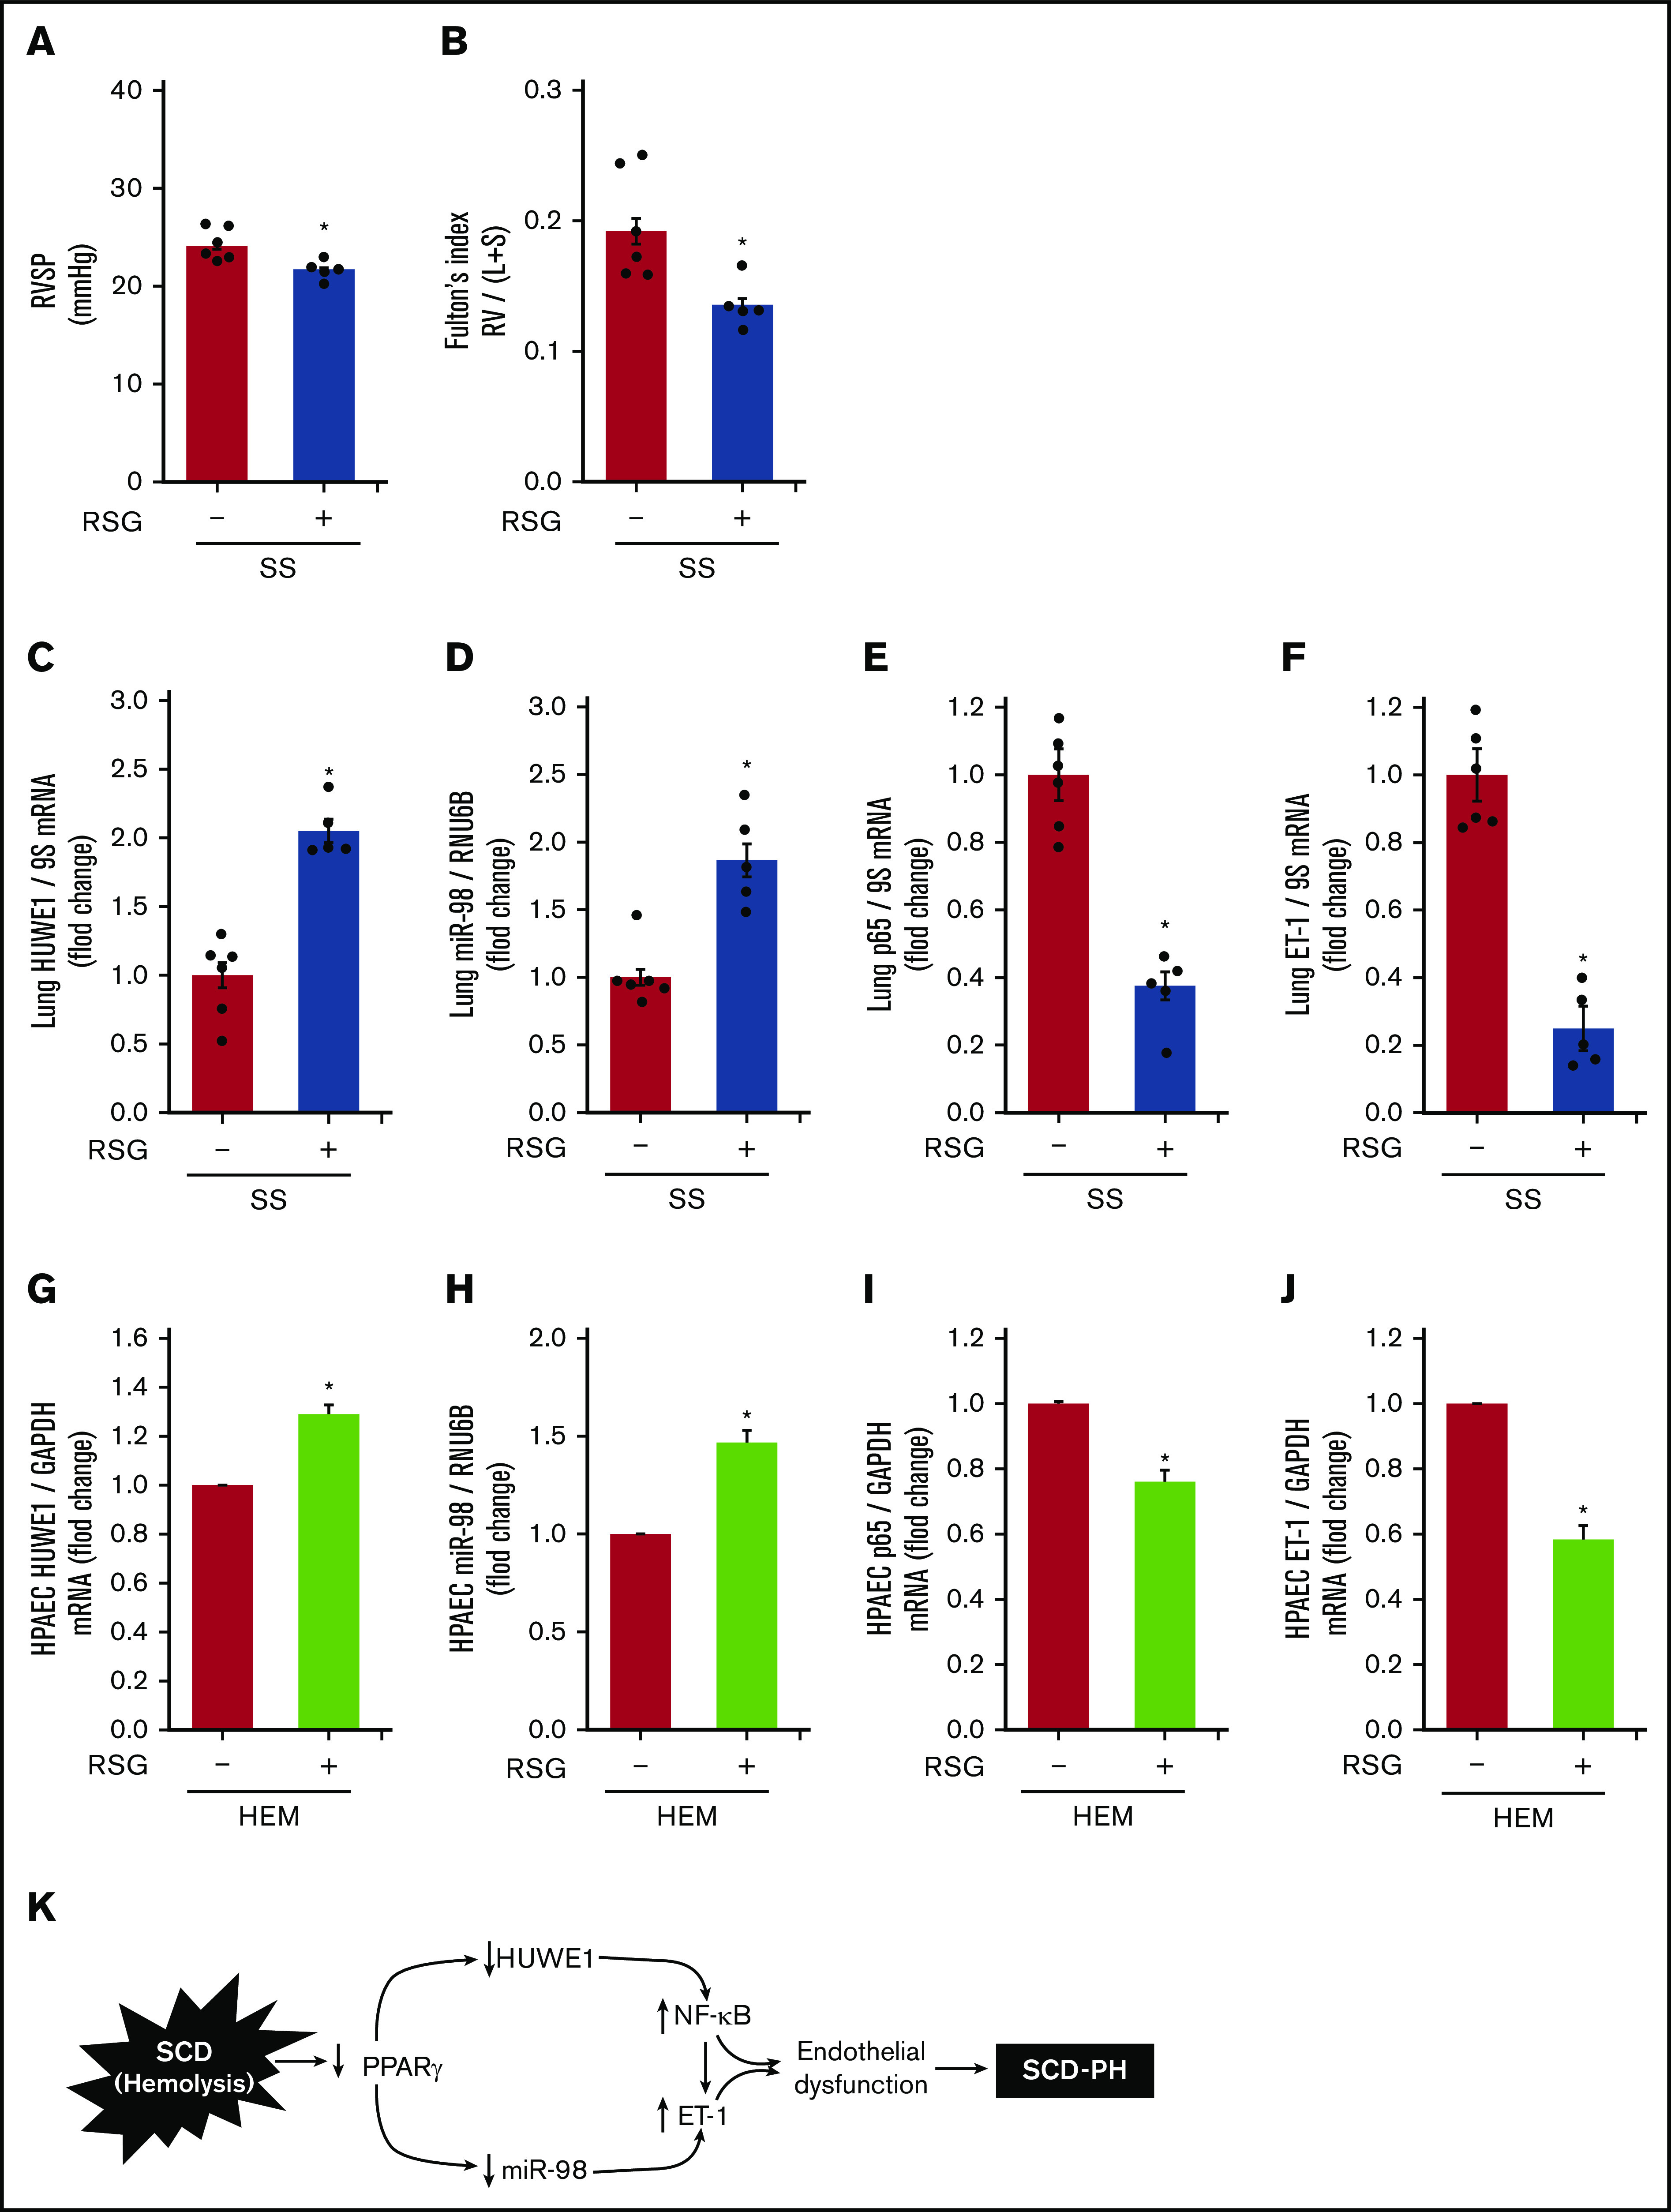
Sickle cell disease (SCD)-associated pulmonary hypertension (PH) causes significant morbidity and mortality. Here, we defined the role of endothelial specific peroxisome proliferator-activated receptor γ (PPARγ) function and novel PPARγ/HUWE1/miR-98 signaling pathways in the pathogenesis of SCD-PH. PH and right ventricular hypertrophy (RVH) were increased in chimeric Townes humanized sickle cell (SS) mice with endothelial-targeted PPARγ knockout (SSePPARγKO) compared with chimeric littermate control (SSLitCon). Lung levels of PPARγ, HUWE1, and miR-98 were reduced in SSePPARγKO mice compared with SSLitCon mice, whereas SSePPARγKO lungs were characterized by increased levels of p65, ET-1, and VCAM1. Collectively, these findings indicate that loss of endothelial PPARγ is sufficient to increase ET-1 and VCAM1 that contribute to endothelial dysfunction and SCD-PH pathogenesis. Levels of HUWE1 and miR-98 were decreased, and p65 levels were increased in the lungs of SS mice in vivo and in hemin-treated human pulmonary artery endothelial cells (HPAECs) in vitro. Although silencing of p65 does not regulate HUWE1 levels, the loss of HUWE1 increased p65 levels in HPAECs. Overexpression of PPARγ attenuated hemin-induced reductions of HUWE1 and miR-98 and increases in p65 and endothelial dysfunction. Similarly, PPARγ activation attenuated baseline PH and RVH and increased HUWE1 and miR-98 in SS lungs. In vitro, hemin treatment reduced PPARγ, HUWE1, and miR-98 levels and increased p65 expression, HPAEC monocyte adhesion, and proliferation. These derangements were attenuated by pharmacological PPARγ activation. Targeting these signaling pathways can favorably modulate a spectrum of pathobiological responses in SCD-PH pathogenesis, highlighting novel therapeutic targets in SCD pulmonary vascular dysfunction and PH.


Conflict of interest statement

Conflict-of-interest disclosure: The authors declare no competing financial interests.

Figures

None
Graphical abstract
Figure 1.
Figure 1.
Loss of PPARγ function exacerbates PH and RVH in endothelial-targeted SSePPARγKOchimeric mice. PPARγ levels are decreased, whereas ET-1 and VCAM1 levels are increased in SSePPARγKO mouse lungs. The chimeric SSePPARγKO mice were generated by transplanting SCD bone marrow from Townes mice using previously published methods- into ePPARγKO mice as reported., ePPARγKO mice were irradiated and transplanted with SS bone marrow. Six weeks after bone marrow transplant, following engraftment, the animals were studied. (A) RVSP was recorded in anesthetized mice with a pressure transducer. Each bar represents the mean RVSP in mm Hg ± SEM; n = 5 to 7. (B) The ratio of the weight of the RV to the LV + septum [RV: (LV + S)] is presented as an index of RVH; n = 5 to 7. (C-E) Whole lung homogenates were collected from littermate control (AALitCon and SSLitCon) and chimeric (AAePPARγKO and SSePPARγKO) mice. Real-time qPCR was performed on lung tissue. Lung PPARγ (C), ET-1 (D), or VCAM (E) levels are expressed relative to 9S normalized to CON values. Each bar represents the mean ± SEM. *P < .05 vs AALitCon; +P < .05 vs SSLitCon, n = 3 to 7.
Figure 2.
Figure 2.
HUWE1 and miR-98 levels are reduced in lungs of SS mice in vivo and in HEM-treated HPAECs in vitro. (A) Schematic illustration of intronic miR-98 on the host gene HUWE1 on chromosome X. (B-C) Whole lung homogenates were collected from littermate control (AA) and SS mice. Lung HUWE1 mRNA and protein (B) and miR-98 (C) levels were measured with real-time qPCR or western blotting and expressed relative to lung mRNA (9S mRNA), protein (GAPDH), and RNU6B (miRNA). *P < .05 vs AA, n = 5. (D-E) HPAECs were treated with DMSO vehicle (CON) or HEM (2.5, 5.0, and 10.0 µM) for 72 hours. Mean HPAEC HUWE1 mRNA and protein (D) and miR-98 (E) levels were measured with real-time qPCR or western blotting. (F-G) HPAECs were treated with DMSO vehicle (CON) or HEM (5 µM) for 24, 48, and 72 hours. Mean HPAEC HUWE1 mRNA and protein (F) and miR-98 (G) levels were measured with real-time qPCR or western blotting. Each bar represents the mean HUWE1 and miR-98 level ± SEM relative to GAPDH or RNU6B expressed as fold change vs CON. *P < .05 vs CON, n = 6.
Figure 3.
Figure 3.
NF-κB/p65 levels are increased and HUWE1 levels are reduced in lungs of SS mice in vivo and in HEM-treated HPAECs in vitro. (A) Whole lung homogenates were collected from littermate control (AA) and SS mice. Lung NF-κB/p65 mRNA or protein levels were measured with real-time qPCR or western blotting and expressed relative to lung mRNA (9S mRNA) or protein (GAPDH). *P < .05 vs AA, n = 4 to 5. (B-C) HPAECs were treated with DMSO vehicle (CON) or HEM (2.5, 5.0, and 10.0 µM) for 72 hours. (D-E) HPAECs were treated with DMSO vehicle (CON) or HEM (5 µM) for 24, 48, and 72 hours. Mean HPAEC NF-κB/p65 mRNA or protein (B) and ET-1 mRNA (C) levels were measured with real-time qPCR or western blotting. Each bar represents the mean NF-κB/p65 or ET-1 level ± SEM relative to GAPDH expressed as fold change vs CON. *P < .05 vs CON, n = 6. (D-E) HPAECs were treated with DMSO vehicle (CON) or HEM (5 µM) for 24, 48, and 72 hours. Mean HPAEC p65 mRNA and protein (D) and ET-1 (E) protein levels were measured with real-time qPCR or western blotting. Each bar represents the mean p65 or ET-1 level ± SEM relative to GAPDH expressed as fold change vs CON. *P < .05 vs CON, n = 6.
Figure 4.
Figure 4.
HUWE1, E3 ligase induces the degradation of NF-κB/p65. (A-B) HPAECs were treated with scrambled (SCR) or HUWE1 (10 or 20 nM) siRNAs for 6 hours and then incubated for an additional 72 hours. Real-time qPCR or western blotting was performed for HUWE1 mRNA (A) or p65 protein (B). Each bar represents mean ± SEM HUWE1 or p65 level relative to GAPDH expressed as fold change vs cells treated with scrambled siRNA (SCR). *P < .05 vs SCR, n = 4 to 6. (C) HPAECs were transfected with scrambled siRNA or HUWE1 siRNA for 72 hours and were treated with CHX (40 µg/mL) for 0, 2, 4, and 8 hours to inhibit de novo protein synthesis and harvested for western blotting. The levels of p65 at time 0 was set as 100% and the percent p65 protein remaining following CHX treatment at each time point was calculated accordingly. (D-F) HPAECs were transfected with either the CON plasmid (VEC or HEM/oxHUWE1[−]) or HUWE1 (1 μg, oxHUWE1 or HEM/oxHUWE1[+]) plasmid for 6 hours and then treated with DMSO vehicle (CON) or HEM (5 µM) for 72 hours. Mean HPAEC HUWE1 (D), p65 (E), ET-1 (F), and VCAM1 (G) mRNA levels were measured with real-time qPCR or western blotting. Each bar represents the mean mRNA level ± SEM relative to GAPDH expressed as fold change vs CON. *P < .05 vs VEC or HEM/oxHUWE1−, n = 6.
Figure 5.
Figure 5.
NF-κB/p65 is degraded by ubiquitination. (A) HPAECs were transfected with either the CON plasmid (empty VEC) or HA-ubiquitin (HA-Ubi; 1 µg) plasmid for 24 hours. HPAECs were collected and assayed for HA, p65, and β-actin (loading CON, ACTB) by immunoblotting. (B-C) HPAECs were transfected with either the CON plasmid (VEC) or HUWE1 (1 μg, oxHUWE1) plasmid for 6 hours; Media were replaced with EGM containing 5% FBS and then incubated for an additional 72 hours. (D) CHX treatment was carried out at a concentration of 40 to 100 μg/mL at varying time points (0-8 hours) in 0% FBS medium. (E) HPAECs were pretreated with DMSO or MG132, and leupeptin (Leup) for 2 hours and treated with CHX (40 µg/mL) for 0, 2, 4, and 8 hours to inhibit de novo protein synthesis and harvested for western blotting. The levels of p65 at time 0 was set as 100%, and the percent p65 protein remaining following CHX treatment at each time point was calculated accordingly. ACTB, actin beta.
Figure 6.
Figure 6.
PPARγ activates HUWE1 expression and decreases p65 levels. (A,C-E) HPAECs were transfected with green fluorescent protein (GFP) or AdPPARγ (25 multiplicity of infection) constructs for PPARγ overexpression. After 6 hours, HPAECs were then incubated for an additional 72 hours with DMSO vehicle (CON) or HEM (5 µM). Real-time qPCR was performed for HUWE1 (A,C), miR-98 (D), or p65 (E). Each bar represents mean ± SEM HUWE1, miR-98, or p65 level relative to GAPDH or RNU6B expressed as fold change vs cells treated with GFP. *P < .05 vs GFP or CON/AdPPARγ(−); +P < .05 vs HEM/AdPPARγ(−), n = 5 to 6. (B) Whole lungs were collected from littermate control (FulCon) or endothelial-targeted PPARγ overexpression (ePPARγOX) mice. Levels of lung HUWE1 were measured with real-time qPCR and expressed relative to lung GPADH mRNA. *P < .05 vs FulCon, n = 6. (F-H) The chimeric SSePPARγKO mice were generated by transplanting SCD bone marrow from Townes mice using methods we previously published- into ePPARγKO mice as we have reported., ePPARγKO mice were irradiated and transplanted with SS bone marrow. Whole lung homogenates were collected from littermate control (AALitCon and SSLitCon) and chimeric (AAePPARγKO and SSePPARγKO) mice. Real-time qPCR was performed on lung tissue. Lung HUWE1 (F), miR-98 (G), or p65 (H) levels are expressed relative to 9S or RNU6B normalized to CON values. Each bar represents the mean ± SEM. *P < .05 vs AALitCon; +P < .05 vs + SSLitCon, n = 3 to 7.
Figure 7.
Figure 7.
The PPARγ ligand, RSG, attenuates decreases in HUWE1 and miR-98 levels and increases in p65 and ET-1 levels in SS mouse lung and in HEM-treated HPAECs. (A) RVSP was recorded in anesthetized mice with a pressure transducer. Each bar represents the mean RVSP in mm Hg ± SEM; n = 5 to 6. (B) The ratio of the weight of the RV to the LV + septum [RV: (LV + S)] is presented as an index of RVH. n = 5 to 6. (C-F) Whole lung homogenates were collected from (AA) and SS mice following gavage with RSG (10 mg/kg per day) or vehicle for 10 days. Real-time qPCR was performed on lung tissue. Lung HUWE1 (C), miR-98 (D), p65 (E), or ET-1 (F) levels are expressed relative to GAPDH or RNU6B and normalized to CON values. Each bar represents the mean ± SEM. *P < .05 vs AA; +P < .05 vs SS, n = 5 to 6. (G-J) HPAECs were treated with HEM (5 µM) for 72 hours. During the final 24 hours of HEM exposure, selected HPAECs were treated ± RSG (10 μM). Real-time qPCR was performed for HUWE1 (G), miR-98 (H), p65 (I), or ET-1 (J) levels. Each bar represents the mean ± SEM relative to RNU6B or GAPDH as indicated. *P < .05 vs HEM/RSG(−), n = 3 to 6. (K) Hypothetical schema defining the role of PPARγ/HUWE1/miR-98 signaling in SCD-PH pathogenesis. Hemolysis induces reductions in PPARγ that decrease miR-98 and HUWE1 levels. Reductions in miR-98 stimulate ET-1 and reductions in HUWE1 increase NF-κB, adhesion molecule expression, and endothelial dysfunction promoting SCD-PH pathogenesis.

References

    1. Ingram VM. A specific chemical difference between the globins of normal human and sickle-cell anaemia haemoglobin. Nature. 1956;178(4537):792-794. - PubMed
    1. Ingram VM. Gene mutations in human haemoglobin: the chemical difference between normal and sickle cell haemoglobin. Nature. 1957;180(4581):326-328. - PubMed
    1. Kavanagh PL, Sprinz PG, Vinci SR, Bauchner H, Wang CJ. Management of children with sickle cell disease: a comprehensive review of the literature. Pediatrics. 2011;128(6):e1552-e1574. - PubMed
    1. Hassell KL. Population estimates of sickle cell disease in the U.S. Am J Prev Med. 2010;38(4suppl):S512-S521. - PubMed
    1. Castro O, Hoque M, Brown BD. Pulmonary hypertension in sickle cell disease: cardiac catheterization results and survival. Blood. 2003;101(4):1257-1261. - PubMed

Publication types