. 2021 Jan 26;5(2):459-474.
doi: 10.1182/bloodadvances.2020002833.

Rapid removal of phagosomal ferroportin in macrophages contributes to nutritional immunity

Rapid removal of phagosomal ferroportin in macrophages contributes to nutritional immunity

Ronald S Flannagan et al. Blood Adv. .

Abstract

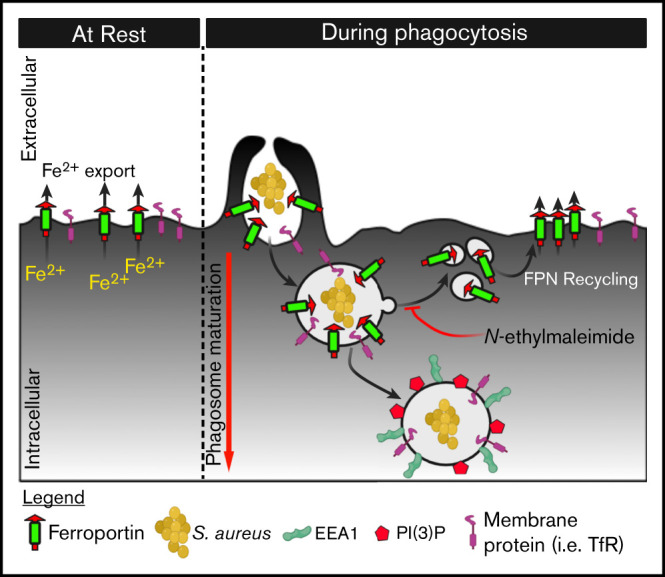
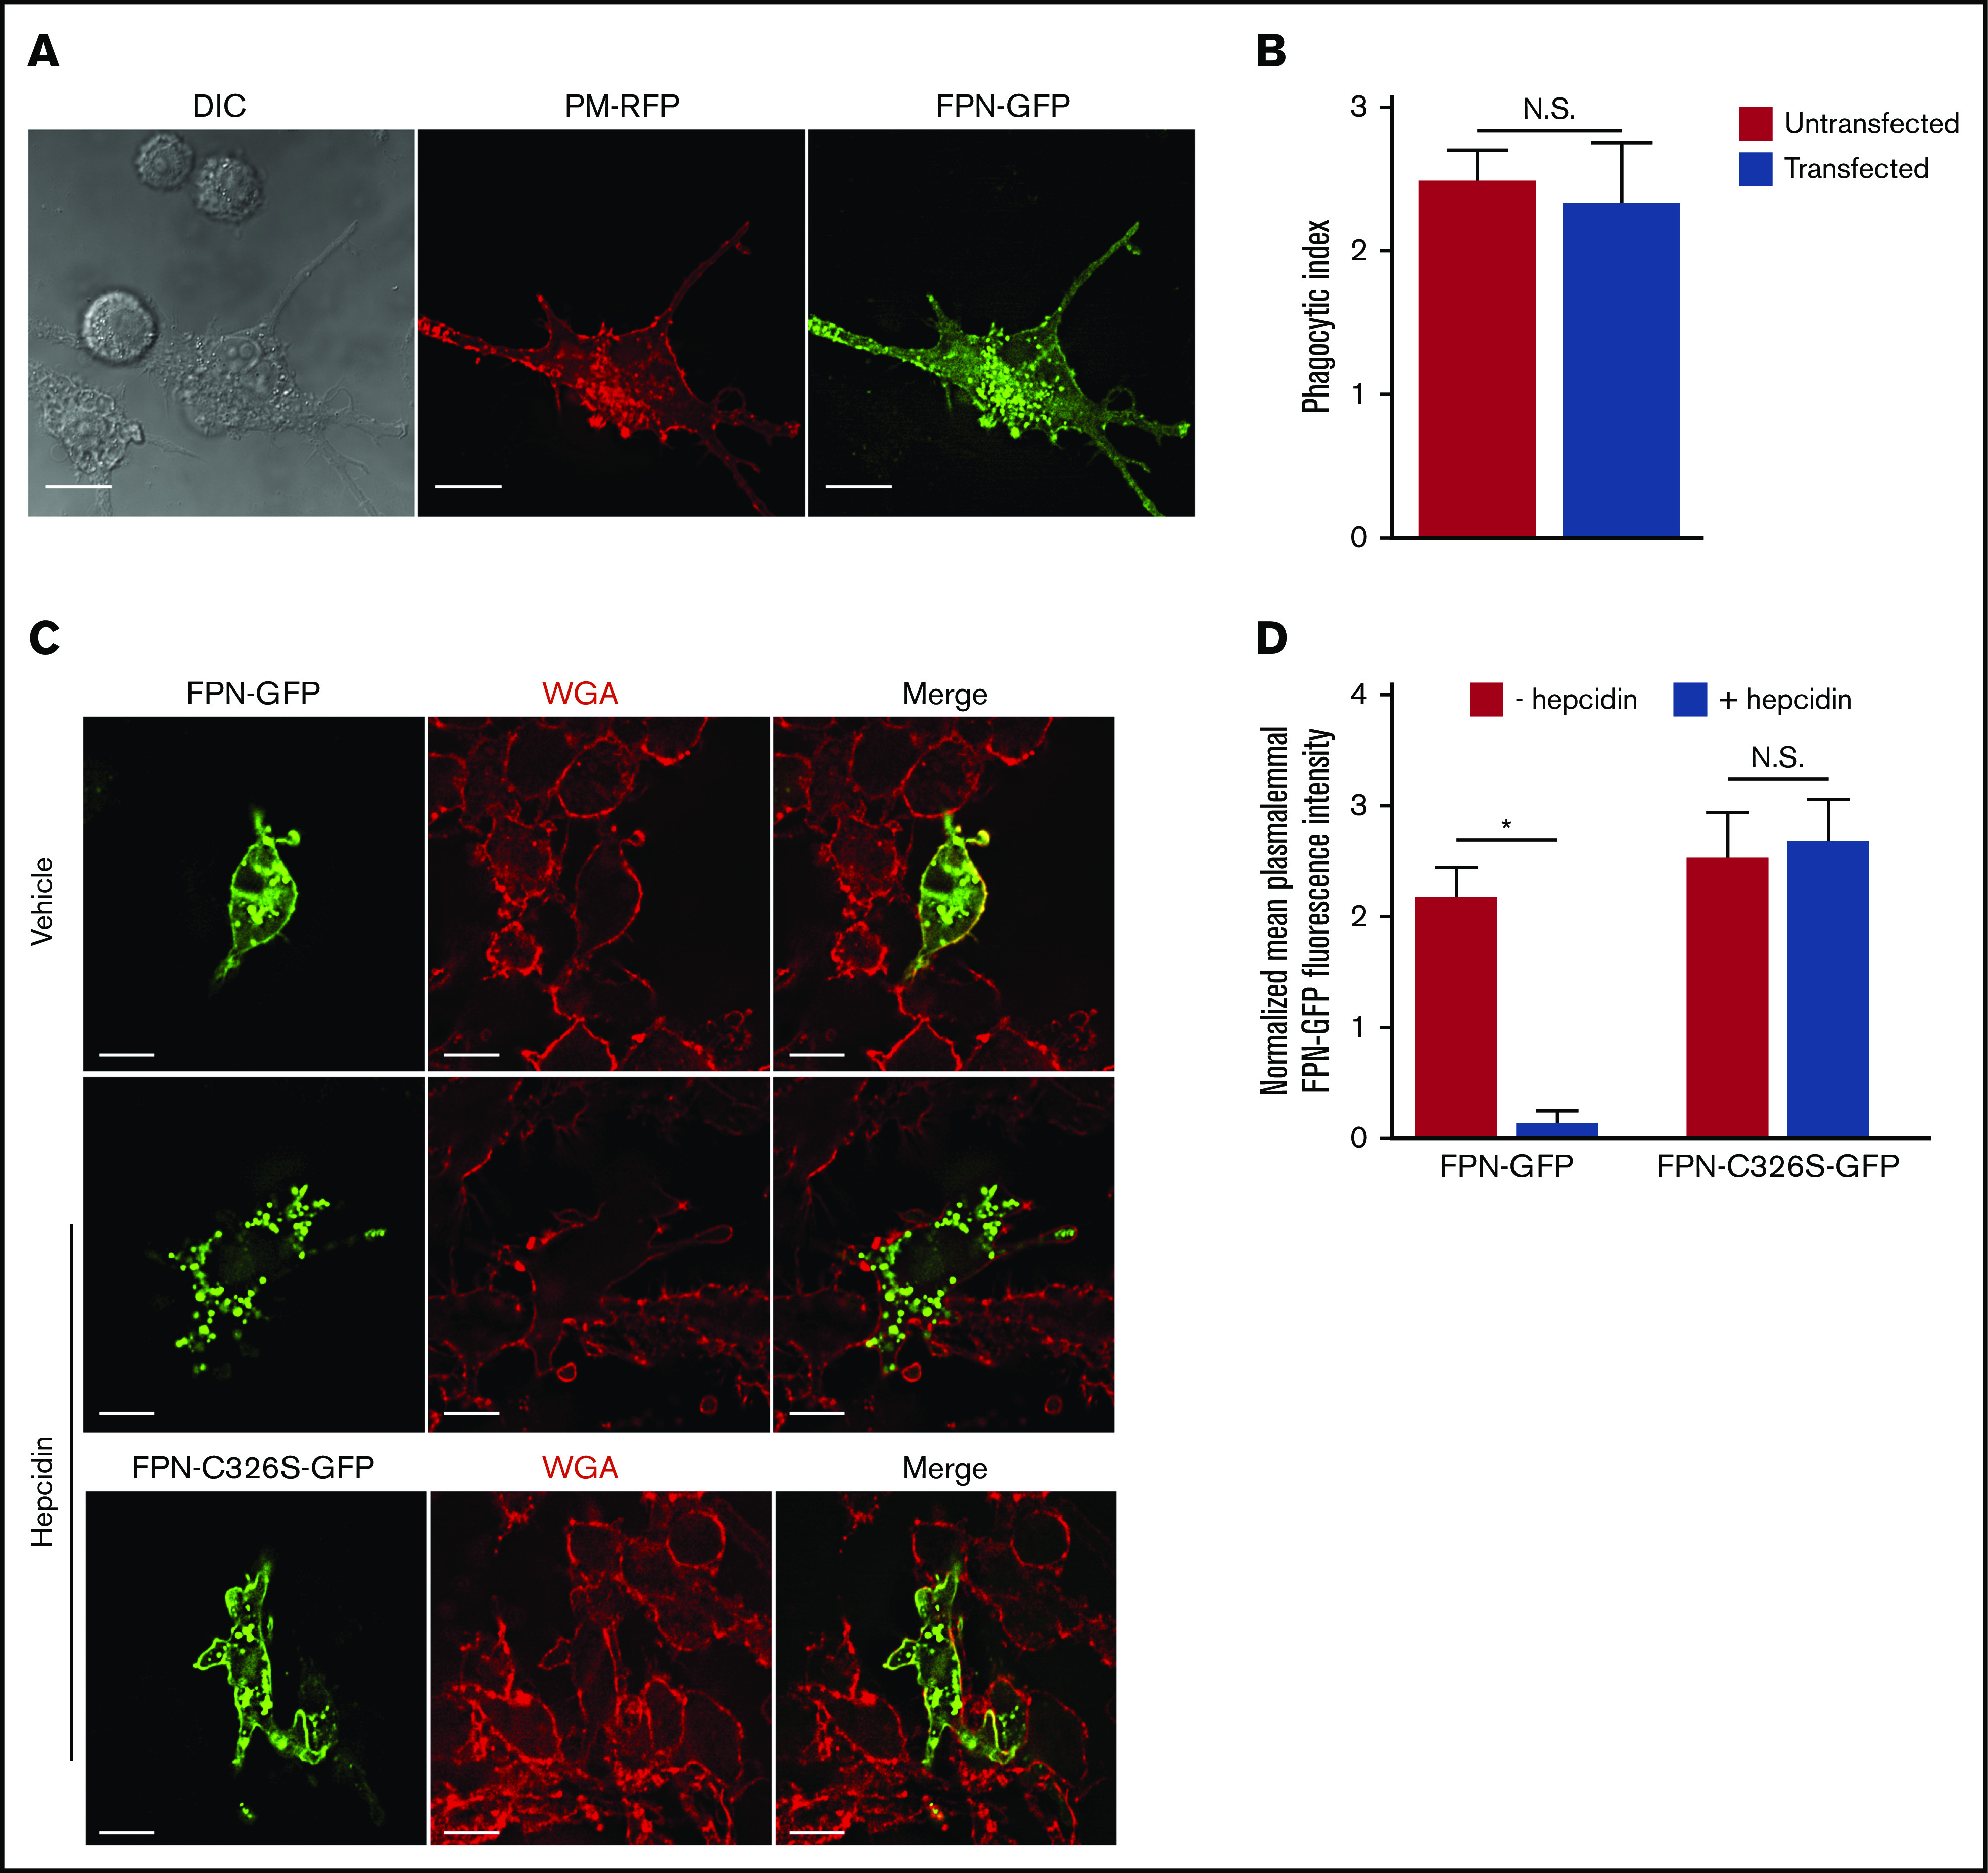
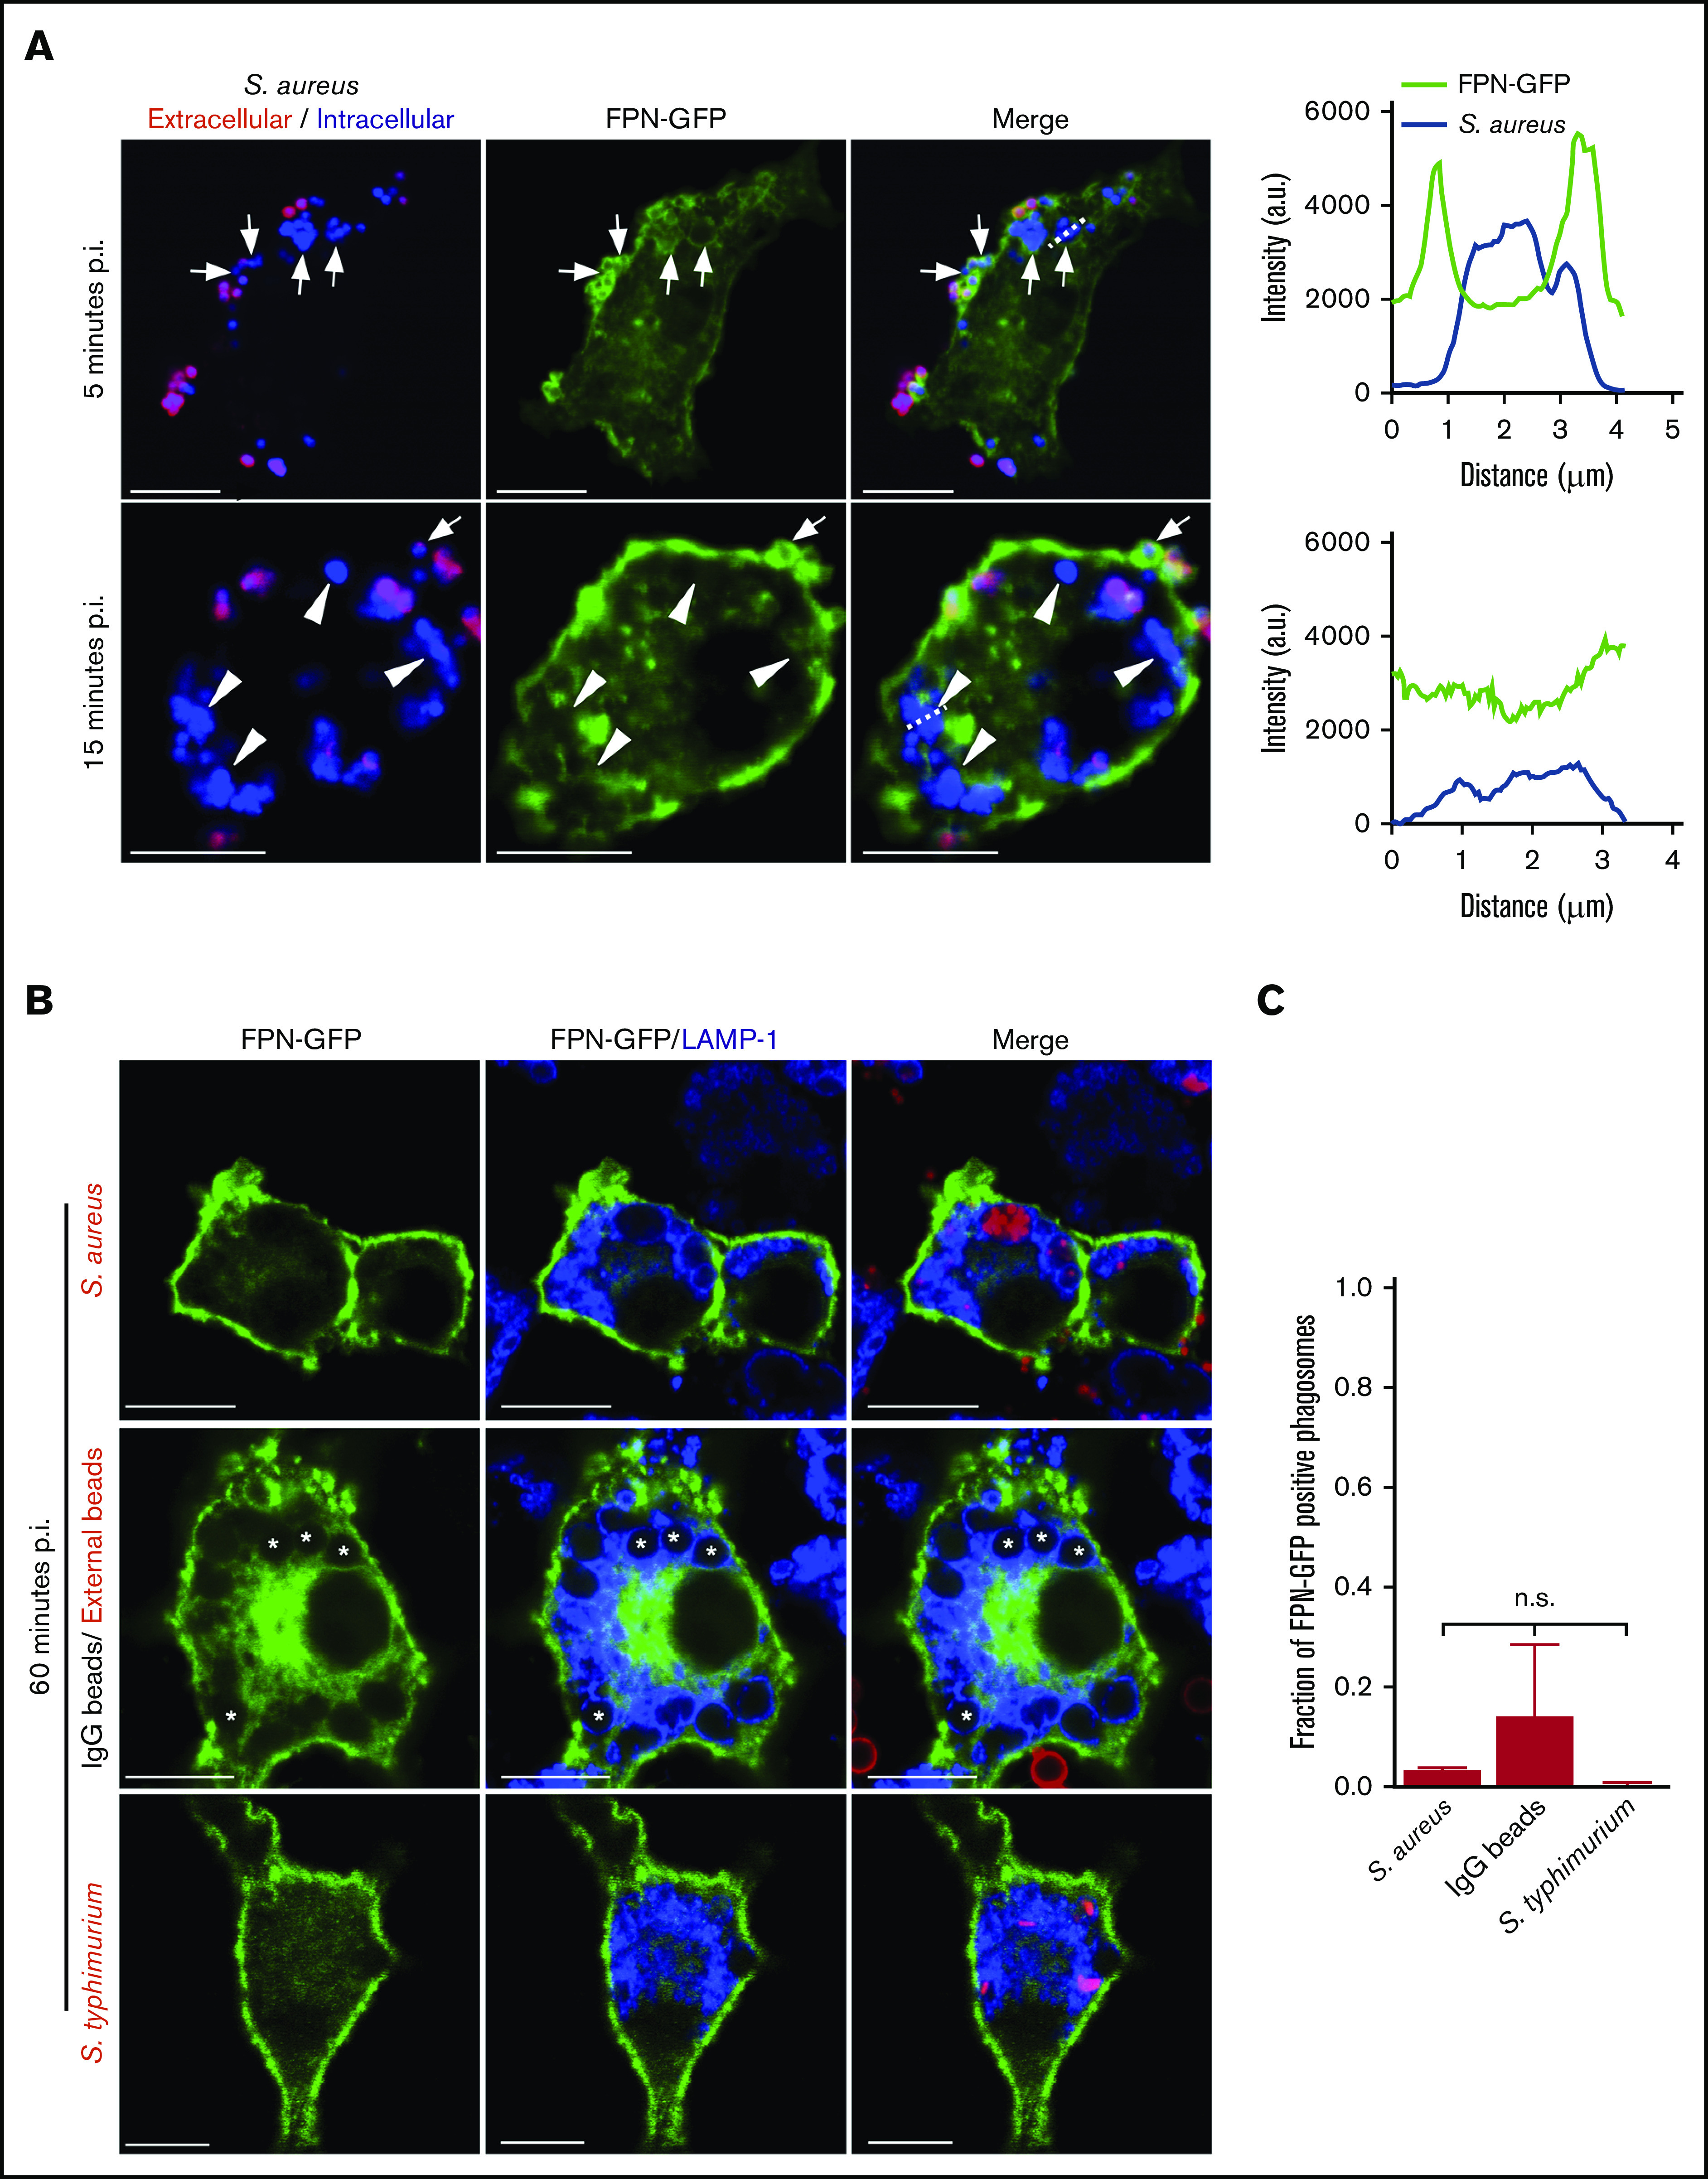
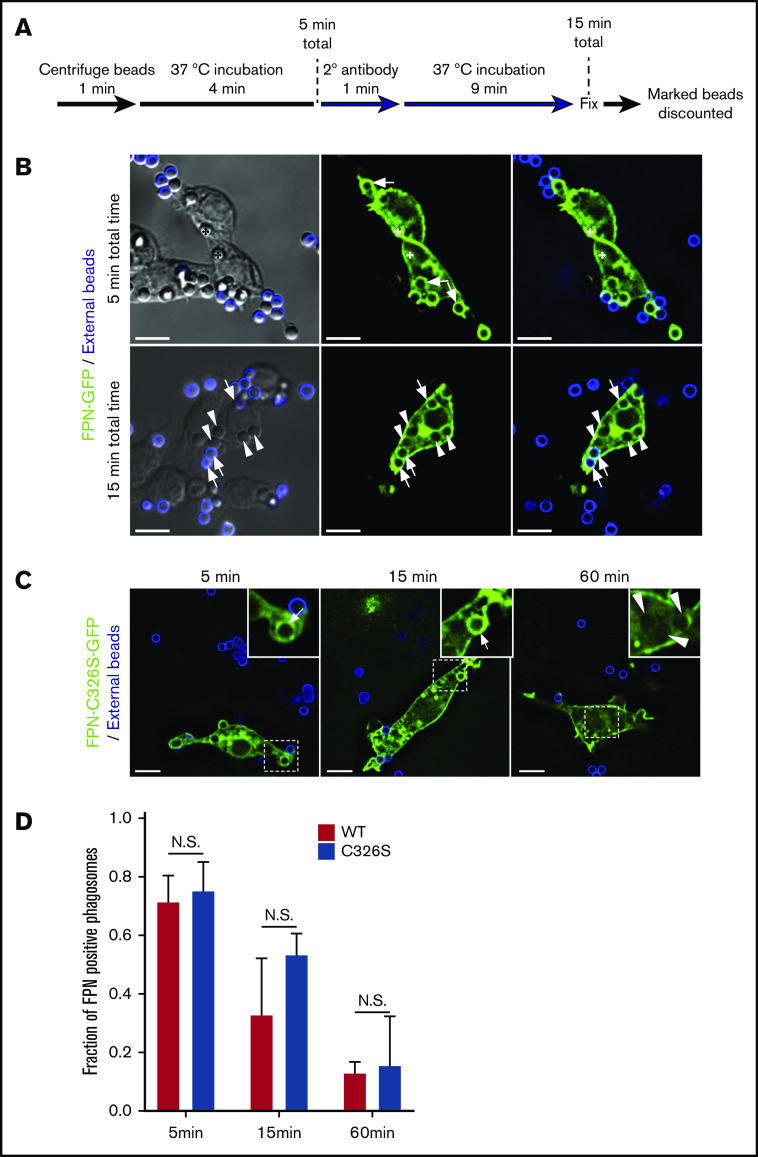
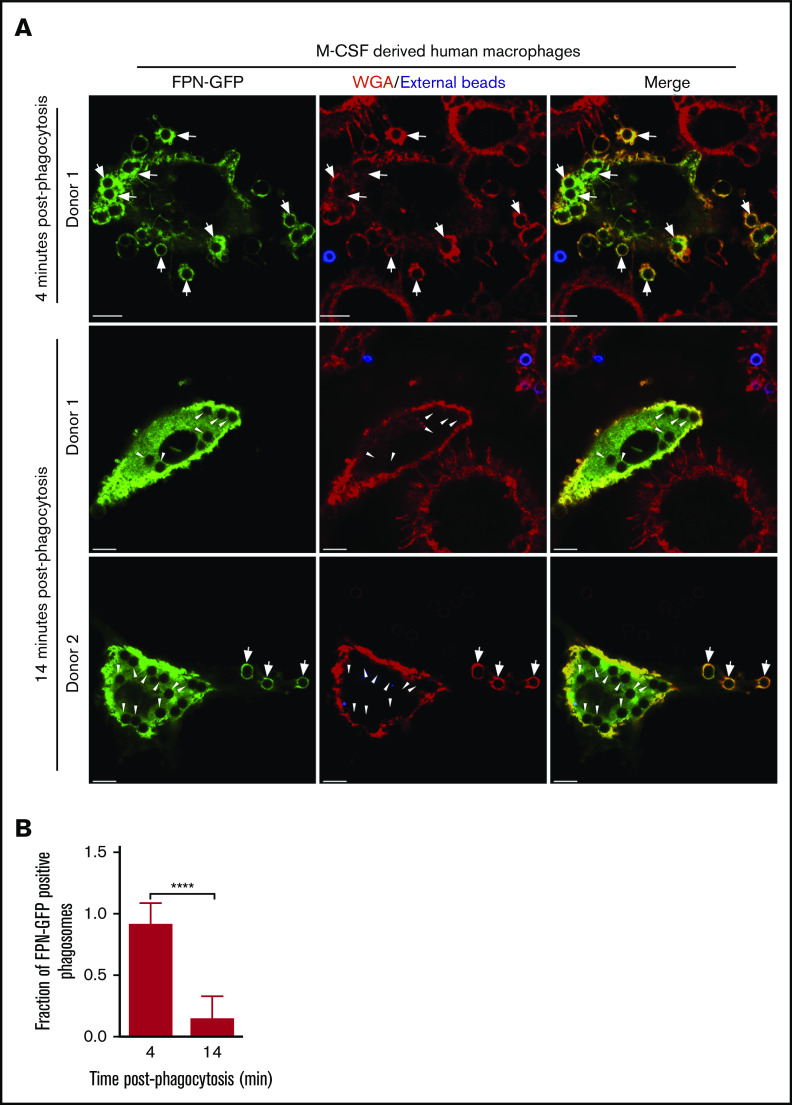
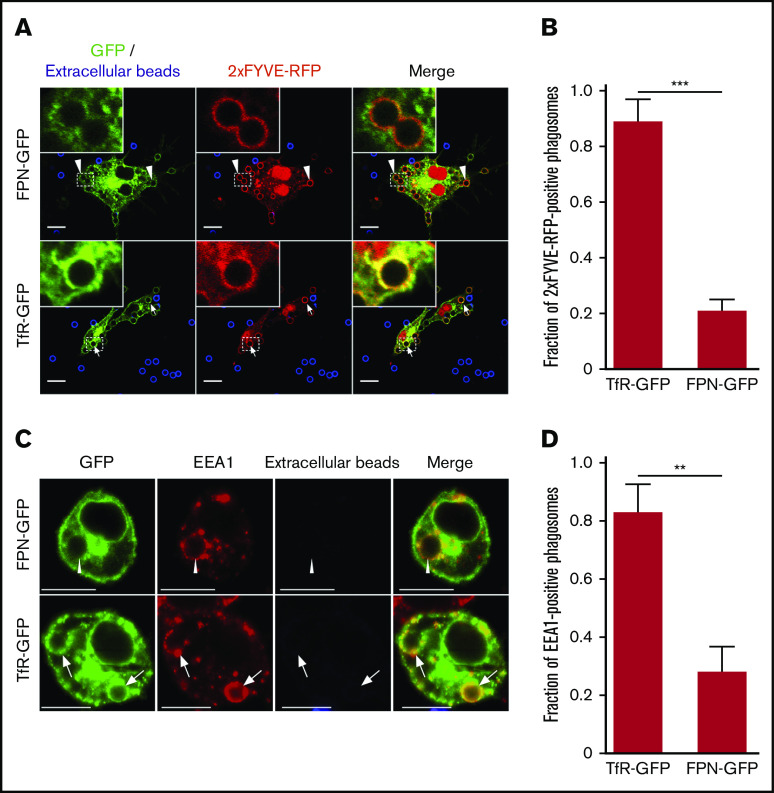
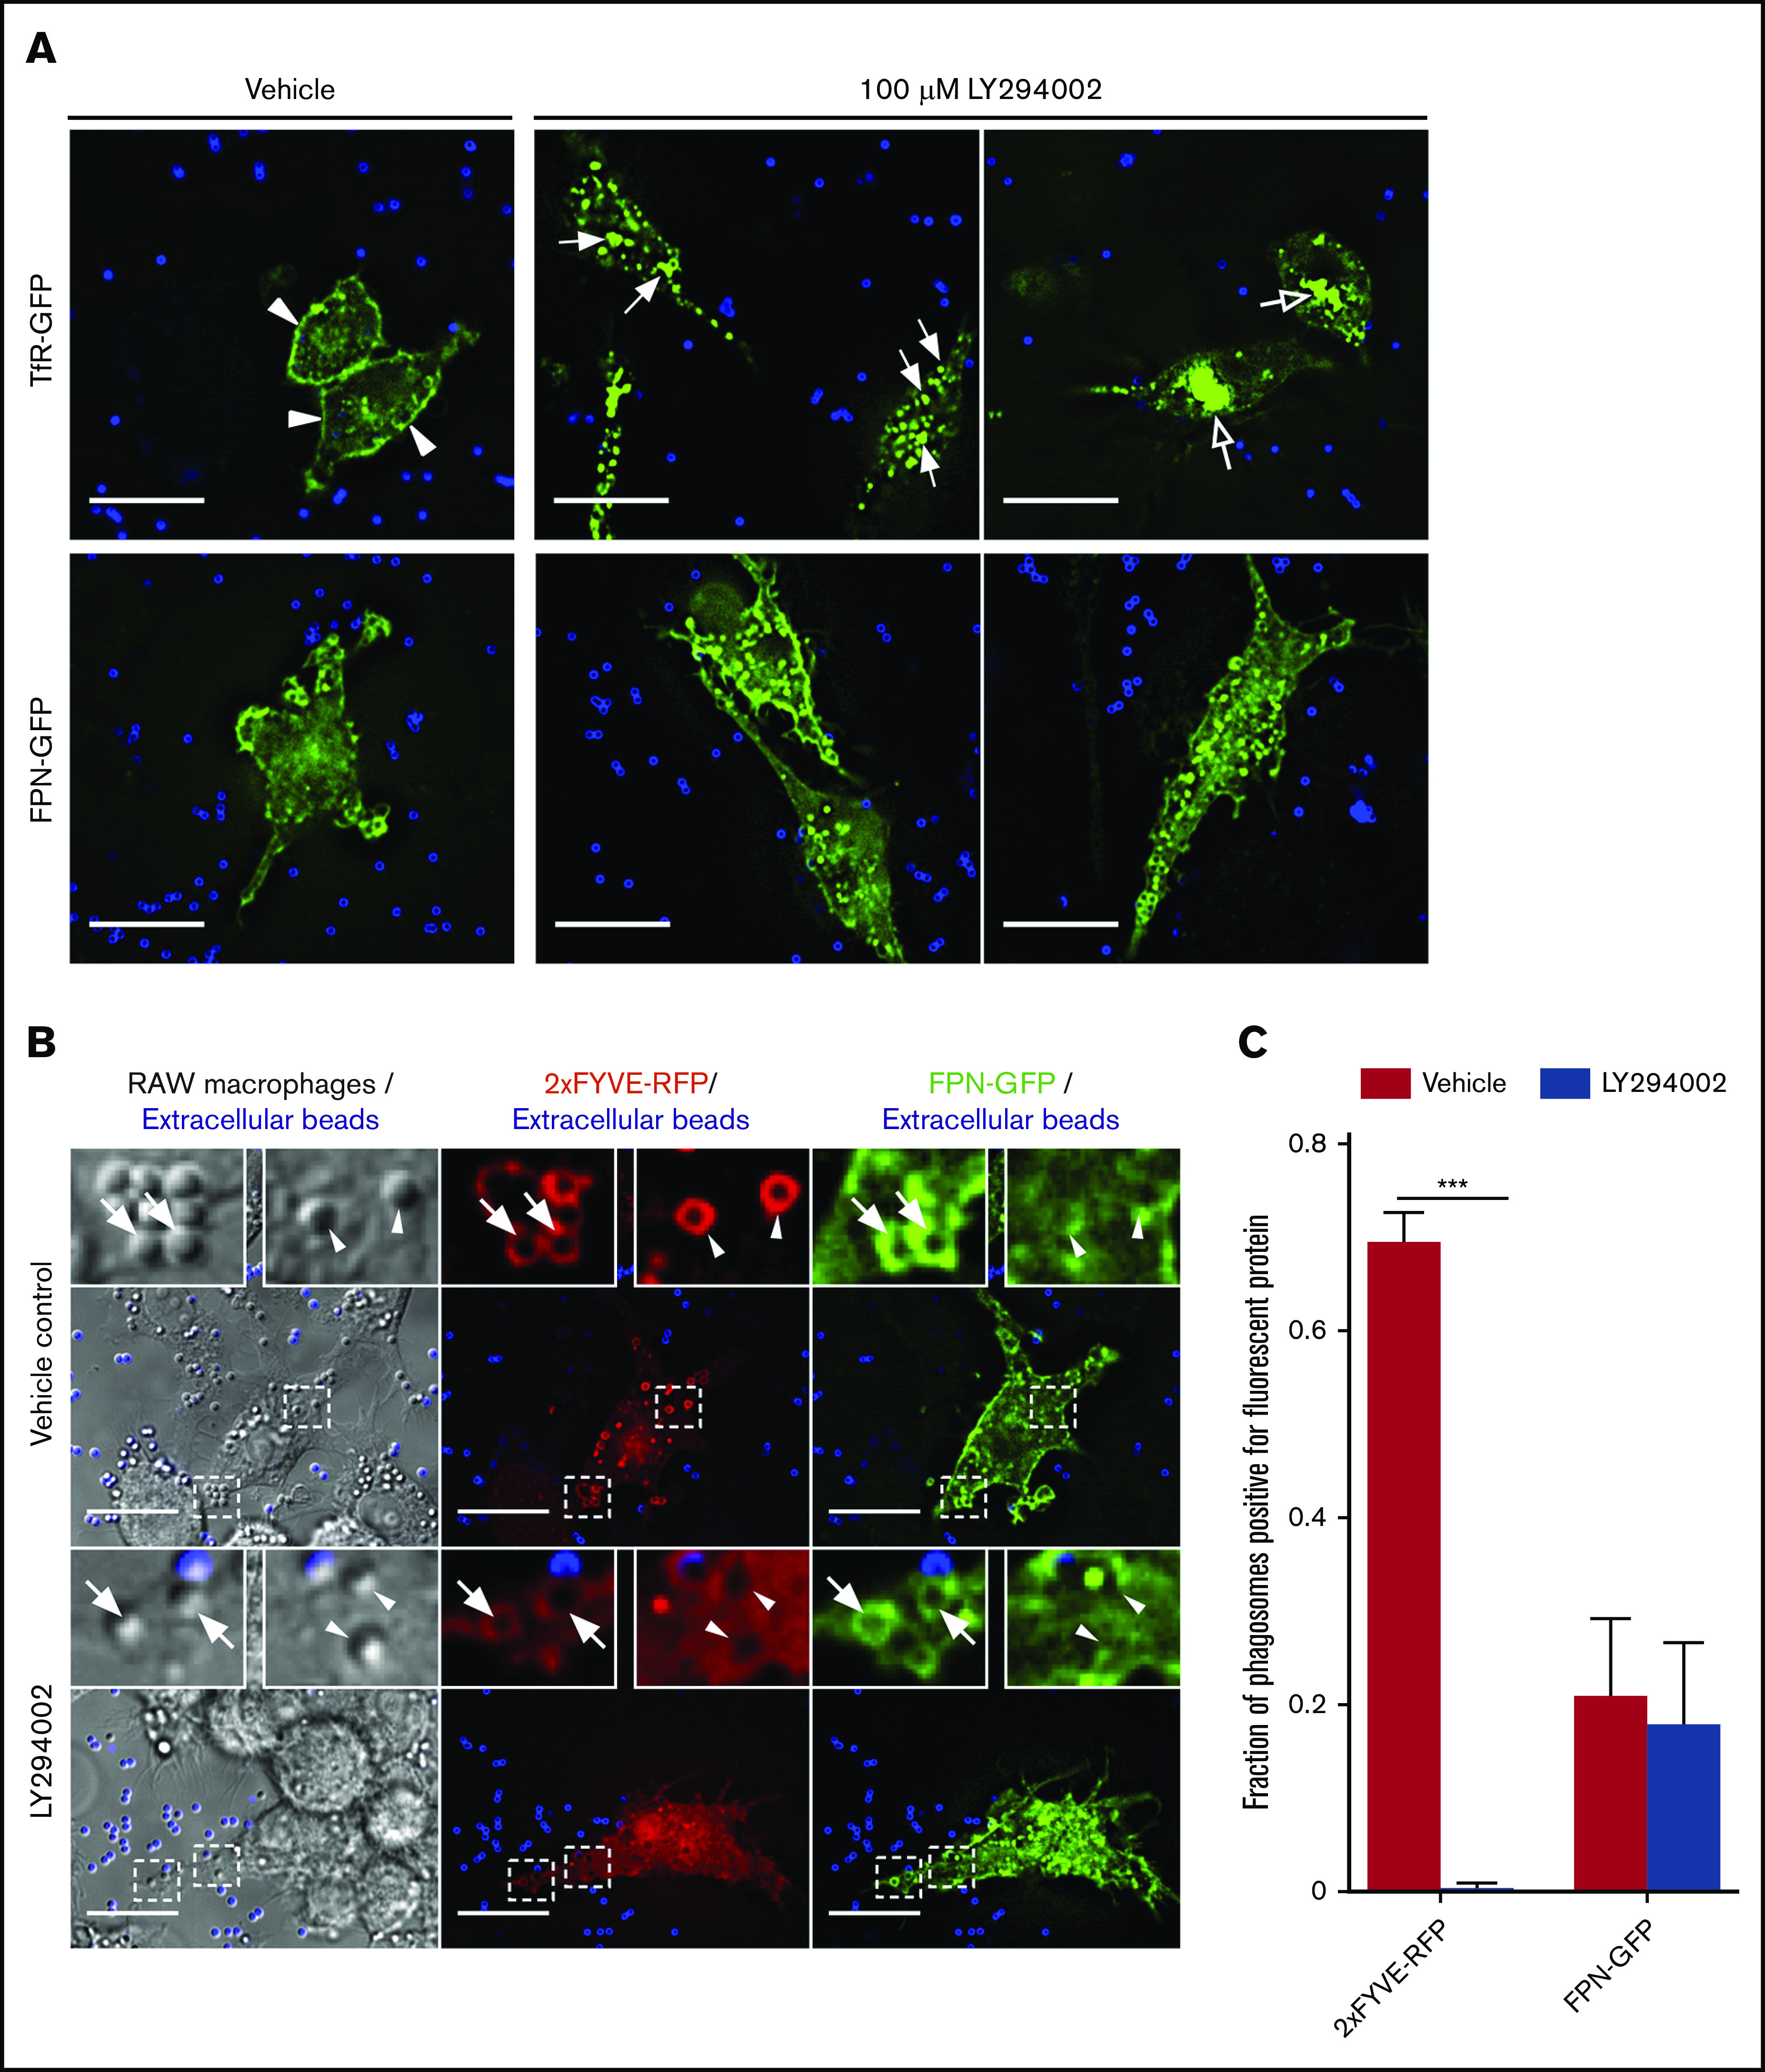
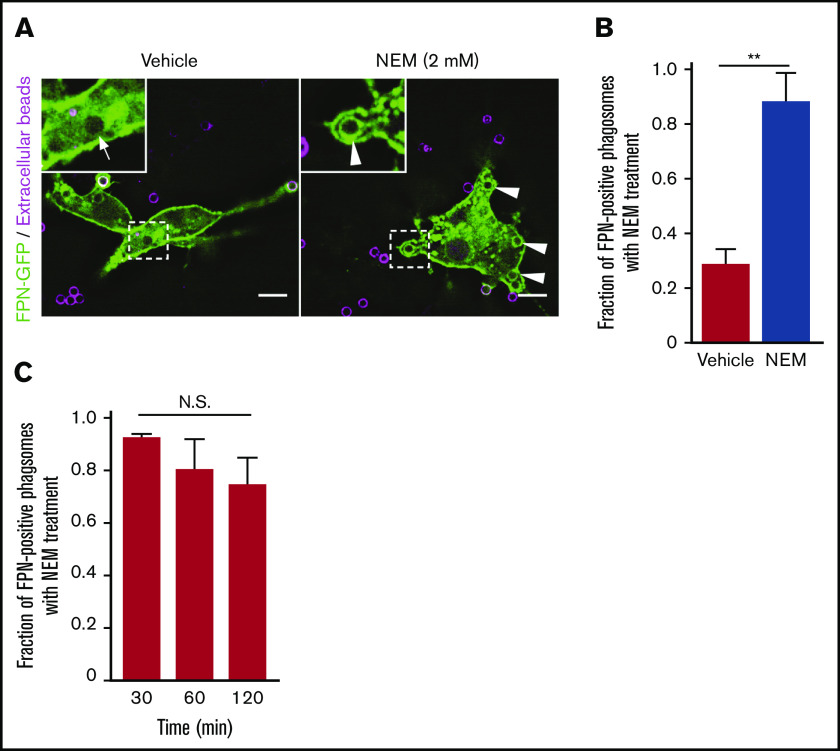
Nutrient sequestration is an essential facet of host innate immunity. Macrophages play a critical role in controlling iron availability through expression of the iron transport protein ferroportin (FPN), which extrudes iron from the cytoplasm to the extracellular milieu. During phagocytosis, the limiting phagosomal membrane, which derives from the plasmalemma, can be decorated with FPN and, if functional, will move iron from the cytosol into the phagosome lumen. This serves to feed iron to phagocytosed microbes and would be counterproductive to the many other known host mechanisms working to starve microbes of this essential metal. To understand how FPN is regulated during phagocytosis, we expressed FPN as a green fluorescent protein-fusion protein in macrophages and monitored its localization during uptake of various phagocytic targets, including Staphylococcus aureus, Salmonella enterica serovar Typhimurium, human erythrocytes, and immunoglobulin G opsonized latex beads. We find that FPN is rapidly removed, independently of Vps34 and PI(3)P, from early phagosomes and does not follow recycling pathways that regulate transferrin receptor recycling. Live-cell video microscopy showed that FPN movement on the phagosome is dynamic, with punctate and tubular structures forming before FPN is trafficked back to the plasmalemma. N-ethylmaleimide-sensitive factor, which disrupts soluble NSF attachment protein receptor (SNARE)-mediated membrane fusion and trafficking, prevented FPN removal from the phagosome. Our data support the hypothesis that removal of FPN from the limiting phagosomal membrane will, at the cellular level, ensure that iron cannot be pumped into phagosomes. We propose this as yet another mechanism of host nutritional immunity to subvert microbial growth.


Conflict of interest statement

Conflict-of-interest disclosure: The authors declare no competing financial interests.

Figures

None
Graphical abstract
Figure 1.
Figure 1.
FPN-GFP localizes to the plasmalemma and is responsive to hepcidin. (A) RAW cells were cotransfected with PM-RFP (red) and pTF1 (green) and then fixed. Scale bars, 20 μm. (B) Graph depicts the average number of phagocytosed beads per cell in untransfected (ie, GFP-negative) RAW cells or RAW cells transfected with pTF1 encoding FPN-GFP. Data are the mean ± standard deviation (SD) derived from 3 independent experiments. Statistical significance was determined using an unpaired Student t test. (C) The responsiveness of wild-type FPN fused to GFP and a C326S mutant of FPN fused to GFP to hepcidin treatment is shown. RAW macrophages expressing each GFP fusion protein were treated for 2 hours with vehicle control or recombinant hepcidin (400 nM). Prior to the addition of hepcidin or vehicle control, RAW macrophages were treated with 50 μg/mL cycloheximide for 2 hours. Prior to fixation, macrophages were labeled with TRITC-WGA to mark the macrophage plasmalemma. (D) Quantitation of the mean GFP fluorescence normalized to TRITC-WGA fluorescence at the plasmalemma is shown. The data are the mean ± standard error of the mean (SEM) of 3 independent experiments with at least 36 cells analyzed for each condition. Statistical significance was determined by a paired Student t test, *P < .05. Images represent fixed samples of the indicated conditions and were acquired using widefield fluorescence microscopy. N.S., not significant.
Figure 2.
Figure 2.
FPN is transiently present on phagosomes containing S aureus. (A) Confocal images of RAW macrophages expressing FPN-GFP (in green) having been exposed to live eFluor-670–labeled S aureus (in blue) for 5 and 15 minutes are shown. Bacteria that were extracellular at 5 minutes were marked with a TRITC-conjugated secondary antibody (in red). Arrows point to phagocytosed S aureus that are demarcated by GFP fluorescence at 5 minutes. In the bottom panels, the arrowheads point to phagocytosed S aureus that are not demarcated by GFP at 15 minutes. The white arrow points to an S aureus coccus that is enveloped by GFP at the same time point; however, the presence of TRITC fluorescence indicates this bacterium was engulfed after the 5- minute time point. The dashed lines indicate the areas of the cell analyzed by the line scans that are presented to right of the micrographs for 5 minutes (top graph) and 15 minutes (bottom graph). Scale bars, 10 μm. (B) The localization of FPN-GFP to phagosomes containing S aureus expressing mCherry (top row, in red), IgG-opsonized latex beads (middle row), and S typhimurium expressing RFP (bottom row, in red) at 1 hour postphagocytosis is shown. IgG-opsonized beads remaining extracellular at 1 hour were marked with an anti-human Cy3-conjugated antibody and are in red (middle panel). Cells were also immunostained for endogenous LAMP-1 (in blue). Scale bars, 10 μm. (C) The fraction of FPN-GFP–positive phagosomes at 1 hour postphagocytosis is plotted for the 3 distinct phagocytic targets shown in panel B. These data are the mean ± SD from 3 independent experiments. Statistical significance was determined using an ordinary 1-way analysis of variance and a Tukey multiple comparison. n.s., not significant. (A-B) The images were acquired from fixed samples at the indicated times using laser scanning confocal microscopy. *Indicates the position of representative bead containing phagosomes. p.i., postinfection.
Figure 3.
Figure 3.
FPN-GFP is rapidly depleted from the phagosomal membrane independently of hepcidin. (A) Schematic depicts the strategy employed to define phagosome “age.” For both time points shown, any bead or phagosome containing a fluorescent bead was excluded from the analysis for FPN-GFP positivity. (B) The distribution of FPN-GFP in relation to phagosomes that can only have existed for a maximum of 5 and 15 minutes is shown. The white arrows point to beads that are demarcated by FPN-GFP, whereas the arrowheads point to beads that have lost the GFP signal. The asterisks in the top row of micrographs highlight 2 beads that can be seen in the DIC but are outside of the fluorescence focal plane and that do show FPN-GFP accumulation. The images shown were acquired from paraformaldehyde-fixed samples and are a z-projection representing the cumulative signal from 5 consecutive z-positions acquired by widefield fluorescence microscopy. Scale bars, 10 μm. (C) RAW macrophages expressing a hepcidin-resistant mutant (C326S) of FPN fused to GFP (FPN(mut)-GFP) was exposed to IgG-opsonized beads. The distribution of FPN(mut)-GFP at the phagosomal membrane was monitored by microscopy at 5, 15, and 60 minutes postaddition of phagocytic targets. The dashed box demarcates the area of the cell presented in the insets. The white arrows point to FPN-positive phagosomes, whereas arrowheads point to FPN-negative phagosomes. Fluorescent micrographs were acquired by widefield microscopy and were taken of fixed cells at the indicated time points. Scale bars, 10 μm. (D) Quantitation of the fraction of FPN-positive phagosomes at the indicated time points is shown for RAW macrophages expressing wild-type FPN or the hepcidin-resistant mutant. The data are the mean ± SEM of 3 independent experiments. Statistical significance was determined by unpaired Student t test at each time point.
Figure 4.
Figure 4.
FPN-GFP expressed in primary human M-CSF–derived macrophages is rapidly removed from phagosomes. (A) Primary human macrophages, transduced with a lentivirus-producing FPN-GFP, are shown after having been exposed to IgG opsonized for only 4 minutes (top row) or 14 minutes (middle and bottom rows). Shown at the 14-minute time point are macrophages from 2 independent PBMC donors. Extracellular beads (in blue) at 4 and 14 minutes were marked with an anti-human AlexaFluor-647-conjugated secondary antibody. The macrophage plasmalemma was labeled with TRITC-conjugated WGA (in red). The white arrows point to FPN-GFP–positive phagosomes, whereas the arrowheads point to FPN-GFP–negative phagosomes that are present at the 14-minute timepoint. The representative micrographs were taken of fixed samples using laser scanning confocal microscopy. Scale bars, 10 μm. (B) The fraction of FPN-GFP–positive phagosomes in primary human M-CSF–derived macrophages expressing FPN-GFP at 4 and 14 minutes postphagocytosis is shown. These data derive from 2 independent experiments using 2 independent blood donors, and the graph represents the mean ± SD. Statistical significance was determined using an unpaired Student t test with a Welch’s correction. ****P < .0001.
Figure 5.
Figure 5.
FPN is removed from the early phagosome and differs from TfR recycling. (A) The laser scanning confocal fluorescent micrographs depict RAW macrophages expressing FPN-GFP (top row) or TfR-GFP (bottom row) (both in green) and the PI(3)P biosensor 2×FYVE-RFP (red) that were allowed to phagocytose IgG-coated beads for 10 minutes. After fixation, the presence of phagosomal FPN-GFP, TfR-GFP, and 2×FYVE-RFP was analyzed. Arrows indicate a TfR and 2×FYVE-positive phagosome, whereas arrowheads indicate FPN-negative but 2×FYVE-positive phagosomes. Scale bars, 10 µm. (B) The graph depicts the fraction of 2×FYVE-positive phagosomes that are also positive for either FPN- or TfR-GFP. The data represent the mean ± SD derived from ≥56 phagosomes from at least 3 independent experiments. Statistical significance was determined using an unpaired Student t test with a Welch’s correction. (C) The confocal fluorescent micrographs also depict RAW macrophages expressing either FPN-GFP or TfR-GFP (in green) that were fixed and immunostained for endogenous EEA1 (in red) using rabbit anti-EEA1 antibody followed by anti-rabbit Cy3-conjugated secondary. The cells were allowed to phagocytose IgG opsonized beads for 10 minutes prior to fixation and staining. Scale bars, 10 μm. The white arrows point to phagosomes that are TfR positive and EEA1 positive, whereas the arrowheads point to representative phagosomes that are FPN negative yet are EEA1 positive. Scale bars, 10 μm. (D) The graph depicts the fraction of EEA1-positive phagosomes at 10 minutes post–bead exposure that are either TfR-GFP or FPN-GFP positive. The data are the mean ± SD of 3 independent experiments, and statistical significance was determined by an unpaired Student t test with a Welch’s correction.  **P < .01; ***P < .001.
Figure 6.
Figure 6.
PI3K inhibition by LY294002 treatment does not perturb FPN-GFP removal from phagosomes. (A) The effect of PI3K inhibition by LY294002 on the distribution of TfR-GFP and FPN-GFP is shown. RAW cells transfected with either TfR-GFP (top row) or FPN-GFP (bottom row) were pretreated with 100 μM LY294002 or with a vehicle control for 30 minutes. IgG-coated beads were then added to initiate phagocytosis, and cells were fixed 30 minutes after addition. Extracellular beads were labeled fluorescently (blue). Scale bars, 20 µm. (A) Arrowheads highlight the presence of TfR-GFP primarily at the plasma membrane in vehicle control–treated cells. Filled arrows emphasize enlarged TfR-GFP–containing endosomal vesicles, and open arrows indicate the perinuclear accumulation of TfR-GFP in LY294002-treated cells. The images acquired by widefield fluorescence microscopy are representative of at least 3 independent experiments. (B) The widefield fluorescent micrographs depict RAW cells expressing the PI(3)P-biosensor 2×FYVE-RFP (in red) and FPN-GFP (green) were pretreated with dimethyl sulfoxide (vehicle control) or 100 μM LY294002 (PI3K inhibitor) for 10 minutes. IgG-coated beads (1 μm in size) were added for 10 minutes to allow for phagocytosis prior to fixation. Beads that were not phagocytosed were marked with an AlexaFluor-647 secondary antibody prior to fixation and are colored blue. Arrowheads indicate FPN-negative phagosomes, whereas arrows indicate FPN-positive phagosomes. Scale bars, 20 µm. (C) The graph depicts the fraction of phagosomes positive for 2×FYVE-RFP or FPN-GFP from either vehicle control or LY294002-treated cells. The data represent the mean ± SEM from ≥100 phagosomes from 3 independent experiments. Statistical significance was determined using unpaired Student t tests with a Welch’s correction, where ***P < .001.
Figure 7.
Figure 7.
Treatment of macrophages with NEM inhibits removal of FPN from the limiting phagosomal membrane. (A) RAW macrophages expressing FPN-GFP having phagocytosed biotinylated IgG-opsonized beads for 2 minutes prior to treatment with 2 mM NEM or vehicle control are shown. Extracellular beads (in magenta) were detected upon addition of NEM or vehicle by also adding AlexaFluor-647 conjugated avidin to the cells. Macrophages were fixed after 15 minutes, and the distribution of FPN-GFP around Alexa-647–negative phagosomes was analyzed. The hashed box demarcates the area of cells depicted in the insets. White arrows point to phagosomes that are FPN-GFP negative, whereas arrowheads point to sealed phagosomes (ie, that are avidin negative) that are FPN-GFP positive. Images were acquired using widefield fluorescence microscopy. Scale bars, 10 μm. (B) The graph depicts the fraction of FPN-GFP–positive phagosomes in the presence and absence of NEM 15 minutes after the addition of IgG targets. Note NEM was added 2 minutes after the addition of beads. The data are the mean ± SEM of 3 independent experiments. Statistical significance was determined by an unpaired Student t test, with a Welch’s correction; **P < .01. (C) The graph depicts the fraction of FPN-GFP–positive phagosomes in the presence of NEM at the indicated times on the x-axis. The data are the mean ± SEM of 3 independent experiments. Statistical significance was determined by 1-way analysis of variance with a Bonferroni multiple comparisons test.

Similar articles

Cited by

References

    1. Weinberg ED. Iron and susceptibility to infectious disease. Science. 1974;184(4140):952-956. - PubMed
    1. Hood MI, Skaar EP. Nutritional immunity: transition metals at the pathogen-host interface. Nat Rev Microbiol. 2012;10(8):525-537. - PMC - PubMed
    1. Flannagan RS, Heit B, Heinrichs DE. Antimicrobial mechanisms of macrophages and the immune evasion strategies of Staphylococcus aureus. Pathogens. 2015;4(4):826-868. - PMC - PubMed
    1. Jabado N, Jankowski A, Dougaparsad S, Picard V, Grinstein S, Gros P. Natural resistance to intracellular infections: natural resistance-associated macrophage protein 1 (Nramp1) functions as a pH-dependent manganese transporter at the phagosomal membrane. J Exp Med. 2000;192(9):1237-1248. - PMC - PubMed
    1. Gruenheid S, Pinner E, Desjardins M, Gros P. Natural resistance to infection with intracellular pathogens: the Nramp1 protein is recruited to the membrane of the phagosome. J Exp Med. 1997;185(4):717-730. - PMC - PubMed

Publication types

Substances