

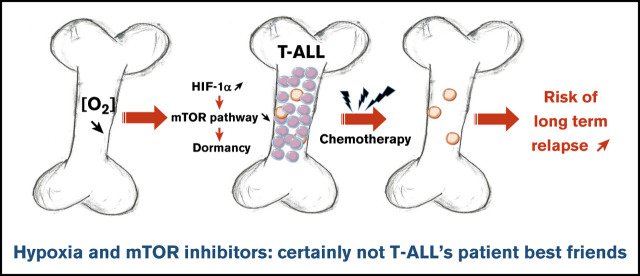
Hypoxia favors chemoresistance in T-ALL through an HIF1α-mediated mTORC1 inhibition loop
- PMID: 33496749
- PMCID: PMC7839374
- DOI: 10.1182/bloodadvances.2020002832
Hypoxia favors chemoresistance in T-ALL through an HIF1α-mediated mTORC1 inhibition loop
Abstract
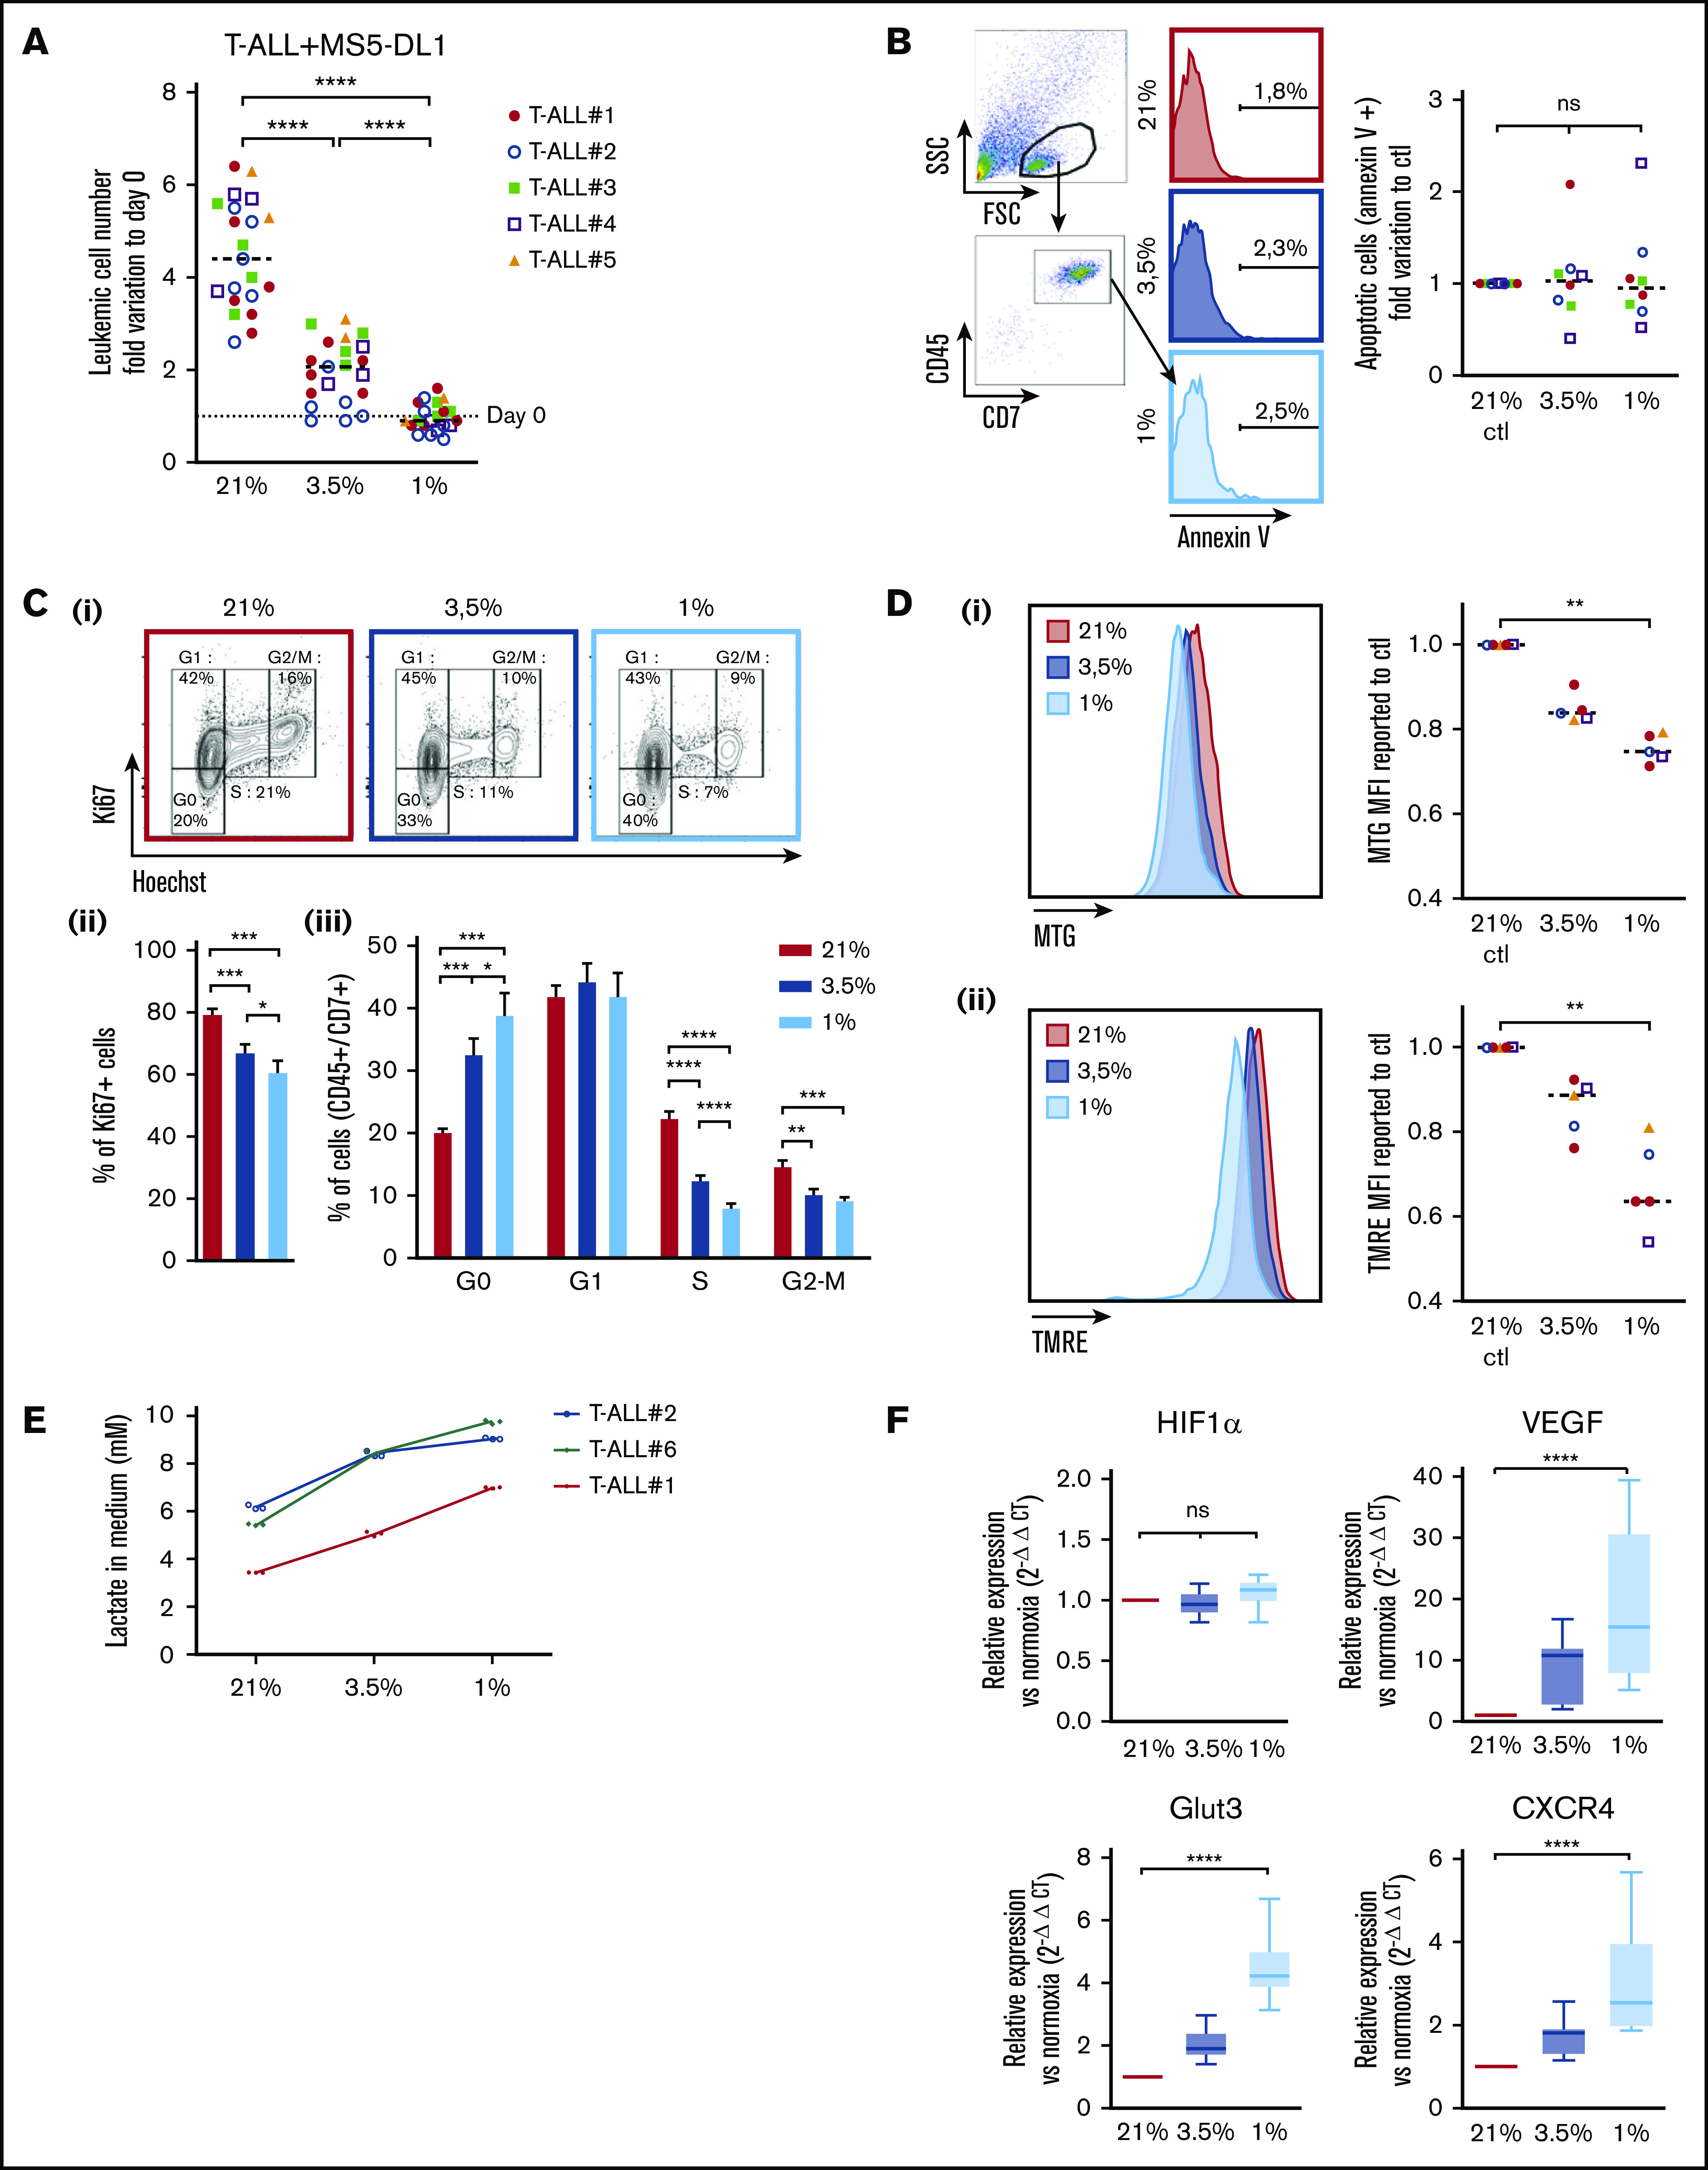
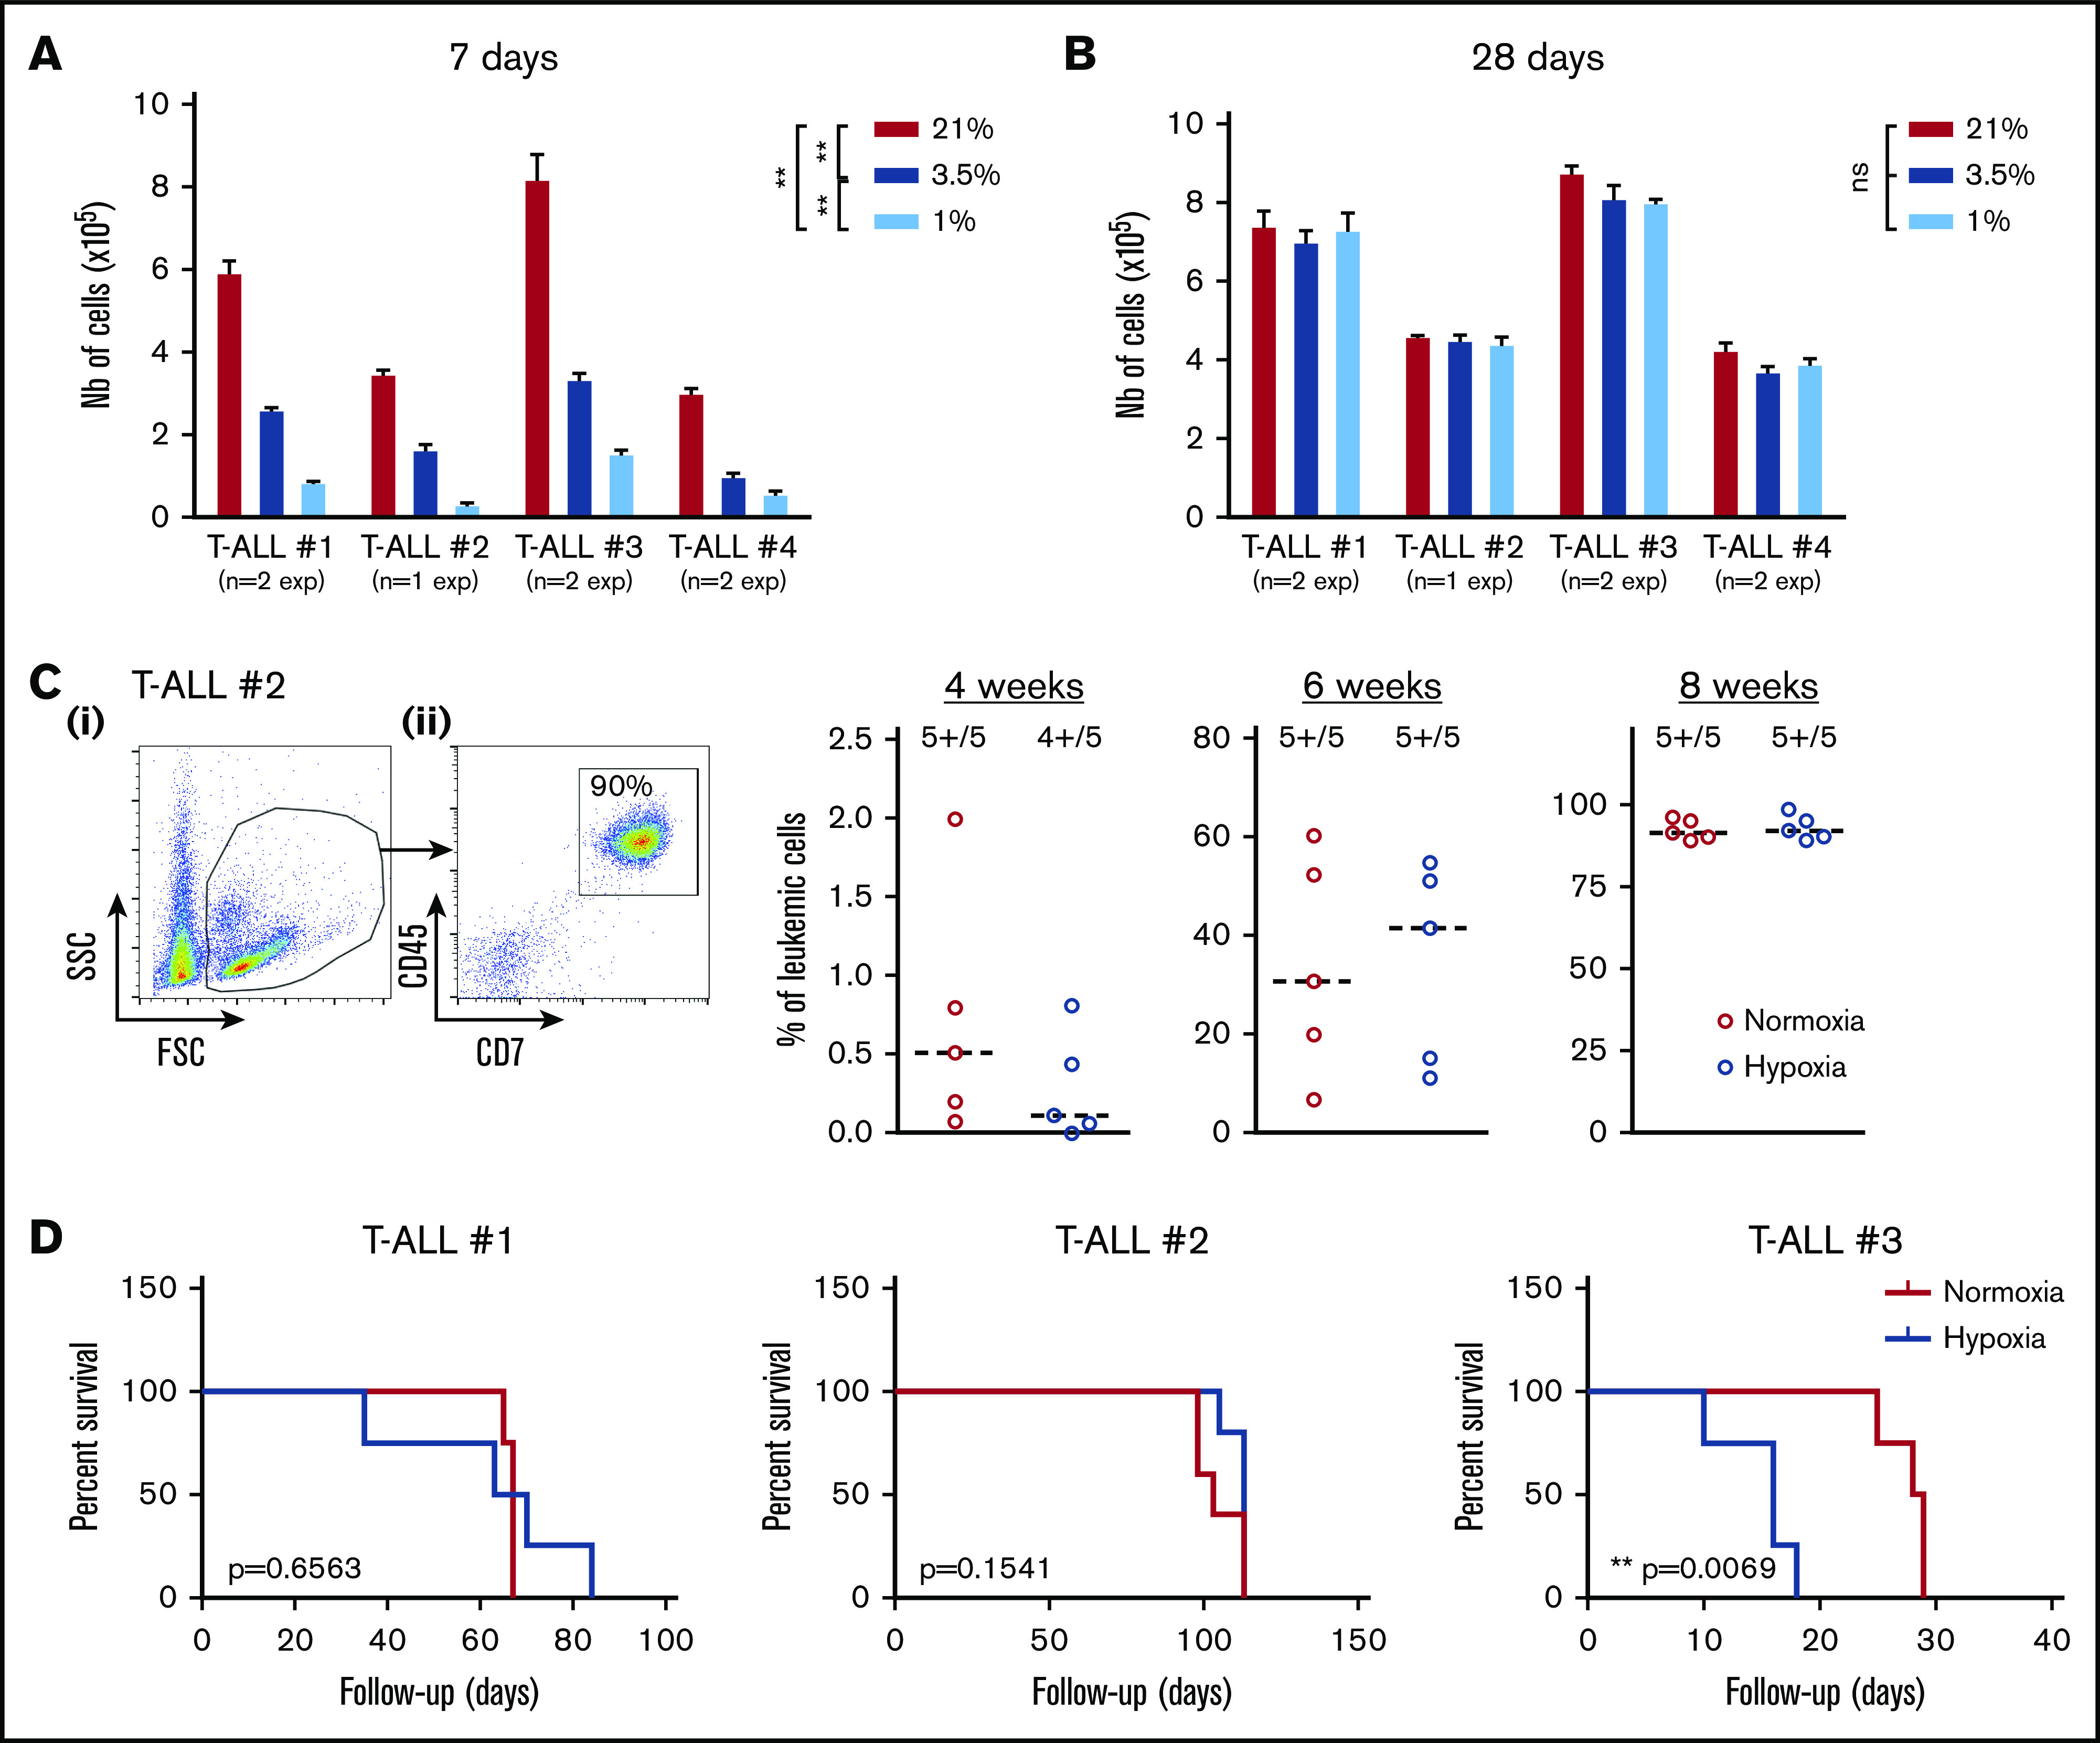
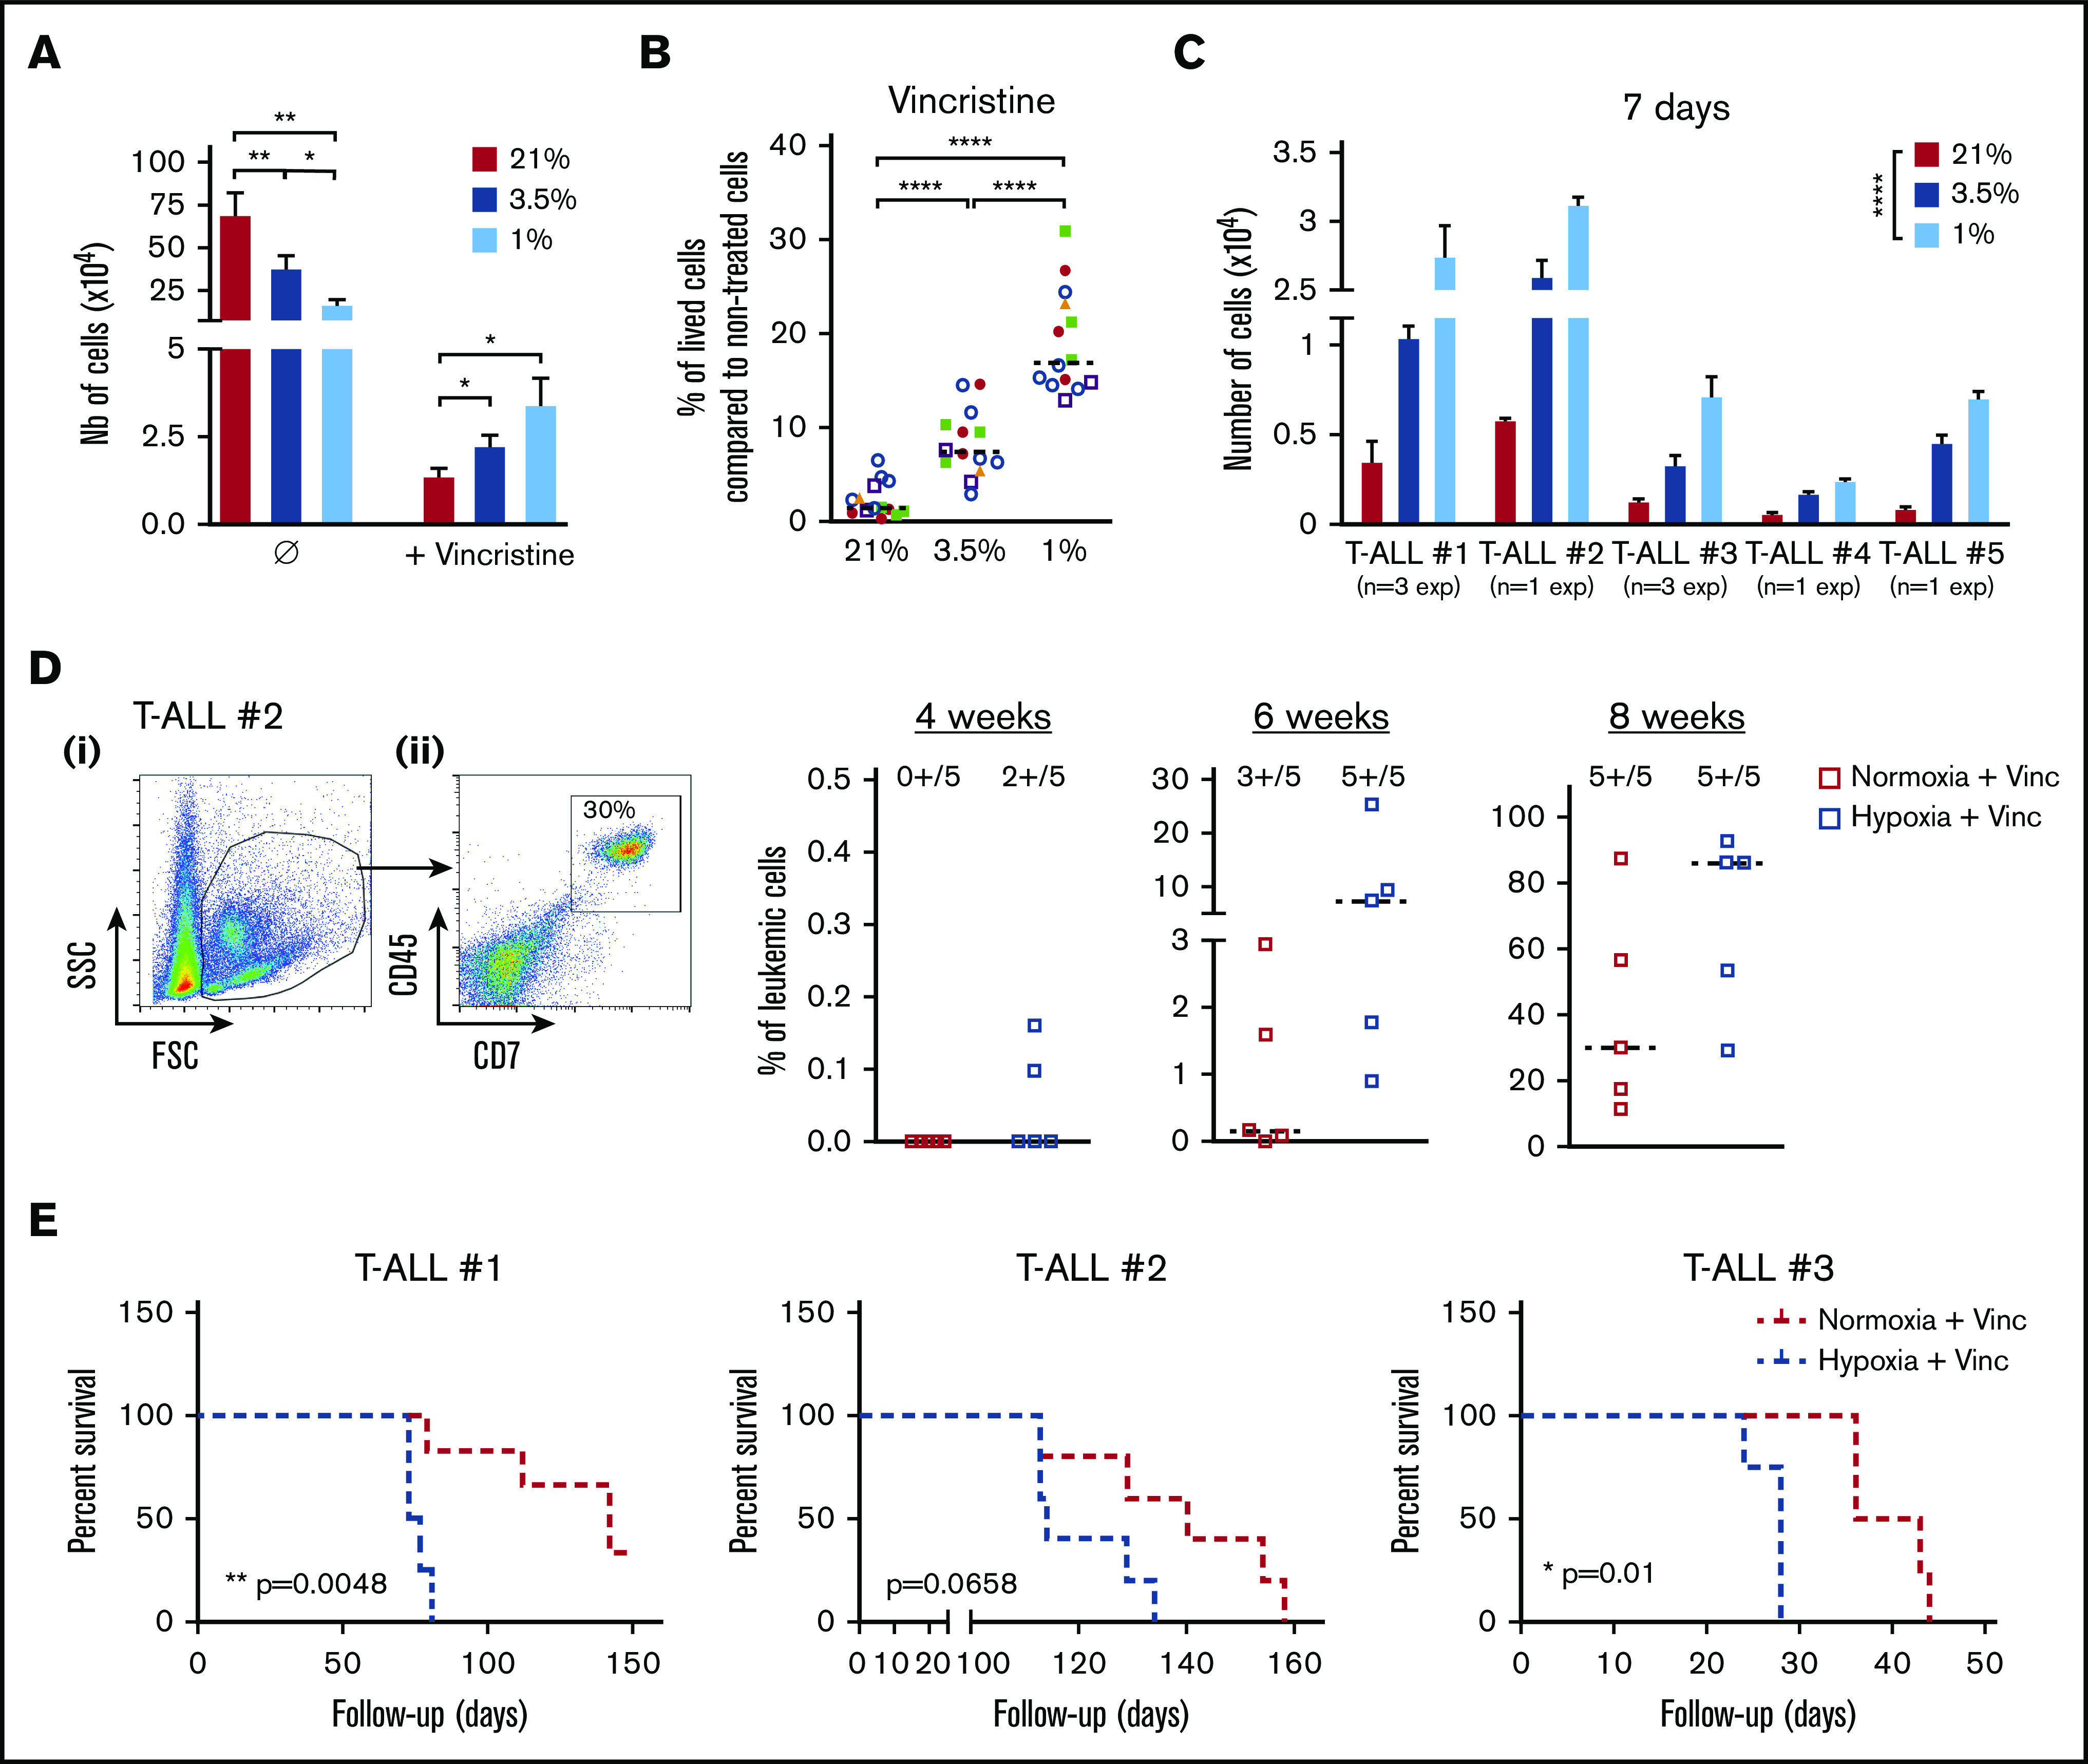
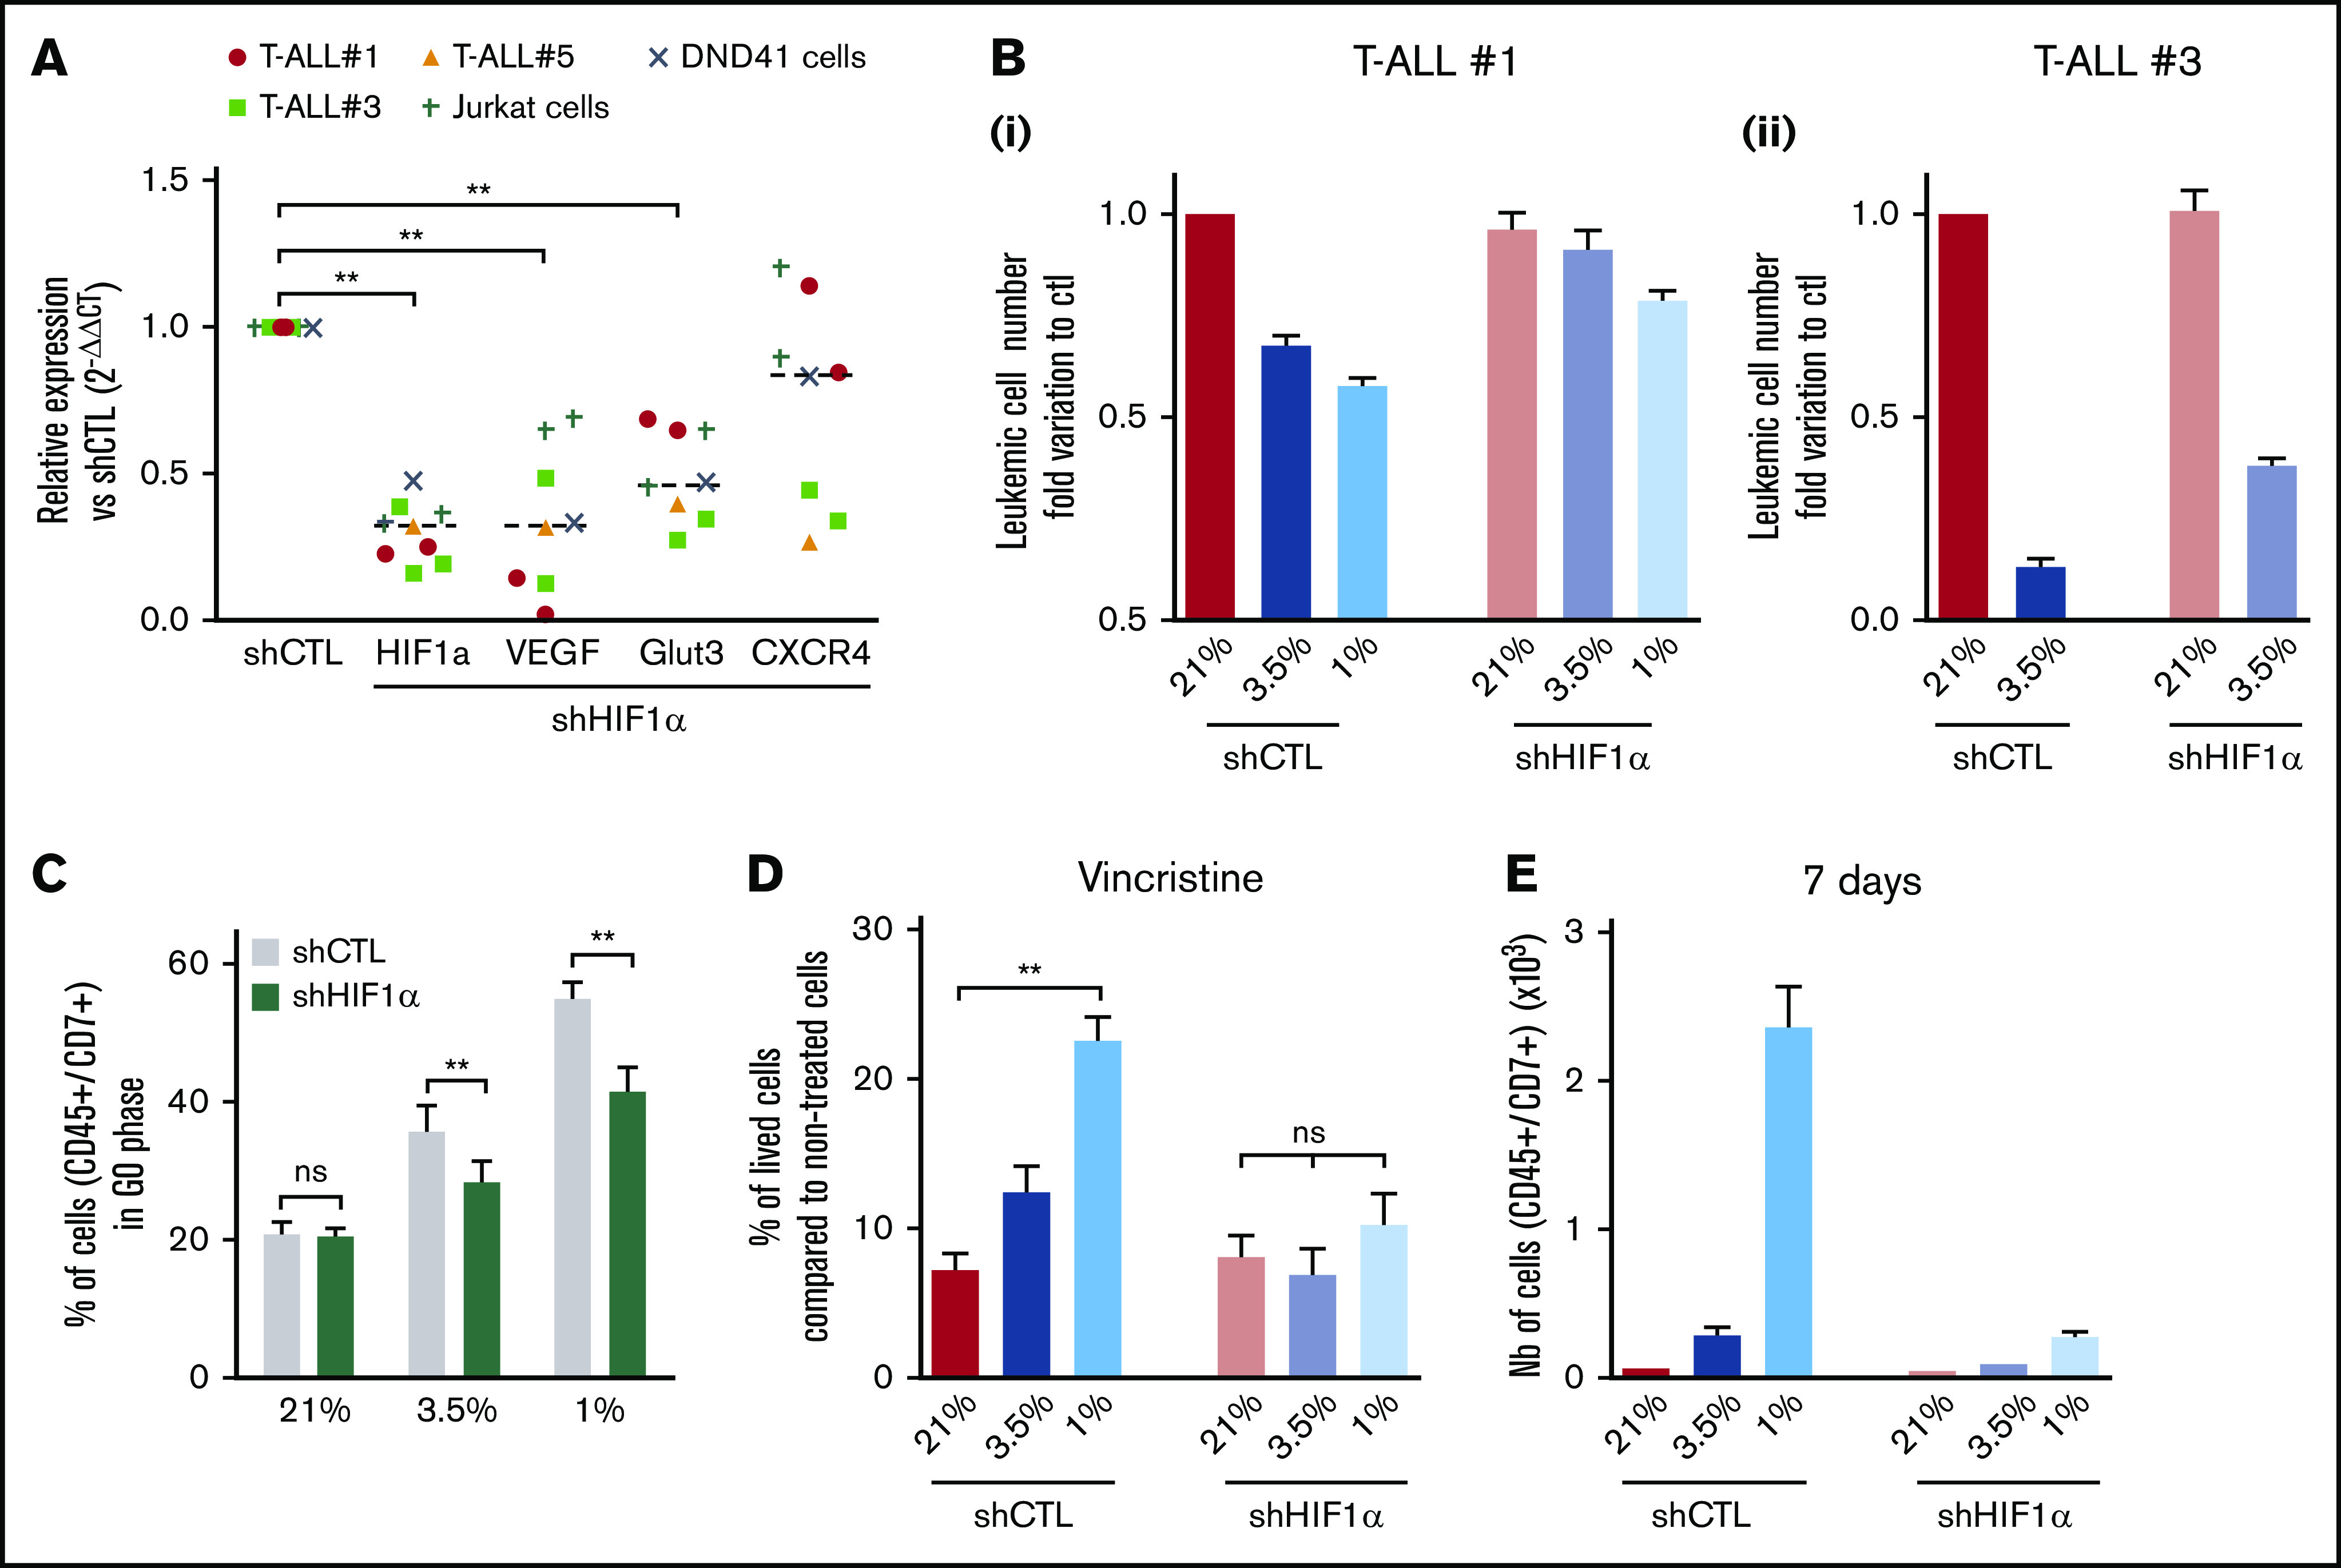
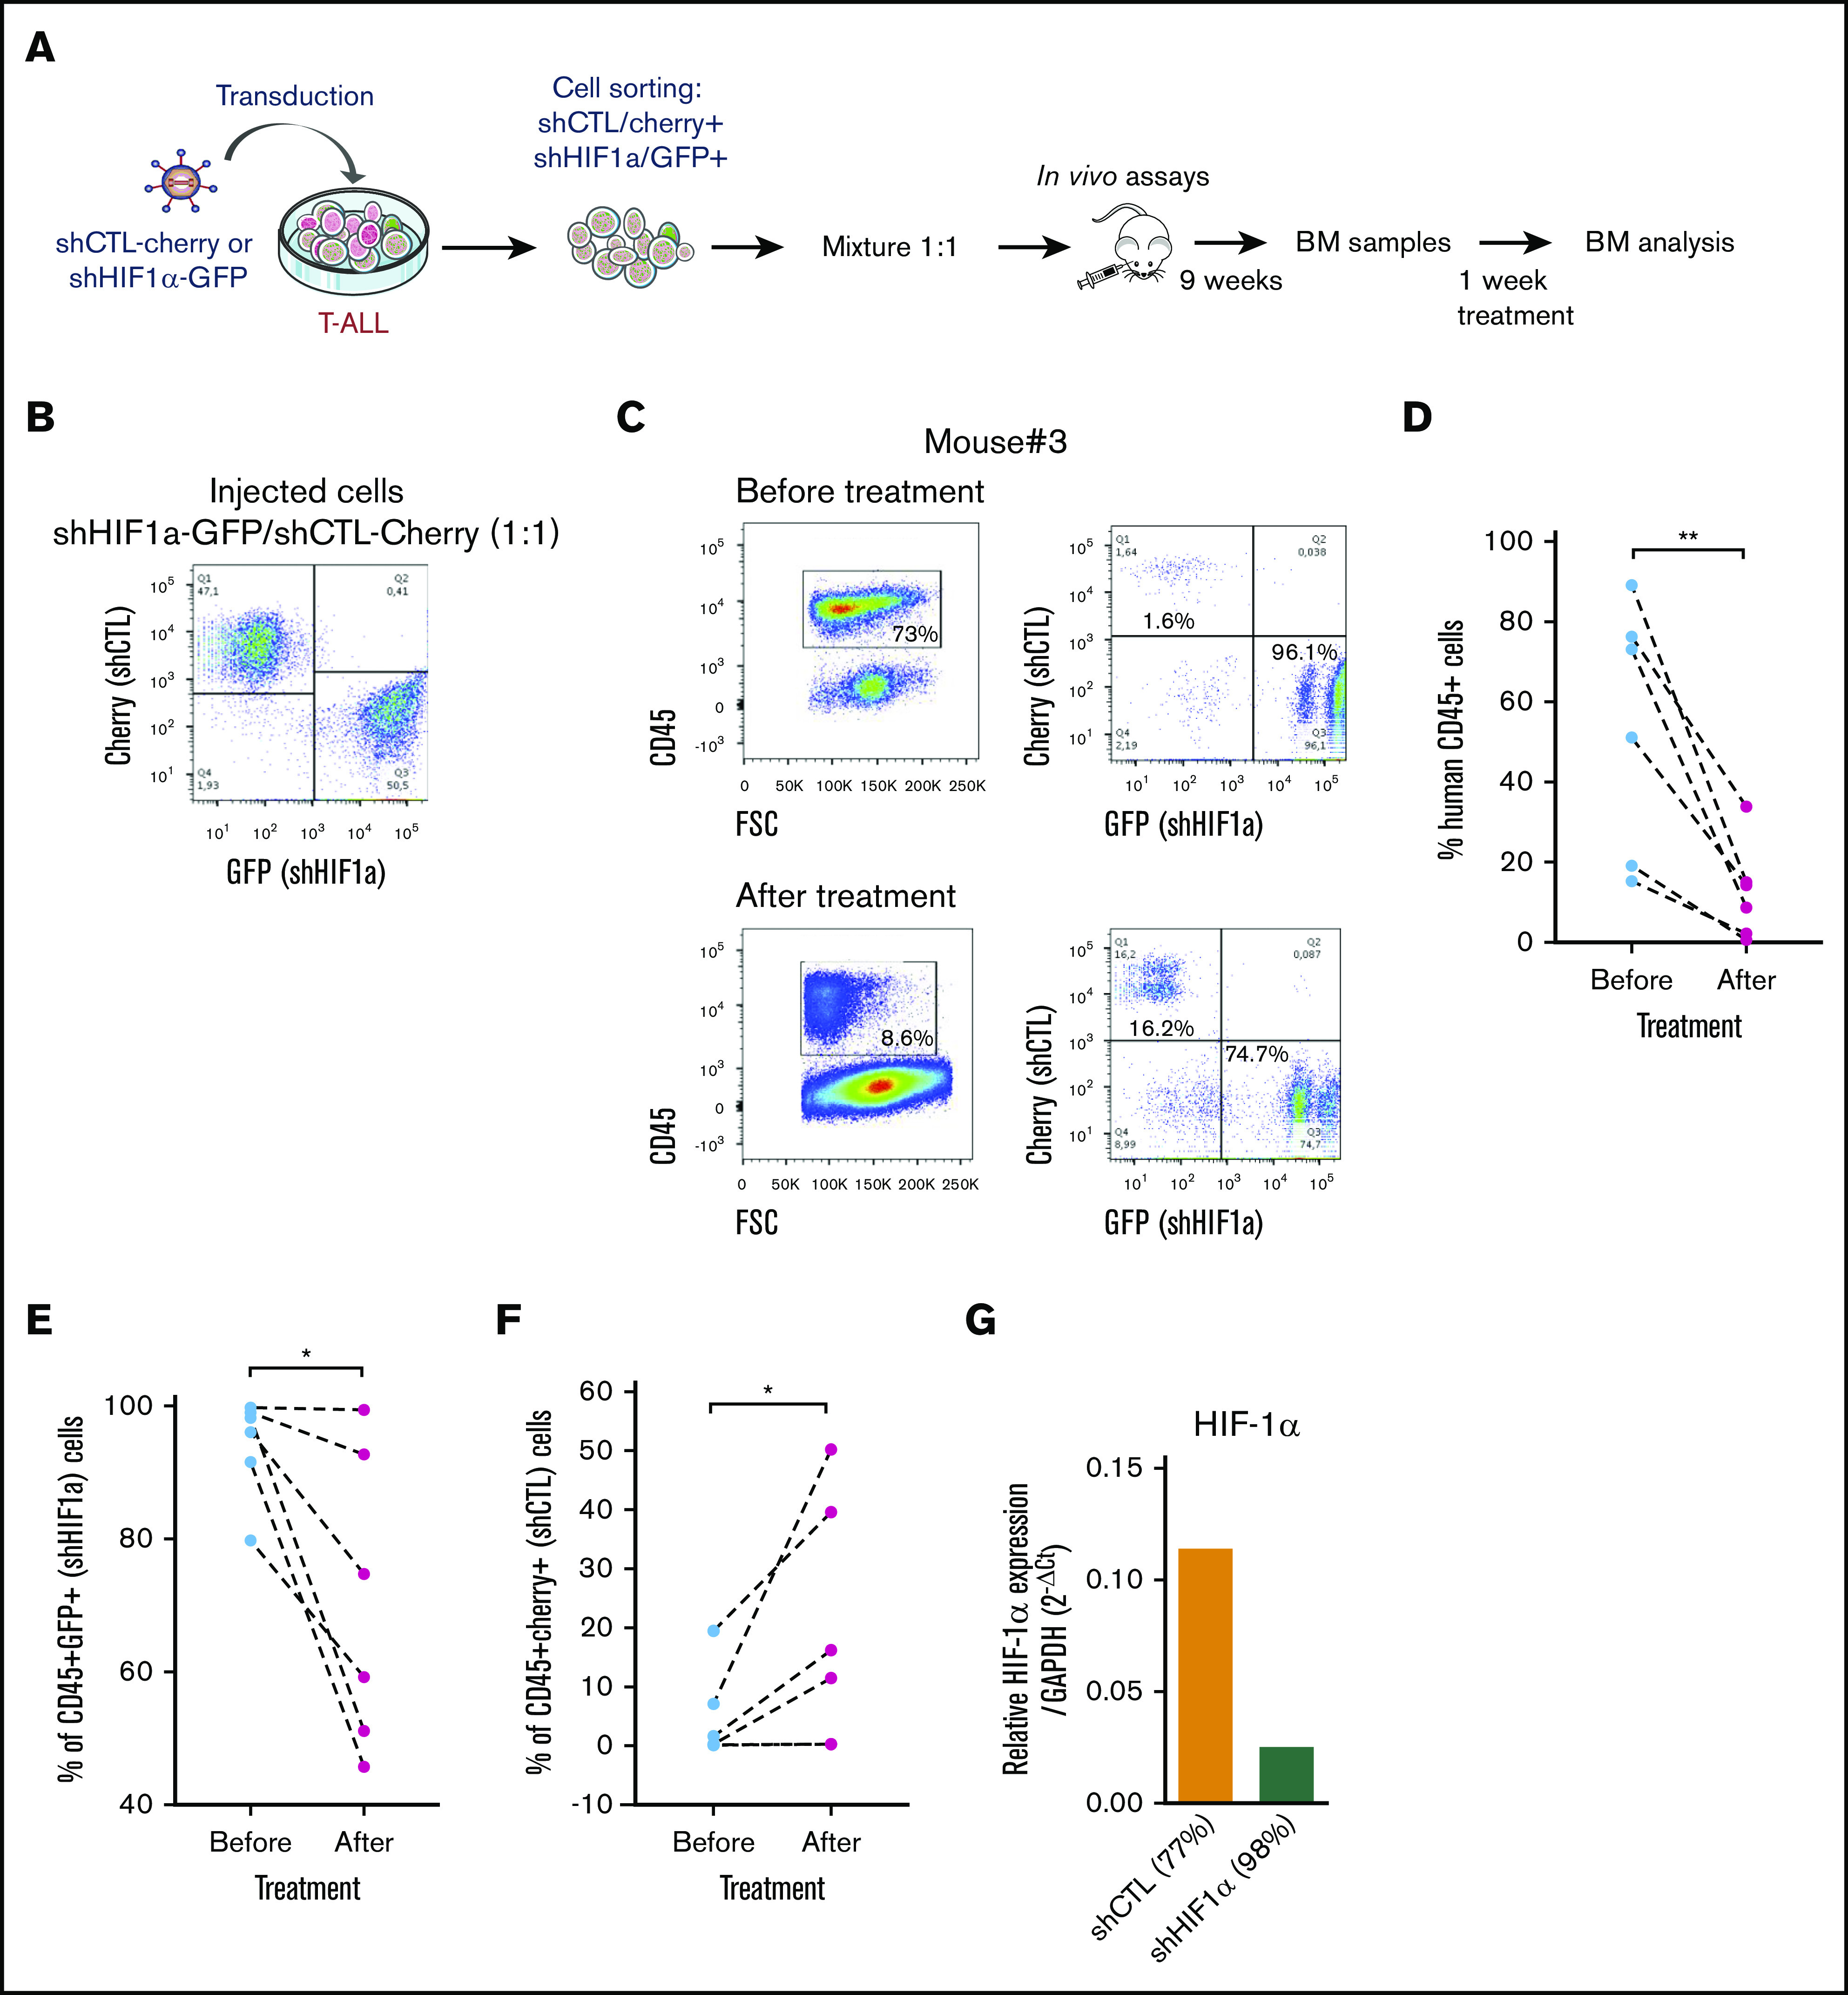
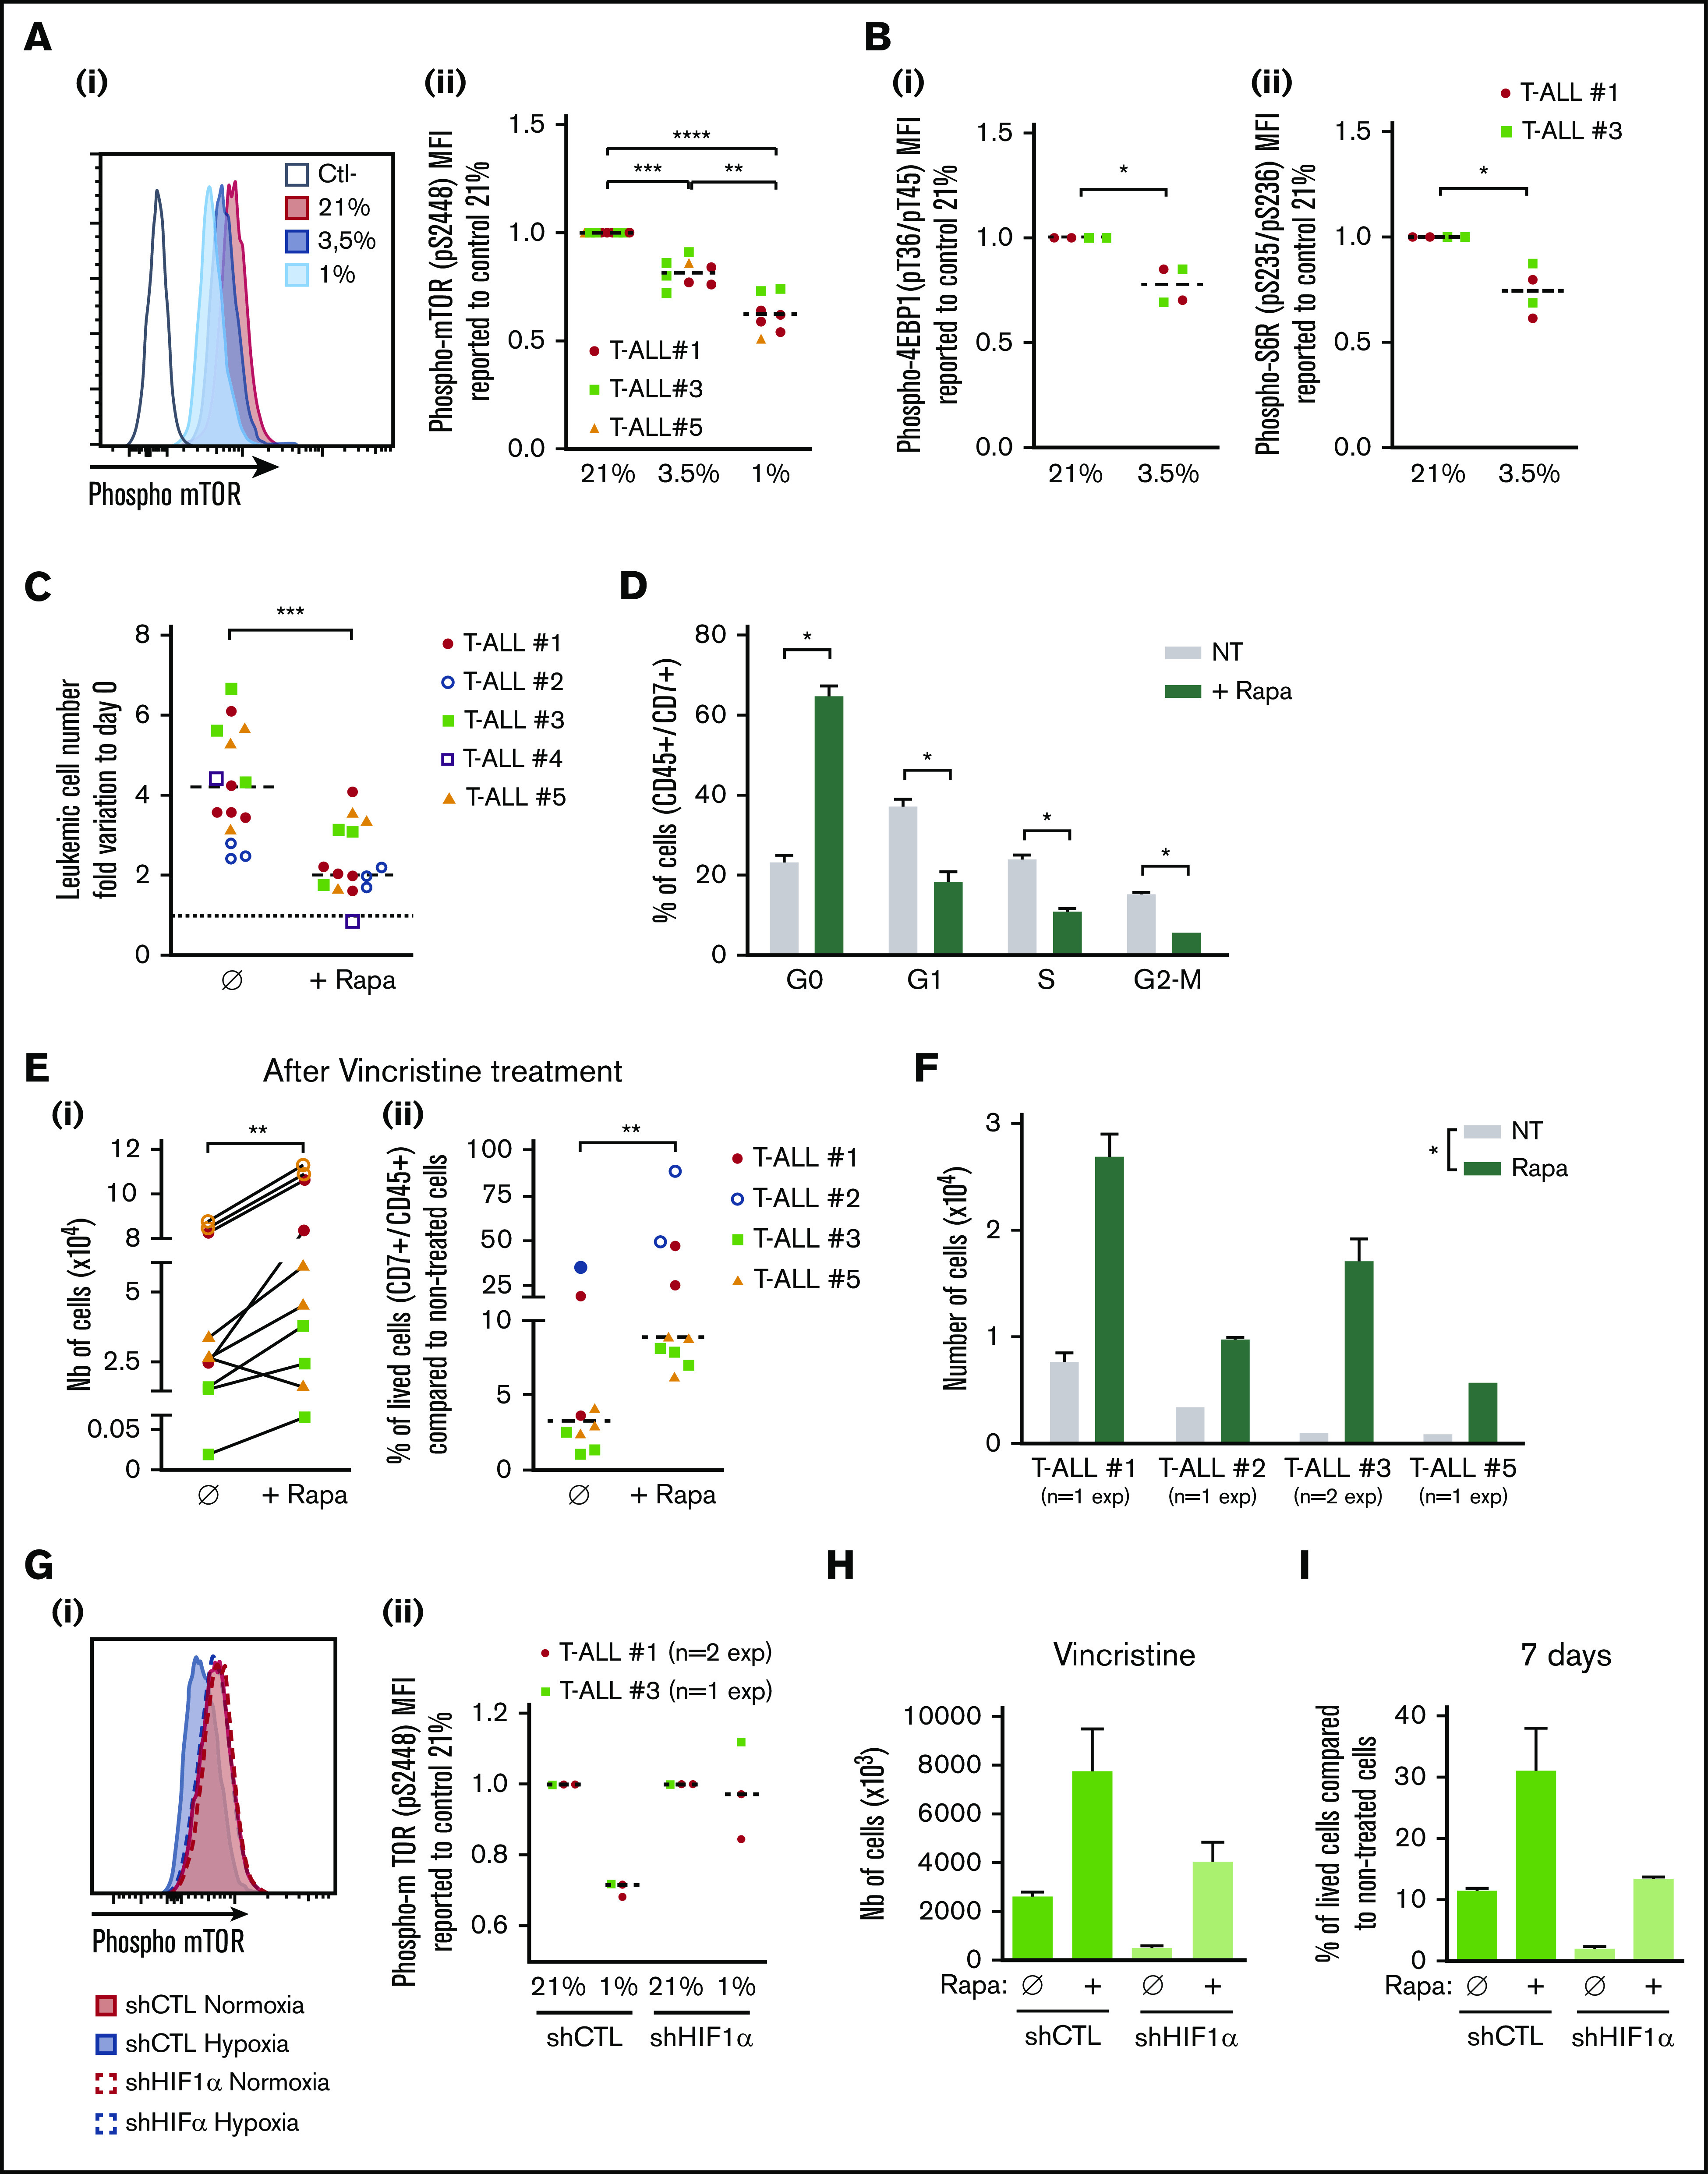
Resistance to chemotherapy, a major therapeutic challenge in the treatment of T-cell acute lymphoblastic leukemia (T-ALL), can be driven by interactions between leukemic cells and the microenvironment that promote survival of leukemic cells. The bone marrow, an important leukemia niche, has low oxygen partial pressures that highly participate in the regulation of normal hematopoiesis. Here we show that hypoxia inhibits T-ALL cell growth by slowing down cell cycle progression, decreasing mitochondria activity, and increasing glycolysis, making them less sensitive to antileukemic drugs and preserving their ability to initiate leukemia after treatment. Activation of the mammalian target of rapamycin (mTOR) was diminished in hypoxic leukemic cells, and treatment of T-ALL with the mTOR inhibitor rapamycin in normoxia mimicked the hypoxia effects, namely decreased cell growth and increased quiescence and drug resistance. Knocking down (KD) hypoxia-induced factor 1α (HIF-1α), a key regulator of the cellular response to hypoxia, antagonized the effects observed in hypoxic T-ALL and restored chemosensitivity. HIF-1α KD also restored mTOR activation in low O2 concentrations, and inhibiting mTOR in HIF1α KD T-ALL protected leukemic cells from chemotherapy. Thus, hypoxic niches play a protective role of T-ALL during treatments. Inhibition of HIF-1α and activation of the mTORC1 pathway may help suppress the drug resistance of T-ALL in hypoxic niches.
© 2021 by The American Society of Hematology.
Conflict of interest statement
Conflict-of-interest disclosure: The authors declare no competing financial interests.
Figures
Similar articles
-
Regulation of HIF-1α signaling and chemoresistance in acute lymphocytic leukemia under hypoxic conditions of the bone marrow microenvironment.Cancer Biol Ther. 2012 Aug;13(10):858-70. doi: 10.4161/cbt.20838. Epub 2012 Aug 1. Cancer Biol Ther. 2012. PMID: 22785211 Free PMC article.
-
Knockdown of KLF5 suppresses hypoxia-induced resistance to cisplatin in NSCLC cells by regulating HIF-1α-dependent glycolysis through inactivation of the PI3K/Akt/mTOR pathway.J Transl Med. 2018 Jun 14;16(1):164. doi: 10.1186/s12967-018-1543-2. J Transl Med. 2018. PMID: 29898734 Free PMC article.
-
Regulation of hypoxia-inducible factor 1alpha expression and function by the mammalian target of rapamycin.Mol Cell Biol. 2002 Oct;22(20):7004-14. doi: 10.1128/MCB.22.20.7004-7014.2002. Mol Cell Biol. 2002. PMID: 12242281 Free PMC article.
-
The Role of Hypoxic Bone Marrow Microenvironment in Acute Myeloid Leukemia and Future Therapeutic Opportunities.Int J Mol Sci. 2021 Jun 25;22(13):6857. doi: 10.3390/ijms22136857. Int J Mol Sci. 2021. PMID: 34202238 Free PMC article. Review.
-
Hypoxia-mediated drug resistance: novel insights on the functional interaction of HIFs and cell death pathways.Drug Resist Updat. 2011 Jun;14(3):191-201. doi: 10.1016/j.drup.2011.03.001. Epub 2011 Apr 3. Drug Resist Updat. 2011. PMID: 21466972 Review.
Cited by
-
Regulation of Hypoxia Dependent Reprogramming of Cancer Metabolism: Role of HIF-1 and Its Potential Therapeutic Implications in Leukemia.Asian Pac J Cancer Prev. 2024 Apr 1;25(4):1121-1134. doi: 10.31557/APJCP.2024.25.4.1121. Asian Pac J Cancer Prev. 2024. PMID: 38679971 Free PMC article. Review.
-
Expression of Long Non-Coding RNA H19 in Acute Lymphoblastic Leukemia.Cell J. 2023 Jan 1;25(1):1-10. doi: 10.22074/cellj.2022.8315. Cell J. 2023. PMID: 36680478 Free PMC article.
-
The mitochondria as an emerging target of self-renewal in T-cell acute lymphoblastic leukemia.Cancer Biol Ther. 2025 Dec;26(1):2460252. doi: 10.1080/15384047.2025.2460252. Epub 2025 Feb 4. Cancer Biol Ther. 2025. PMID: 39905687 Free PMC article. Review.
-
Reactive Oxygen Species in Acute Lymphoblastic Leukaemia: Reducing Radicals to Refine Responses.Antioxidants (Basel). 2021 Oct 14;10(10):1616. doi: 10.3390/antiox10101616. Antioxidants (Basel). 2021. PMID: 34679751 Free PMC article. Review.
-
Metabolic Adaptations and Therapies in Cardiac Hypoxia: Mechanisms and Clinical Implications/ Potential Strategies.JACC Basic Transl Sci. 2025 Apr 2;10(6):862-78. doi: 10.1016/j.jacbts.2024.12.008. Online ahead of print. JACC Basic Transl Sci. 2025. PMID: 40265246 Free PMC article. Review.
References
-
- Lowe SW, Cepero E, Evan G. Intrinsic tumour suppression. Nature. 2004;432(7015):307-315. - PubMed
-
- Taylor ST, Hickman JA, Dive C. Epigenetic determinants of resistance to etoposide regulation of Bcl-X(L) and Bax by tumor microenvironmental factors. J Natl Cancer Inst. 2000;92(1):18-23. - PubMed
-
- Jin L, Tabe Y, Konoplev S, et al. . CXCR4 up-regulation by imatinib induces chronic myelogenous leukemia (CML) cell migration to bone marrow stroma and promotes survival of quiescent CML cells. Mol Cancer Ther. 2008;7(1):48-58. - PubMed
-
- Pui C-H, Robison LL, Look AT. Acute lymphoblastic leukaemia. Lancet. 2008;371(9617):1030-1043. - PubMed
Publication types
MeSH terms
Substances
LinkOut - more resources
Full Text Sources
Other Literature Sources
Medical
Miscellaneous
