

Quantification of myocardial oxygen extraction fraction: A proof-of-concept study
- PMID: 33497013
- PMCID: PMC12255441
- DOI: 10.1002/mrm.28673
Quantification of myocardial oxygen extraction fraction: A proof-of-concept study
Abstract
Purpose: To demonstrate a proof of concept for the measurement of myocardial oxygen extraction fraction (mOEF) by a cardiovascular magnetic resonance technique.
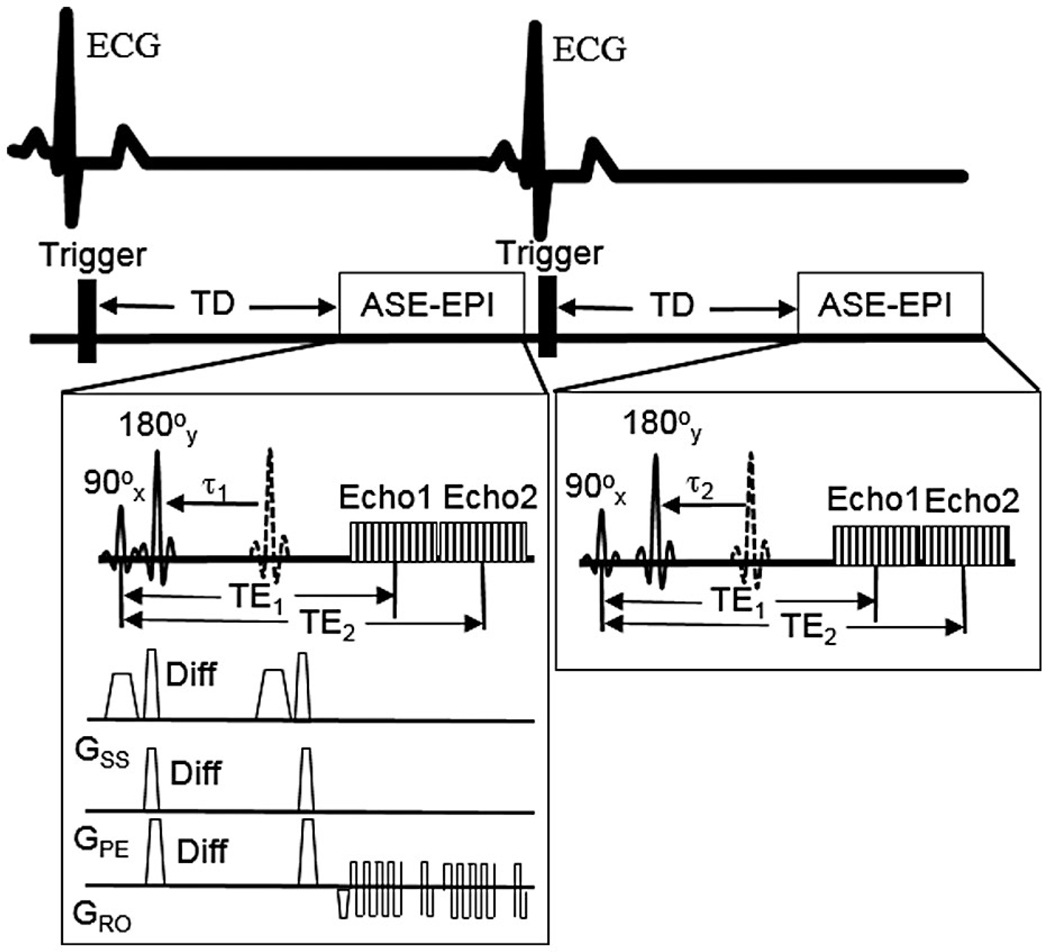
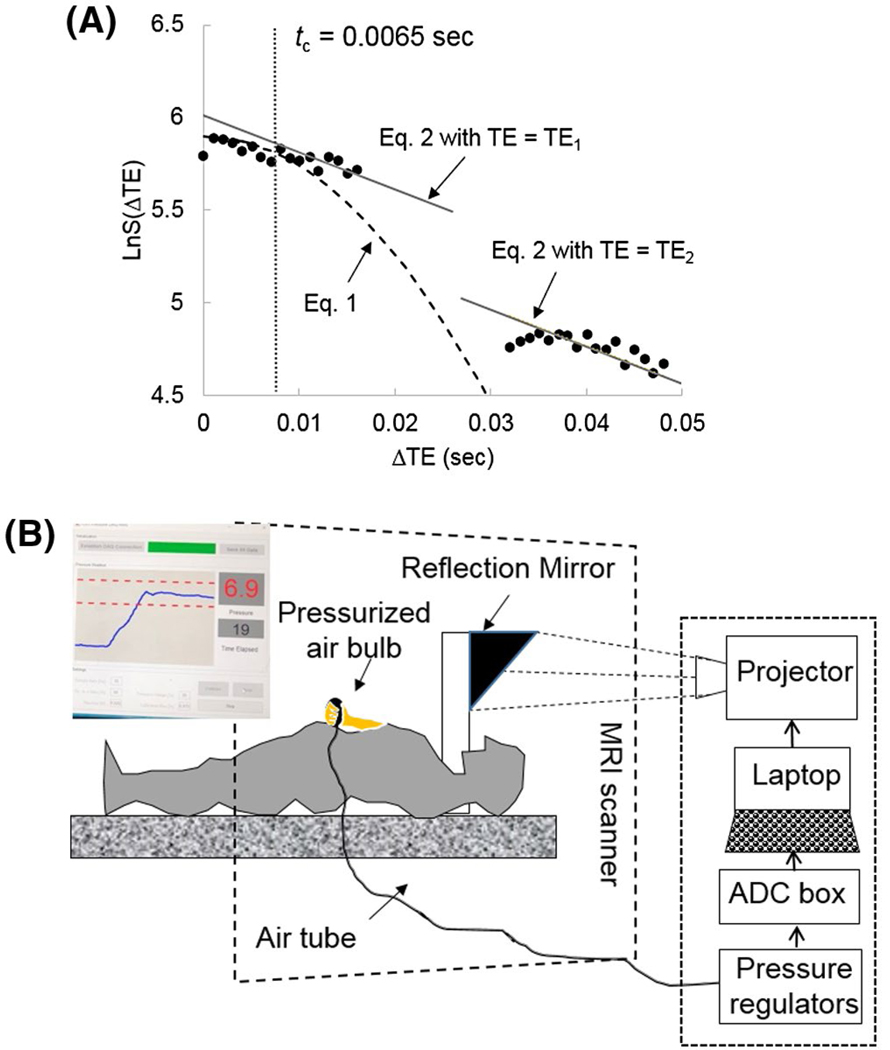
Methods: The mOEF measurement was performed using an electrocardiogram-triggered double-echo asymmetric spin-echo sequence with EPI readout. Seven healthy volunteers (22-37 years old, 5 females) were recruited and underwent the same imaging scans at rest on 2 different days for reproducibility assessment. Another 5 subjects (23-37 years old, 4 females) underwent cardiovascular magnetic resonance studies at rest and during a handgrip isometric exercise with a 25% of maximal voluntary contraction. Both mOEF and myocardial blood volume values were obtained in septal regions from respective maps.
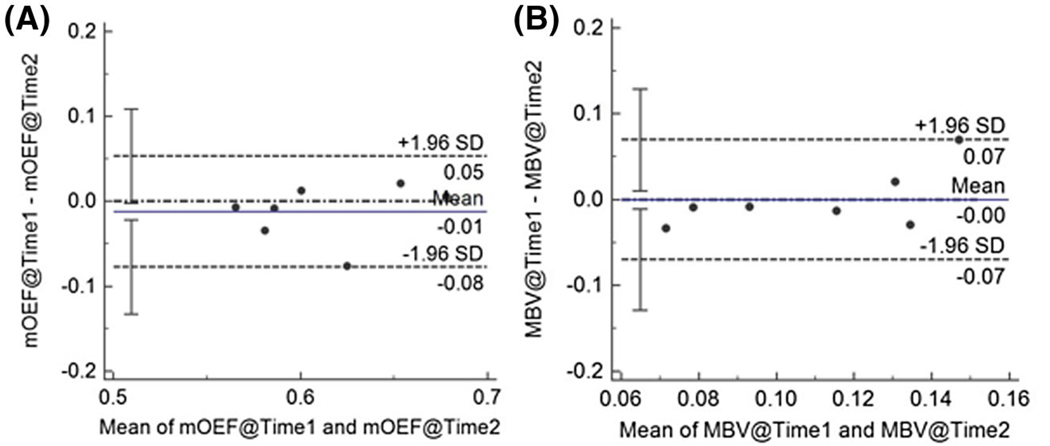
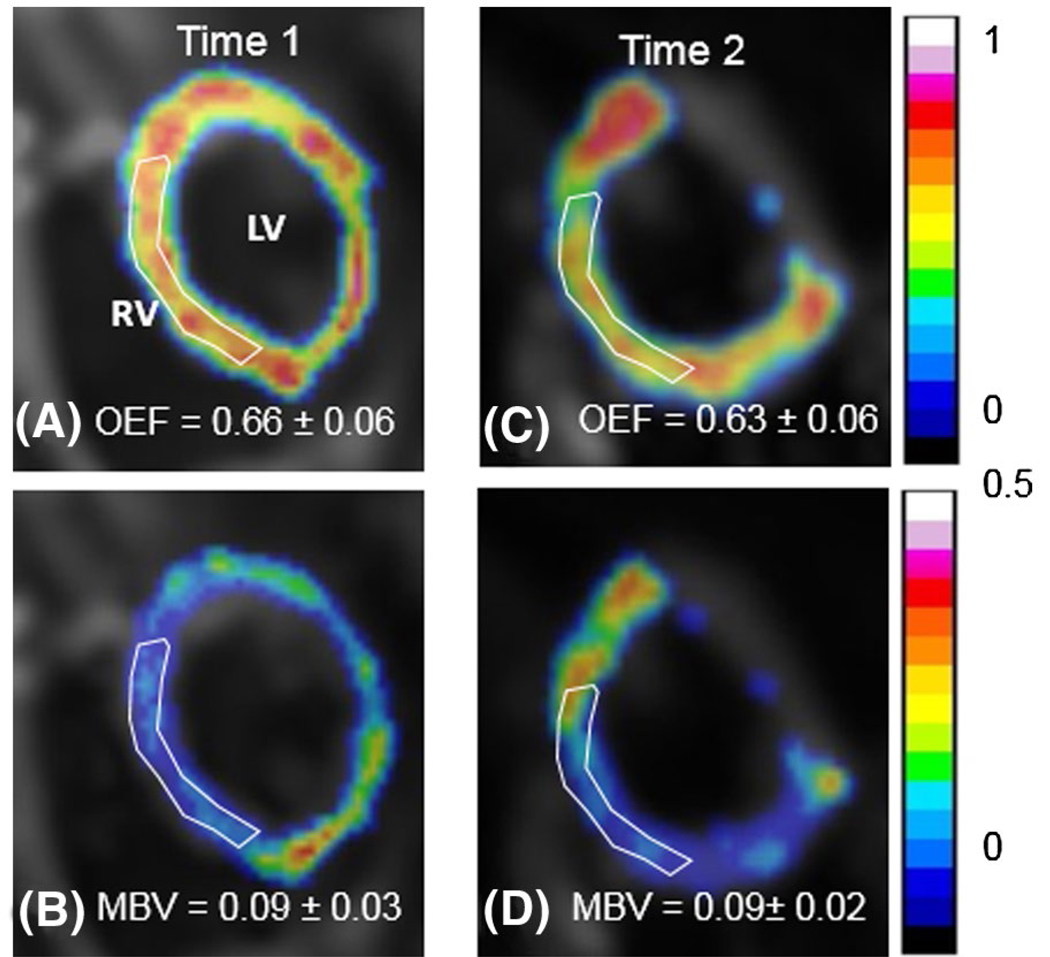
Results: The reproducibility was excellent for the measurements of mOEF in septal myocardium (coefficient of variation: 3.37%) and moderate for myocardial blood volume (coefficient of variation: 19.7%). The average mOEF and myocardial blood volume of 7 subjects at rest were 0.61 ± 0.05 and 11.0 ± 4.3%, respectively. The mOEF agreed well with literature values that were measured by PET in healthy volunteers. In the exercise study, there was no significant change in mOEF (0.61 ± 0.06 vs 0.62 ± 0.07) or myocardial blood volume (12 ± 6% vs 13 ± 4%) from rest to exercise, as expected.
Conclusion: The implemented cardiovascular magnetic resonance method shows potential for the quantitative assessment of mOEF in vivo. Future technical work is needed to improve image quality and to further validate mOEF measurements.
Keywords: cardiovascular magnetic resonance; contrast-free; handgrip exercise; myocardial blood volume; oxygen extraction fraction.
© 2021 International Society for Magnetic Resonance in Medicine.
Figures
Similar articles
-
Model-based self-supervised learning for quantitative assessment of myocardial oxygen extraction fraction and myocardial blood volume.Magn Reson Med. 2025 Oct;94(4):1793-1803. doi: 10.1002/mrm.30555. Epub 2025 May 1. Magn Reson Med. 2025. PMID: 40312974
-
Quantification of myocardial oxygen extraction fraction on noncontrast MRI enabled by deep learning.Radiol Adv. 2024 Nov;1(4):umae026. doi: 10.1093/radadv/umae026. Epub 2024 Oct 26. Radiol Adv. 2024. PMID: 40641627 Free PMC article.
-
Physical exercise training interventions for children and young adults during and after treatment for childhood cancer.Cochrane Database Syst Rev. 2013 Apr 30;(4):CD008796. doi: 10.1002/14651858.CD008796.pub2. Cochrane Database Syst Rev. 2013. Update in: Cochrane Database Syst Rev. 2016 Mar 31;3:CD008796. doi: 10.1002/14651858.CD008796.pub3. PMID: 23633361 Updated.
-
Systemic pharmacological treatments for chronic plaque psoriasis: a network meta-analysis.Cochrane Database Syst Rev. 2021 Apr 19;4(4):CD011535. doi: 10.1002/14651858.CD011535.pub4. Cochrane Database Syst Rev. 2021. Update in: Cochrane Database Syst Rev. 2022 May 23;5:CD011535. doi: 10.1002/14651858.CD011535.pub5. PMID: 33871055 Free PMC article. Updated.
-
Magnetic resonance perfusion for differentiating low-grade from high-grade gliomas at first presentation.Cochrane Database Syst Rev. 2018 Jan 22;1(1):CD011551. doi: 10.1002/14651858.CD011551.pub2. Cochrane Database Syst Rev. 2018. PMID: 29357120 Free PMC article.
Cited by
-
Neurovascular coupling is optimized to compensate for the increase in proton production from nonoxidative glycolysis and glycogenolysis during brain activation and maintain homeostasis of pH, pCO2, and pO2.J Neurochem. 2024 May;168(5):632-662. doi: 10.1111/jnc.15839. Epub 2023 Jun 21. J Neurochem. 2024. PMID: 37150946 Free PMC article.
-
Model-based self-supervised learning for quantitative assessment of myocardial oxygen extraction fraction and myocardial blood volume.Magn Reson Med. 2025 Oct;94(4):1793-1803. doi: 10.1002/mrm.30555. Epub 2025 May 1. Magn Reson Med. 2025. PMID: 40312974
-
Quantification of myocardial oxygen extraction fraction on noncontrast MRI enabled by deep learning.Radiol Adv. 2024 Nov;1(4):umae026. doi: 10.1093/radadv/umae026. Epub 2024 Oct 26. Radiol Adv. 2024. PMID: 40641627 Free PMC article.
-
From a Demand-Based to a Supply-Limited Framework of Brain Metabolism.Front Integr Neurosci. 2022 Apr 1;16:818685. doi: 10.3389/fnint.2022.818685. eCollection 2022. Front Integr Neurosci. 2022. PMID: 35431822 Free PMC article.
References
-
- Janier MF, André-Fouet X, Landais P, et al. Perfusion-MVO2 mismatch during inotropic stress in CAD patients with normal contractile function. Am J Physiol. 1996;271:H59–H67. - PubMed
-
- Agostini D, Iida H, Takahashi A, Tamura Y, Henry Amar M, Ono Y. Regional myocardial metabolic rate of oxygen measured by O2–15 inhalation and positron emission tomography in patients with cardiomyopathy. Clin Nucl Med. 2001;26:41–49. - PubMed
-
- Timmer SA, Germans T, Götte MJ, et al. Determinants of myocardial energetics and efficiency in symptomatic hypertrophic cardiomyopathy. Eur J Nucl Med Mol Imaging. 2010;37:779–788. - PubMed
-
- Güçlü A, Knaapen P, Harms HJ, et al. Disease stage-dependent changes in cardiac contractile performance and oxygen utilization underlie reduced myocardial efficiency in human inherited hypertrophic cardiomyopathy. Circ Cardiovasc Imaging. 2017;10:e005604. - PubMed
MeSH terms
Substances
Grants and funding
LinkOut - more resources
Full Text Sources
Other Literature Sources
