

Effects of antidiabetic agents on steatosis and fibrosis biomarkers in type 2 diabetes: A real-world data analysis
- PMID: 33497019
- PMCID: PMC8248247
- DOI: 10.1111/liv.14799
Effects of antidiabetic agents on steatosis and fibrosis biomarkers in type 2 diabetes: A real-world data analysis
Abstract
Background & aims: There is intense research for drugs able to reduce disease progression in nonalcoholic fatty liver disease. We aimed to test the impact of novel antidiabetic drugs (dipeptidyl-peptidase-4 inhibitors - DPP-4Is, glucagon-like peptide-1 receptor agonists - GLP-1RAs, sodium-glucose cotransporter-2 inhibitors - SGLT-2Is) on non-invasive biomarkers of steatosis (fatty liver index, FLI) and fibrosis (Fibrosis-4 score, FIB-4) in patients with type 2 diabetes (T2D).
Methods: Clinical, anthropometric and biochemical parameters were retrospectively analysed in 637 consecutive T2D patients switched from metformin w/wo sulfonylureas and/or pioglitazone to DPP-4Is, GLP-1RAs and SGLT-2Is in a tertiary care setting. 165 patients maintained on original treatments served as controls. The effects on FLI and FIB-4 at 6- and 12-month follow-up were analysed by logistic regression after adjustment for baseline differences, computed by propensity scores, and additional adjustment for changes in glycosylated hemoglobin (HbA1c) and body mass index.
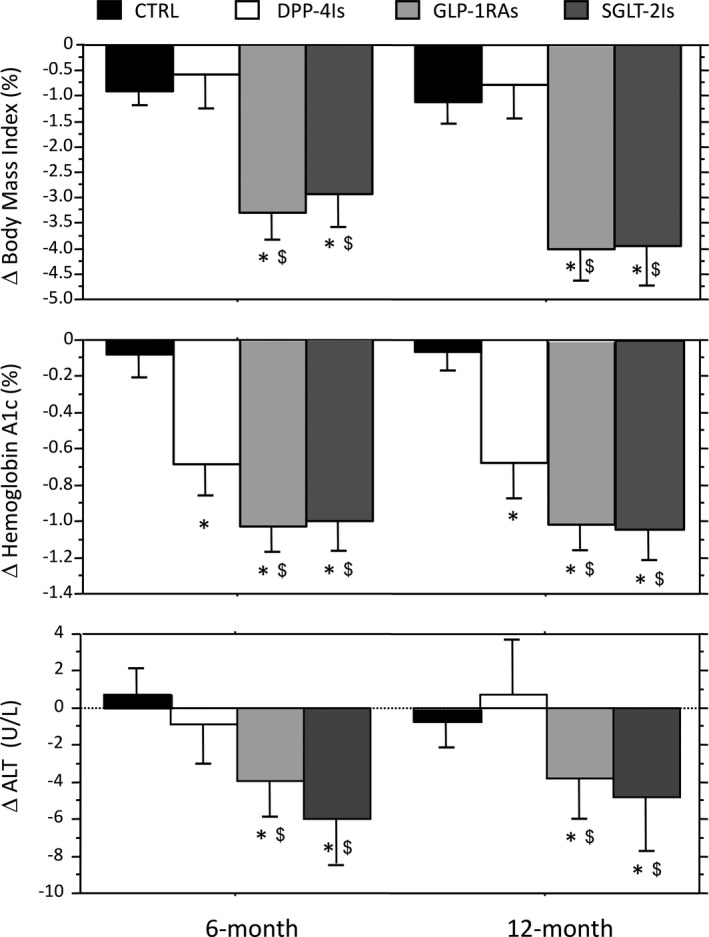
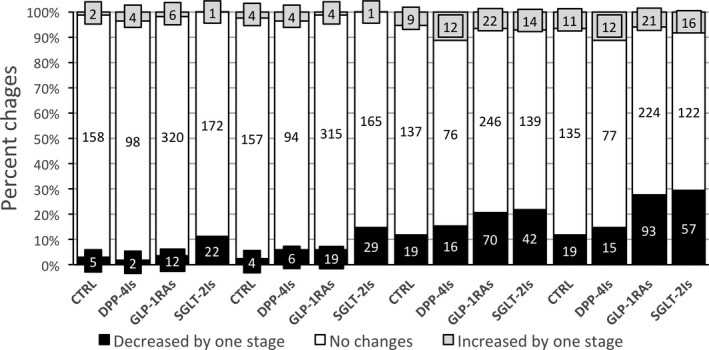
Results: Body mass index, HbA1c and aminotrasferases significantly decreased following switching to GLP-1RAs and SGLT2-Is, compared with both controls and DPP-4Is, whereas only HbA1c was reduced on DPP-4Is. FLI and FIB-4 were reduced on GLP-1RA and SGLT-2I; logistic regression analysis confirmed a significant improvement of both biomarkers after adjustment for propensity score. The shift of FIB-4 values towards the category ruling out advanced fibrosis was maintained after additional adjustment for confounders. These effects were confirmed in a sensitivity analysis on effect size.
Conclusions: Glucagon-like peptide-1 receptor agonists and SGLT-2Is improve biomarkers of steatosis and fibrosis, in keeping with beneficial effects on liver disease progression, and should be considered the treatment of choice in T2D.
Keywords: NAFLD; dipeptidyl-peptidase-4 inhibitors; glucagon like peptide-1 receptor agonists; sodium-glucose cotransporter-2 inhibitors; surrogate biomarkers.
© 2021 The Authors. Liver International published by John Wiley & Sons Ltd.
Conflict of interest statement
SC, FR, LB, FM, ASS and LP declare no conflicts of interest in relation to the material presented in the study; FAB received honoraria for conference from MSD and Astra‐Zeneca, MLL received honoraria for conference from Novo Nordisk; GM participated in NAFLD advisory boards of Astra‐Zeneca, Pfizer, Gilead, Novartis, and received honoraria for conference from Eli Lilly.
Figures


References
-
- Marchesini G, Brizi M, Bianchi G, et al. Nonalcoholic fatty liver disease: a feature of the metabolic syndrome. Diabetes. 2001;50:1844‐1850. - PubMed
-
- Younossi Z, Anstee QM, Marietti M, et al. Global burden of NAFLD and NASH: trends, predictions, risk factors and prevention. Nat Rev Gastroenterol Hepatol. 2018;15:11‐20. - PubMed
-
- Harris R, Card TR, Delahooke T, Aithal GP, Guha IN. Obesity is the most common risk factor for chronic liver disease: results from a risk stratification pathway using transient elastography. Am J Gastroenterol. 2019;114:1744‐1752. - PubMed
-
- Younossi ZM, Golabi P, de Avila L, et al. The global epidemiology of NAFLD and NASH in patients with type 2 diabetes: a systematic review and meta‐analysis. J Hepatol. 2019;71:793‐801. - PubMed
-
- European Association for the Study of the Liver, European Association for the Study of Diabetes, European Association for the Study of Obesity . EASL‐EASD‐EASO clinical practice guidelines for the management of non‐alcoholic fatty liver disease. J Hepatol. 2016;64:1388‐1402. - PubMed
Publication types
MeSH terms
Substances
LinkOut - more resources
Full Text Sources
Other Literature Sources
Medical
