. 2021 Apr;299(1):E177-E186.
doi: 10.1148/radiol.2021203153. Epub 2021 Jan 26.

Six-month Follow-up Chest CT Findings after Severe COVID-19 Pneumonia

Affiliations

Six-month Follow-up Chest CT Findings after Severe COVID-19 Pneumonia

Xiaoyu Han et al. Radiology. 2021 Apr.

Abstract

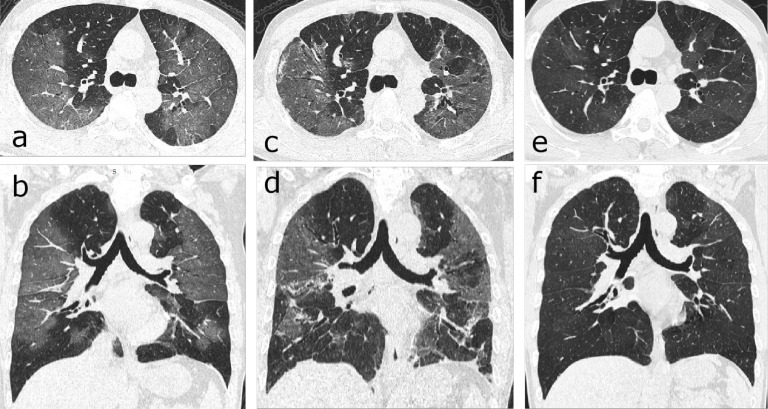
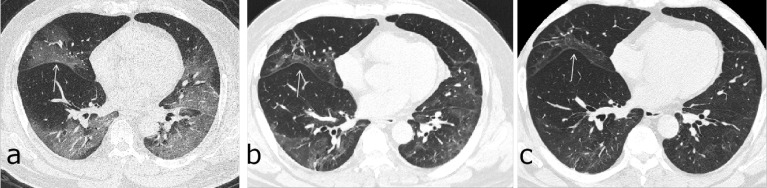
Background Little is known about the long-term lung radiographic changes in patients who have recovered from coronavirus disease 2019 (COVID-19), especially those with severe disease. Purpose To prospectively assess pulmonary sequelae and explore the risk factors for fibrotic-like changes in the lung at 6-month follow-up chest CT of survivors of severe COVID-19 pneumonia. Materials and Methods A total of 114 patients (80 [70%] men; mean age, 54 years ± 12) were studied prospectively. Initial and follow-up CT scans were obtained a mean of 17 days ± 11 and 175 days ± 20, respectively, after symptom onset. Lung changes (opacification, consolidation, reticulation, and fibrotic-like changes) and CT extent scores (score per lobe, 0-5; maximum score, 25) were recorded. Participants were divided into two groups on the basis of their 6-month follow-up CT scan: those with CT evidence of fibrotic-like changes (traction bronchiectasis, parenchymal bands, and/or honeycombing) (group 1) and those without CT evidence of fibrotic-like changes (group 2). Between-group differences were assessed with the Fisher exact test, two-sample t test, or Mann-Whitney U test. Multiple logistic regression analyses were performed to identify the independent predictive factors of fibrotic-like changes. Results At follow-up CT, evidence of fibrotic-like changes was observed in 40 of the 114 participants (35%) (group 1), whereas the remaining 74 participants (65%) showed either complete radiologic resolution (43 of 114, 38%) or residual ground-glass opacification or interstitial thickening (31 of 114, 27%) (group 2). Multivariable analysis identified age of greater than 50 years (odds ratio [OR]: 8.5; 95% CI: 1.9, 38; P = .01), heart rate greater than 100 beats per minute at admission (OR: 5.6; 95% CI: 1.1, 29; P = .04), duration of hospital stay greater than or equal to 17 days (OR: 5.5; 95% CI: 1.5, 21; P = .01), acute respiratory distress syndrome (OR: 13; 95% CI: 3.3, 55; P < .001), noninvasive mechanical ventilation (OR: 6.3; 95% CI: 1.3, 30; P = .02), and total CT score of 18 or more (OR: 4.2; 95% CI: 1.2, 14; P = .02) at initial CT as independent predictors for fibrotic-like changes in the lung at 6 months. Conclusion Six-month follow-up CT showed fibrotic-like changes in the lung in more than one-third of patients who survived severe coronavirus disease 2019 pneumonia. These changes were associated with an older age, acute respiratory distress syndrome, longer hospital stays, tachycardia, noninvasive mechanical ventilation, and higher initial chest CT score. © RSNA, 2021 Online supplemental material is available for this article. See also the editorial by Wells et al in this issue.


Figures

Participant flow diagram.
Figure 1:
Participant flow diagram.
Chest follow-up CT findings of COVID-19 pneumonia: (a) traction bronchiectasis; (b) parenchymal bands; (c) honeycombing; (d, e) thickening of the adjacent pleura.
Figure 2:
Chest follow-up CT findings of COVID-19 pneumonia: (a) traction bronchiectasis; (b) parenchymal bands; (c) honeycombing; (d, e) thickening of the adjacent pleura.
Serial CT scans of a 46-year-old woman with severe COVID-19 pneumonia. (a-c) The scan obtained on day 32 after symptom onset showed multiple ground-glass opacities (GGOs) and interstitial thickening with mild cylindrical traction bronchiectasis involving the middle lobe and lower lobe of the right lung. (d-f) The scan obtained on day 198 showed partial absorption of the abnormalities, reduced extension, traction bronchiectasis (thin arrows) and localized “honeycombing” (thick arrow) in the subpleural region of the right middle lobe.
Figure 3:
Serial CT scans of a 46-year-old woman with severe COVID-19 pneumonia. (a-c) The scan obtained on day 32 after symptom onset showed multiple ground-glass opacities (GGOs) and interstitial thickening with mild cylindrical traction bronchiectasis involving the middle lobe and lower lobe of the right lung. (d-f) The scan obtained on day 198 showed partial absorption of the abnormalities, reduced extension, traction bronchiectasis (thin arrows) and localized “honeycombing” (thick arrow) in the subpleural region of the right middle lobe.
Serial CT scans of a 63-year-old man with emphysema and severe COVID-19 pneumonia. (a) The axial CT scan obtained on day 27 after onset of symptoms showed multiple ground-glass opacities (GGO) in the subpleural right lung. (b) The scan obtained on day 72 showed obvious absorption of the abnormalities. (c) The scan obtained on day 164 showed complete resolution.
Figure 4:
Serial CT scans of a 63-year-old man with emphysema and severe COVID-19 pneumonia. (a) The axial CT scan obtained on day 27 after onset of symptoms showed multiple ground-glass opacities (GGO) in the subpleural right lung. (b) The scan obtained on day 72 showed obvious absorption of the abnormalities. (c) The scan obtained on day 164 showed complete resolution.
Serial CT scans of a 57-year-old man with severe COVID-19 pneumonia. (a, b) Axial and coronal thin-section CT scans obtained on day 9 after the onset of symptoms showed extensive ground-glass opacities (GGO) and interstitial thickening bilaterally. (c, d) Scans obtained on day 46 showed evolution to a mixed pattern of ground-glass opacities and consolidation with almost the same extent of lesions. (e, f) Scans obtained on day 159 showed a marked decrease in the density of GGO, with a slightly increased extension of the GGO (“tinted” sign or “melting sugar” sign, which defined as an imaging appearance of increased extension of the GGO or consolidation and decreased density).
Figure 5:
Serial CT scans of a 57-year-old man with severe COVID-19 pneumonia. (a, b) Axial and coronal thin-section CT scans obtained on day 9 after the onset of symptoms showed extensive ground-glass opacities (GGO) and interstitial thickening bilaterally. (c, d) Scans obtained on day 46 showed evolution to a mixed pattern of ground-glass opacities and consolidation with almost the same extent of lesions. (e, f) Scans obtained on day 159 showed a marked decrease in the density of GGO, with a slightly increased extension of the GGO (“tinted” sign or “melting sugar” sign, which defined as an imaging appearance of increased extension of the GGO or consolidation and decreased density).
Serial CT scans of a 52-year-old man with severe COVID-19 pneumonia. (a) The axial thin-section CT scan obtained on day 8 after symptom onset showed multiple ground-glass opacities (GGOs) bilaterally, with a slight traction of the right interlobar pleural (arrow). (b, c) Scans obtained on days 79 and 149, respectively, showed continuous absorption of previous opacifications, with the progression of interlobar pleural traction.
Figure 6:
Serial CT scans of a 52-year-old man with severe COVID-19 pneumonia. (a) The axial thin-section CT scan obtained on day 8 after symptom onset showed multiple ground-glass opacities (GGOs) bilaterally, with a slight traction of the right interlobar pleural (arrow). (b, c) Scans obtained on days 79 and 149, respectively, showed continuous absorption of previous opacifications, with the progression of interlobar pleural traction.

Comment in

References

    1. World Health Organization . Coronavirus disease 2019 (COVID-19) Situation report. https://covid19.who.int/. (Accessed 19 November 2020) - PubMed
    1. Xu Z, Shi L, Wang Y, Zhang J, Huang L, Zhang C, Liu S, Zhao P, Liu H, Zhu L, Tai Y, Bai C, Gao T, Song J, Xia P, Dong J, Zhao J, Wang F-S. Pathological findings of COVID-19 associated with acute respiratory distress syndrome. The Lancet Respiratory Medicine 2020;8(4):420-422. doi: 10.1016/s2213-2600(20)30076-x - PMC - PubMed
    1. Liu J, Zheng X, Tong Q, Li W, Wang B, Sutter K, Trilling M, Lu M, Dittmer U, Yang D. Overlapping and discrete aspects of the pathology and pathogenesis of the emerging human pathogenic coronaviruses SARS-CoV, MERS-CoV, and 2019-nCoV. J Med Virol 2020;92(5):491-494. doi: 10.1002/jmv.25709 - PMC - PubMed
    1. Shi H, Han X, Jiang N, Cao Y, Alwalid O, Gu J, Fan Y, Zheng C. Radiological findings from 81 patients with COVID-19 pneumonia in Wuhan, China: a descriptive study. The Lancet Infectious Diseases 2020;20(4):425-434. doi: 10.1016/s1473-3099(20)30086-4 - PMC - PubMed
    1. Pan F, Ye T, Sun P, Gui S, Liang B, Li L, Zheng D, Wang J, Hesketh RL, Yang L, Zheng C. Time Course of Lung Changes at Chest CT during Recovery from Coronavirus Disease 2019 (COVID-19). Radiology 2020;295(3):715-721. doi: 10.1148/radiol.2020200370 - PMC - PubMed