. 2021 Mar 15;131(6):e129433.
doi: 10.1172/JCI129433.

17β-Estradiol and estrogen receptor α protect right ventricular function in pulmonary hypertension via BMPR2 and apelin

Affiliations

17β-Estradiol and estrogen receptor α protect right ventricular function in pulmonary hypertension via BMPR2 and apelin

Andrea L Frump et al. J Clin Invest. .

Abstract

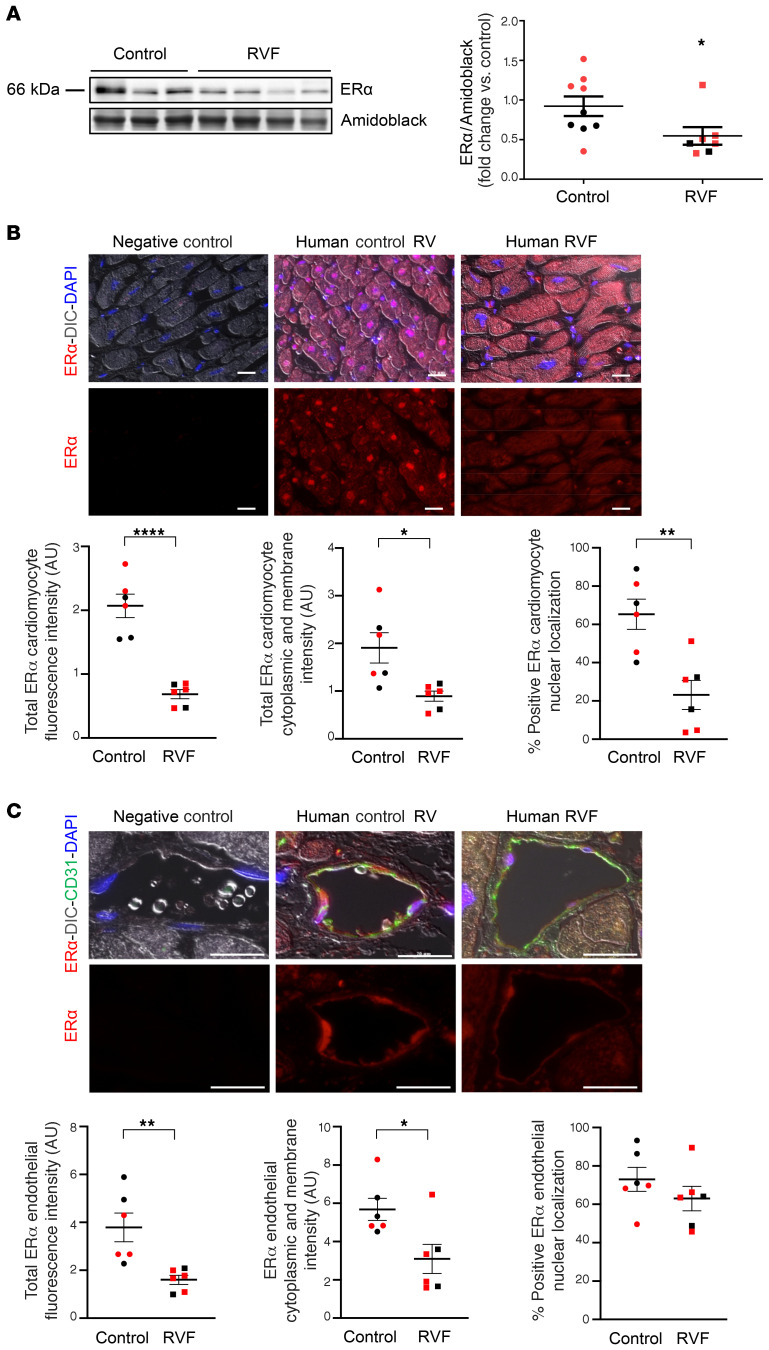
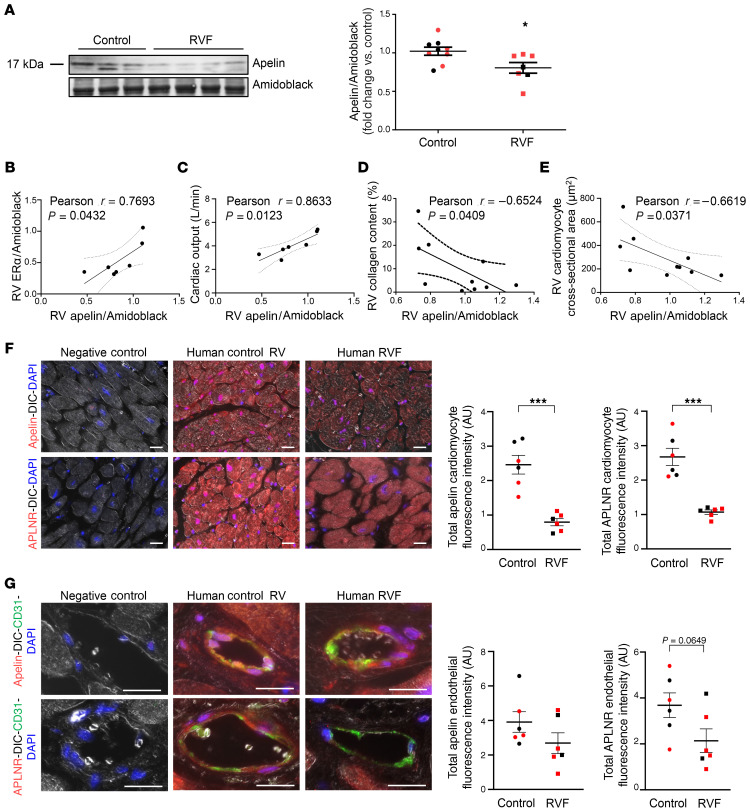
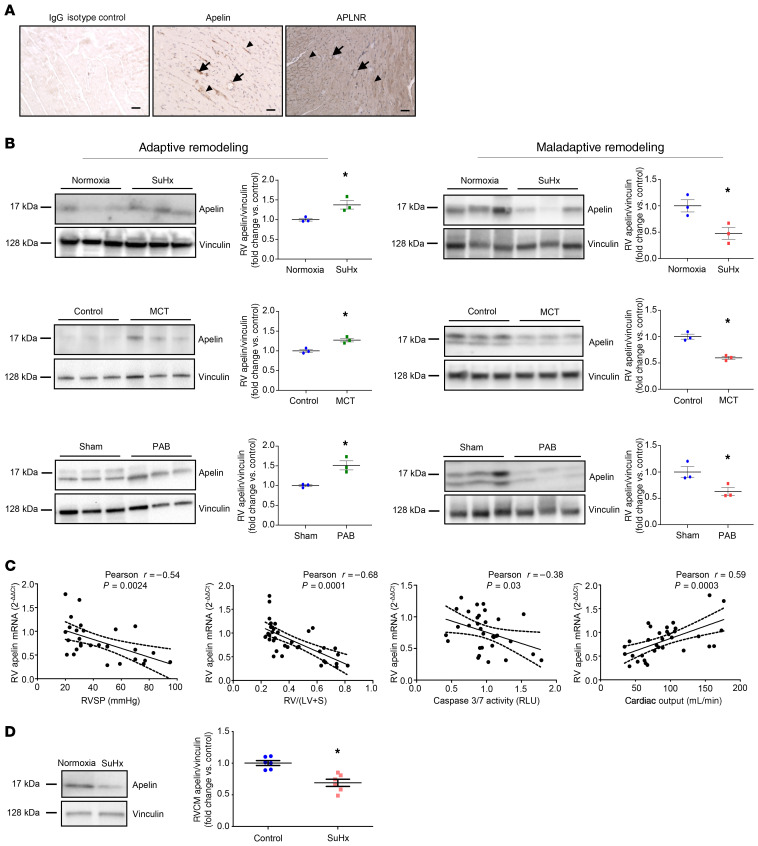
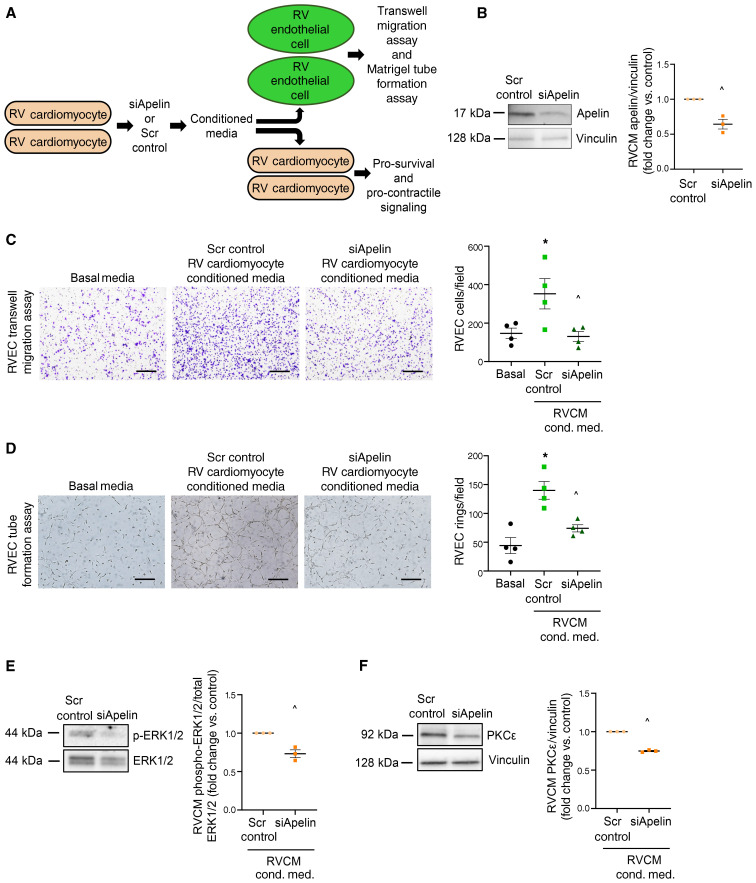
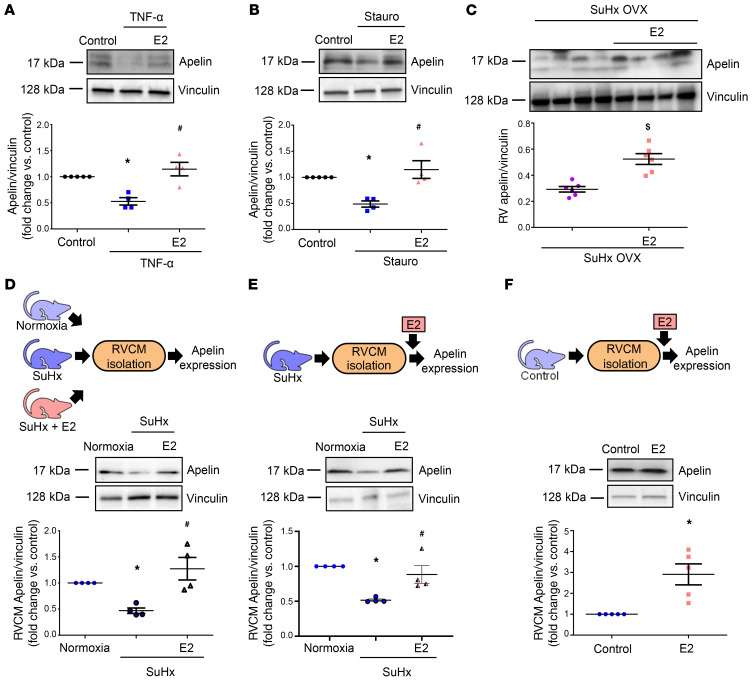
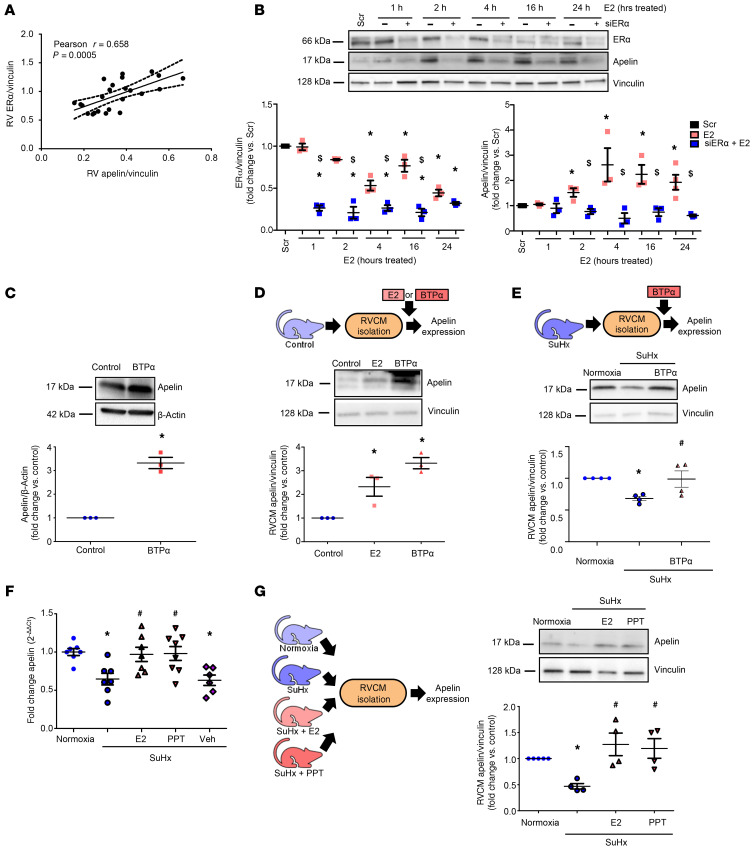
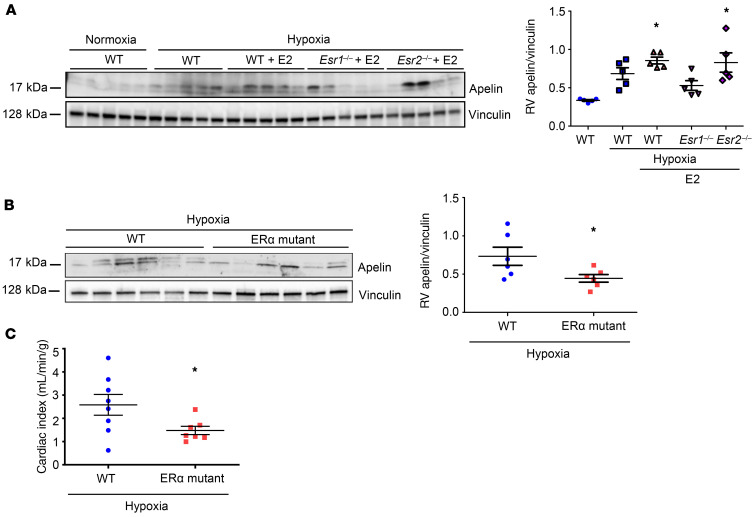
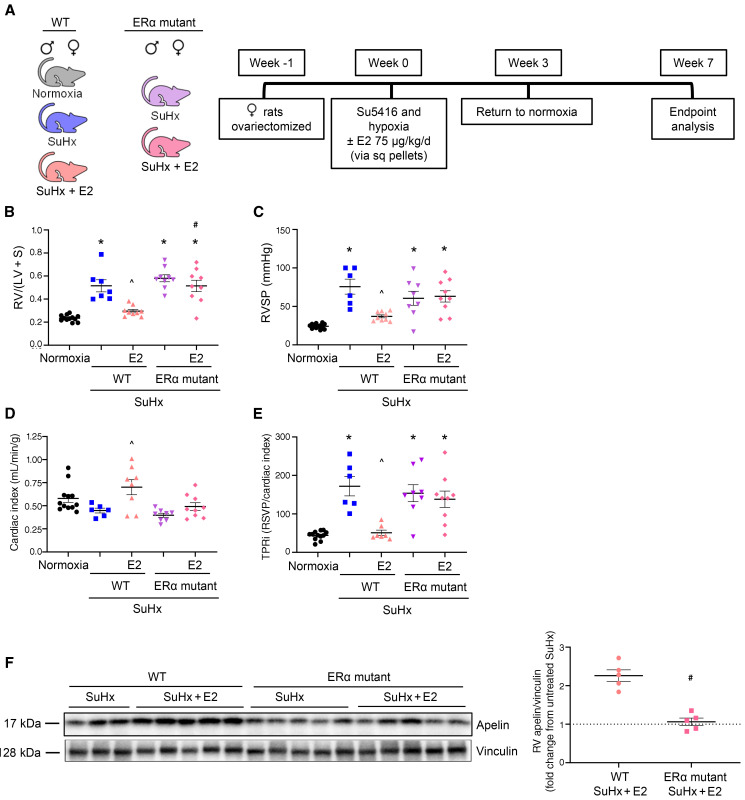
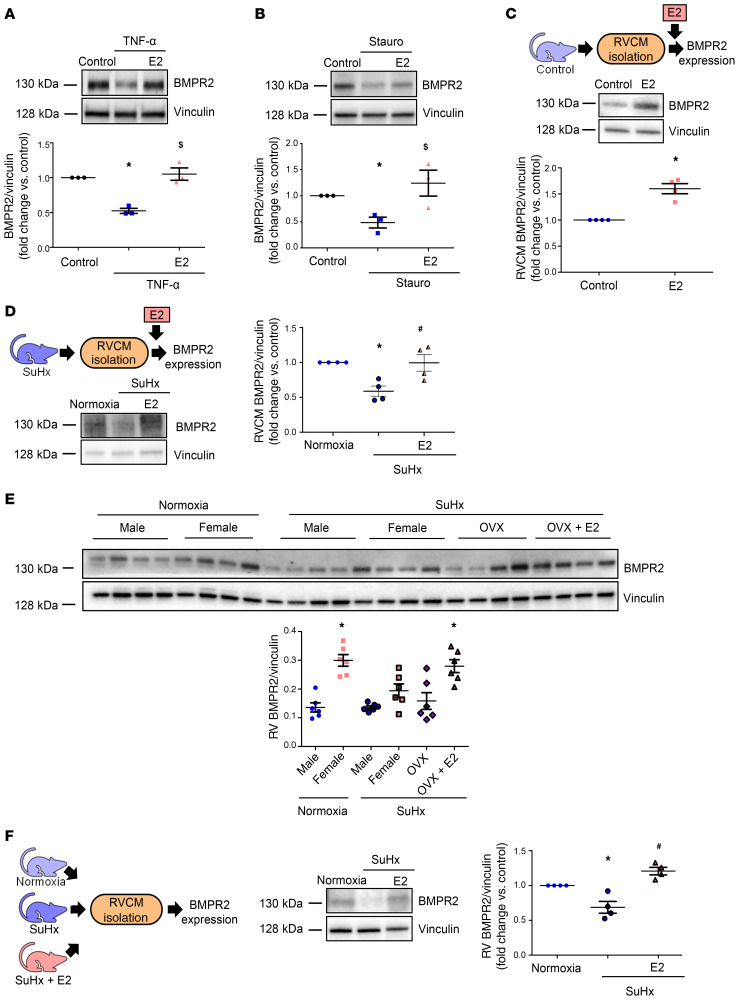
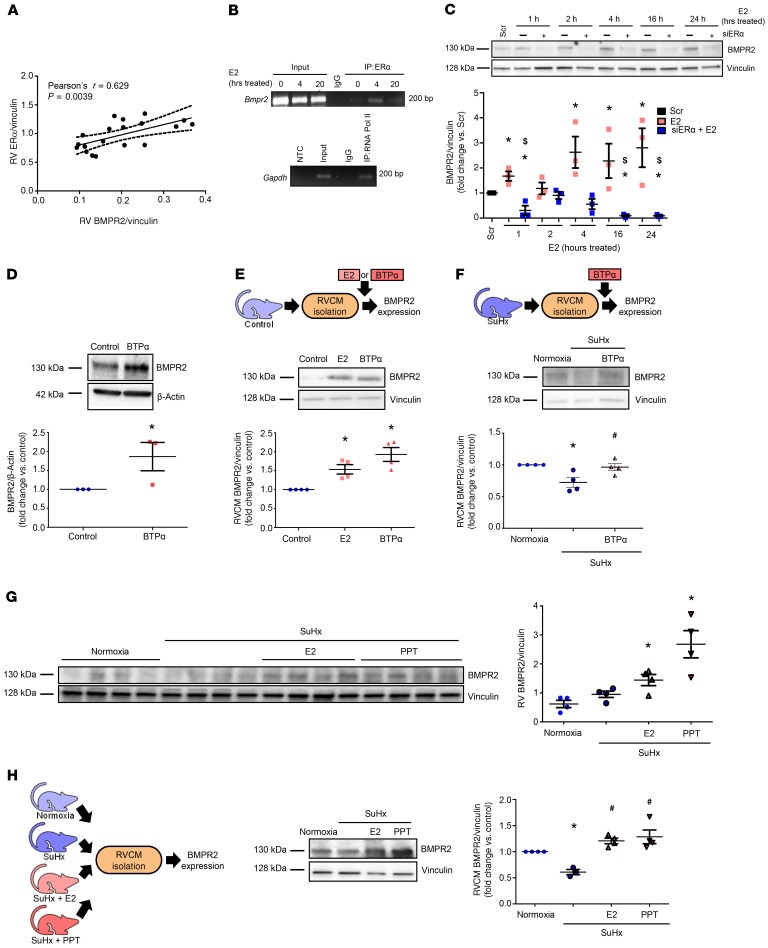
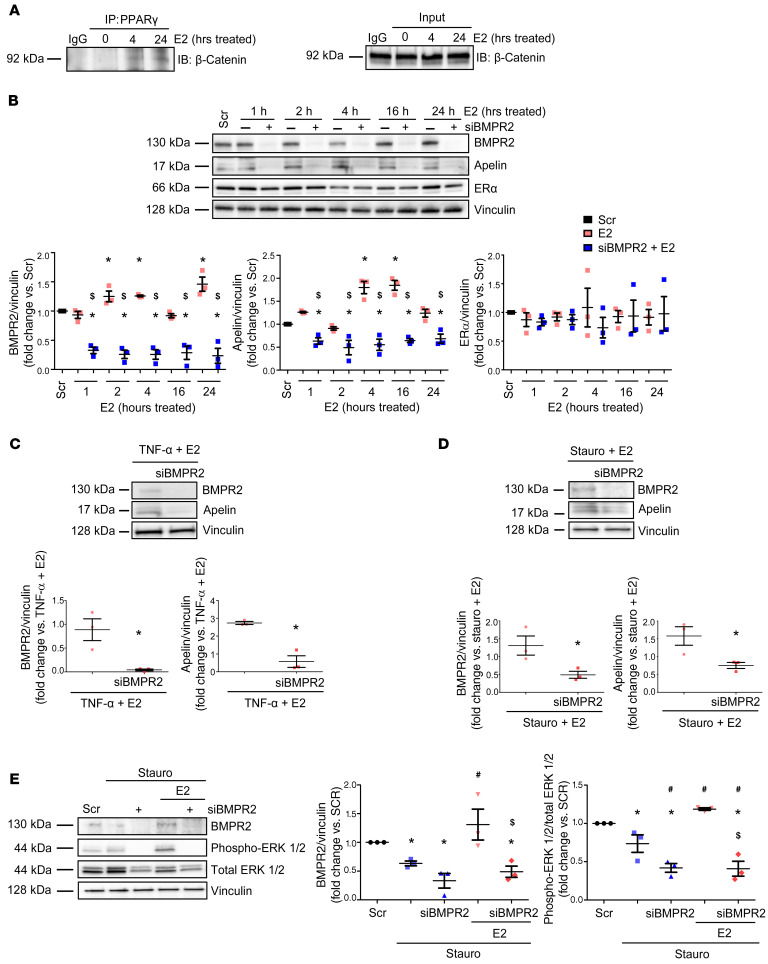
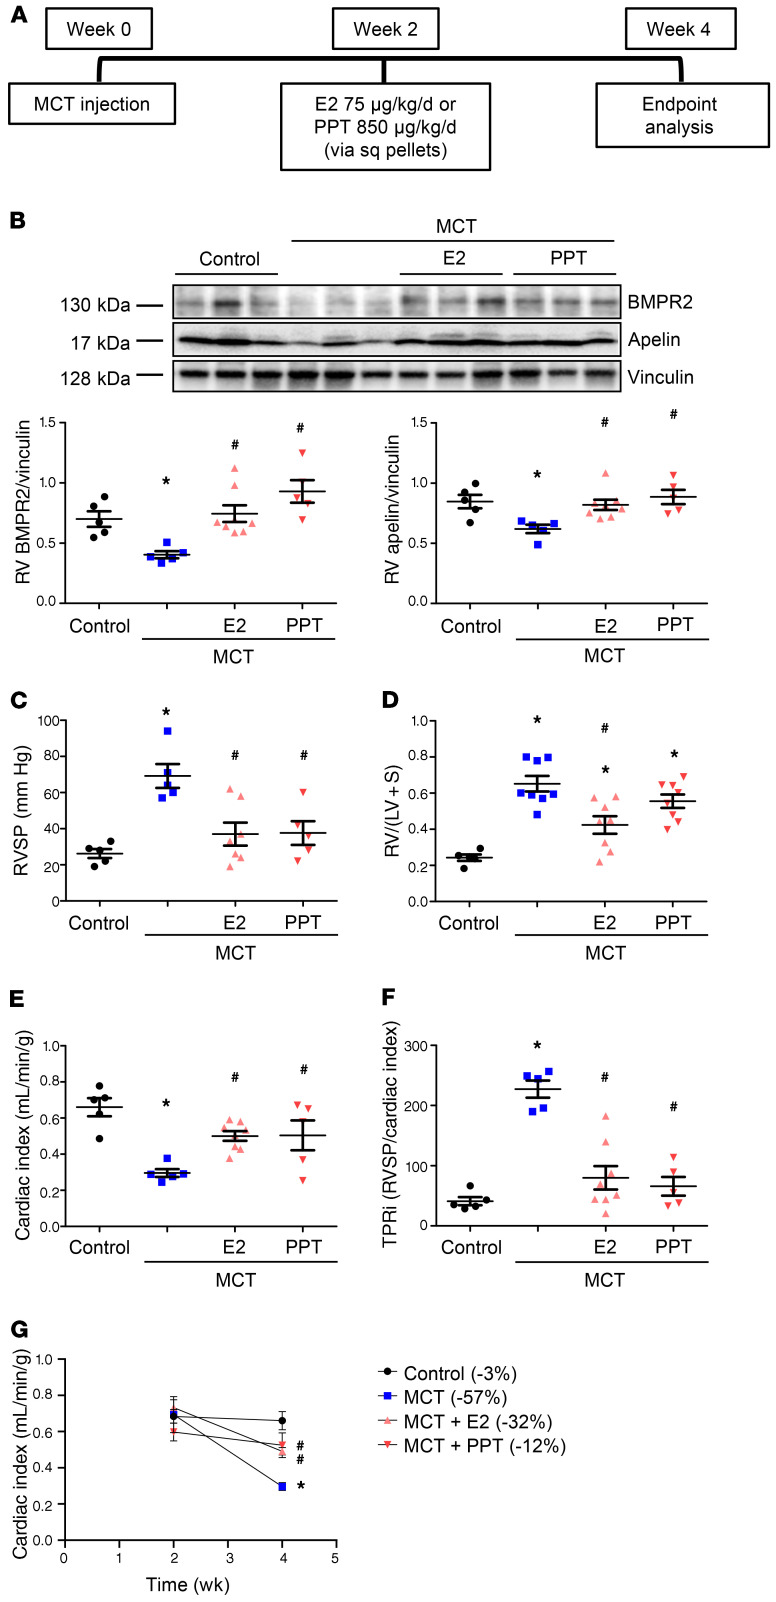
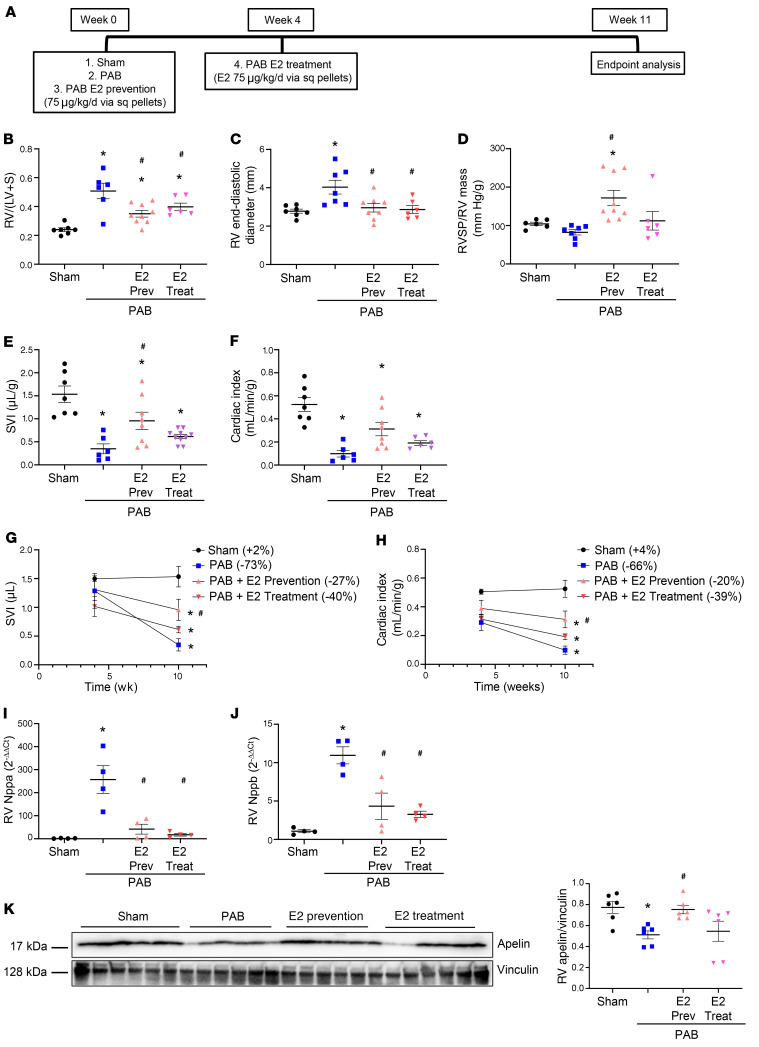
Women with pulmonary arterial hypertension (PAH) exhibit better right ventricular (RV) function and survival than men; however, the underlying mechanisms are unknown. We hypothesized that 17β-estradiol (E2), through estrogen receptor α (ER-α), attenuates PAH-induced RV failure (RVF) by upregulating the procontractile and prosurvival peptide apelin via a BMPR2-dependent mechanism. We found that ER-α and apelin expression were decreased in RV homogenates from patients with RVF and from rats with maladaptive (but not adaptive) RV remodeling. RV cardiomyocyte apelin abundance increased in vivo or in vitro after treatment with E2 or ER-α agonist. Studies employing ER-α-null or ER-β-null mice, ER-α loss-of-function mutant rats, or siRNA demonstrated that ER-α is necessary for E2 to upregulate RV apelin. E2 and ER-α increased BMPR2 in pulmonary hypertension RVs and in isolated RV cardiomyocytes, associated with ER-α binding to the Bmpr2 promoter. BMPR2 is required for E2-mediated increases in apelin abundance, and both BMPR2 and apelin are necessary for E2 to exert RV-protective effects. E2 or ER-α agonist rescued monocrotaline pulmonary hypertension and restored RV apelin and BMPR2. We identified what we believe to be a novel cardioprotective E2/ER-α/BMPR2/apelin axis in the RV. Harnessing this axis may lead to novel RV-targeted therapies for PAH patients of either sex.

Keywords: Heart failure; Molecular biology; Pulmonology; Sex hormones; Vascular Biology.


Conflict of interest statement

Conflict of interest: ALF’s institution received research funding from Actelion. SB served on advisory boards for Actelion, Janssen, and Resverlogix. TL has received consultancy fees from Bayer and Altavant Sciences and was the site principal investigator for a clinical trial funded by Complexa.

Figures

Figure 1
Figure 1. ER-α localizes to cardiomyocytes and endothelial cells in the human RV and is less abundant in patients with RV failure.
(A) ER-α expression in human RV measured by Western blot. Quantification by densitometry shown on right. (B) Representative immunohistochemistry images of RV cardiomyocyte ER-α expression and localization in human control RVs and RVs from patients with RV failure (RVF). Cardiomyocyte localization was established by differential interference contrast (DIC). Quantification of total ER-α fluorescence intensity, cytoplasmic and membrane fluorescence intensity (measured in AU), and nuclear localization (colocalization with DAPI) is shown in graphs. Images are at 20× magnification; scale bar: 20 μm. (C) Representative immunocytochemistry images of ER-α expression and localization in RV endothelial cells in human control RVs and RVs from patients with RVF. Endothelial cell localization was established by colocalization with CD31. Total ER-α fluorescence intensity, cytoplasmic and membrane fluorescence intensity, and nuclear localization (colocalization with DAPI) are quantified in graphs. Images are at 40×, scale bars: 20 μm. Red and black symbols in graphs represent samples from female and male patients, respectively. Error bars represent mean ± SEM. *P < 0.05, **P < 0.01, ****P < 0.0001 versus control by Student’s t test.
Figure 2
Figure 2. RV cardiomyocyte apelin and apelin receptor (APLNR) expression are decreased in patients with RV failure.
(A) Apelin expression in human RV tissue measured by Western blot. Quantification by densitometry shown on right. (BE) Apelin expression correlates positively with ER-α protein (B) and cardiac output (C) in RVs from patients with RV failure (RVF) and negatively with RV collagen content (D; expressed as percentage of RV cross-section) and RV cardiomyocyte size (E; measured as cardiomyocyte cross-sectional area [CSA]) in human control RVs and RVs from RVF patients. Cardiac output data was available for RVF patients only. RV collagen content and RV cardiomyocyte size were analyzed in a randomly selected subgroup of control subjects. (F) Representative immunohistochemistry images of cardiomyocyte apelin and APLNR expression in human control RVs and RVs from patients with RVF. Cardiomyocyte localization was established by differential interference contrast (DIC). Cardiomyocyte apelin or APLNR fluorescence intensity is quantified in graphs. Images are at 20× magnification; scale bars: 20 μm. (G) Representative immunocytochemistry images of endothelial cell apelin and APLNR expression and localization in human control RVs and RVs from patients with RVF. Endothelial cell localization was established by colocalization with CD31. Apelin or APLNR fluorescence intensity is quantified in graphs. Images are at 40×, scale bars: 20 μm. Red and black symbols in graphs represent female and male samples, respectively. (A, F, and G) *P < 0.05, ***P < 0.001 versus control by Student’s t test. Error bars represent mean ± SEM. (BE) Pearson’s R value and P value shown. Dashed lines represent 95% CI.
Figure 3
Figure 3. RV apelin expression is decreased in maladaptive (but not adaptive) RV hypertrophy and correlates negatively with markers of worsening RV function.
(A) Apelin and APLNR are expressed in the RV. Apelin (middle image) and APLNR (right image) stained by immunohistochemistry in the RV of a male Sprague-Dawley rat. Both apelin and APLNR are expressed in coronary endothelial cells (arrows) as well as cardiomyocytes (arrowheads). Images are 10×; scale bars: 50 μm. (B) Apelin expression by Western blot and quantified via densitometric analyses in RVs from rats with adaptive remodeling (characterized by preserved cardiac output; left panel) or maladaptive remodeling (characterized by reduced cardiac output; right panel) employing rats with SuHx-PH, monocrotaline-induced PH (MCT), or pulmonary artery banding (PAB). Note decrease in apelin in maladaptive but not adaptive RV hypertrophy. n = 3 male rats/group. (C) Apelin mRNA correlates negatively with RV systolic pressure (RVSP), RV hypertrophy [RV weight divided by weight of left ventricle + septum; RV/(LV + S)], and proapoptotic signaling (caspase-3/7 activity; in relative light units [RLU]), but positively with cardiac output in male and female control rats and rats with SuHx-PH (hemodynamics described in ref. 14). (D) Apelin expression in RV cardiomyocytes (RVCMs) isolated from normoxia control or SuHx-PH male and female rats. A representative Western blot is shown on the left; densitometry is shown on the right. *P < 0.05 by Student’s t test in B and D. Error bars in B and D represent mean ± SEM; each data point represents 1 animal. Correlation analyses in C performed by determining Pearson’s correlation coefficient (R) and 2-tailed P value. Dashed lines represent 95% CI.
Figure 4
Figure 4. RV cardiomyocyte apelin exerts paracrine effects on RV endothelial cell and RVCM function.
(A) RVCMs were transfected with siRNA directed against apelin (siApelin) or scrambled control (Scr control). 24 hours later, conditioned media was collected from RVCMs and added to naive RVECs or RVCMs. RVEC function and RVCM mediators of prosurvival and procontractile signaling were then assessed. (B) Validation of apelin siRNA knockdown in RVCMs. Scrambled siRNA oligo served as control. n = 3 male rats. (C) Transwell migration assay in RVECs treated with RVCM conditioned media after treatment with siApelin or scrambled control. EBM2 media served as baseline control. Fifteen fields per condition were quantified 16 hours after conditioned media was added. Representative Transwell migration assay images are shown, with quantification on the right. Images are at 10× magnification, scale bars: 250 μm. n = RVECs from 4 male rats, performed in technical triplicate. (D) Tube formation assay in RVECs treated with RVCM conditioned media after treatment with siApelin or scrambled control. EBM2 media served as baseline control. Cells plated at a density of 5 × 10⁴ in technical triplicate. Images taken at 10× magnification; scale bars: 250 μm. Rings quantified using 15 fields per condition. Representative images are shown, with quantification of ring formation depicted on the right. n = RVECs from 4 male rats (in technical triplicate). (E and F) Quantification of ERK1/2 activation and PKC-ε expression in RVCMs treated with RVCM conditioned media after treatment with siApelin or scrambled control. Representative Western blot images are shown, with quantification by densitometry depicted on the right. n = RVCMs from 3 male rats. *P < 0.05 versus basal media control, ^P < 0.05 versus Scr control by (C and D) 1-way ANOVA with post hoc Tukey’s correction or (E and F) by Student’s t test. Error bars represent mean ± SEM; each data point represents cells from 1 animal.
Figure 5
Figure 5. 17β-estradiol increases apelin expression in stressed cardiomyoblasts, in the failing RV, and in isolated RV cardiomyocytes.
(A and B) H9c2 rat cardiomyoblasts were pretreated with E2 (100 nM, 24 hours) and then stressed with TNF-α (10 ng/ml, 8 hours; A) or staurosporine (stauro; 50 nM, 4 hours; B). (C) RVs from female SuHx OVX (ovariectomized SuHx-PH females) or SuHx OVX + E2 (ovariectomized SuHx-PH females replete with E2 75 μg/kg/day via s.c. pellets) analyzed for apelin expression by Western blot. (D) Apelin expression evaluated by Western blot in RVCMs isolated from male normoxia control, untreated SuHx-PH, and SuHx-PH rats treated with E2 (75 μg/kg/day; s.c. pellets) in vivo. (E) Western blot analysis of apelin expression in RVCMs isolated from male and female SuHx-PH rats and treated exogenously with E2 (10 nM, 24 hours). (F) Western blot analysis of apelin expression in RVCMs isolated from control male rats treated with E2 (10 nM, 24 hours) in vitro. n = 4 independent experiments in A and B, n = 6 rats/group in C, cardiomyocytes isolated from n = 4–5 rats/group in DF, with each data point indicating 1 animal. All panels demonstrate representative Western blots with densitometric analyses for all experiments or animals. *P < 0.05 versus control/normoxia; #P < 0.05 versus TNF-treated (A), stauro-treated (B), or untreated SuHx (D and E); $P < 0.05 versus OVX. P values in A, B, D, and E by ANOVA with Dunnett’s post hoc correction; P values in C and F by Student’s t test. Error bars represent mean ± SEM; each data point represents 1 experiment or animal.
Figure 6
Figure 6. ER-α is necessary and sufficient for upregulating apelin in vitro.
(A) RV apelin and ER-α protein positively correlate in male and female control and SuHx-PH rats. (B) ER-α siRNA knockdown time course in H9c2 cardiomyoblasts (5 nM; 24 hours prior to E2 [100 nM]). (C) Apelin expression in H9c2 cells treated with ER-α agonist BTP-α (100 nM, 24 hours). (D) Apelin expression in RV cardiomyocytes (RVCMs) isolated from male control rats treated with E2 (10 nM, 24 hours) or BTP-α (100 nM, 24 hours) in vitro. (E) Apelin expression in RVCMs isolated from male and female SuHx-PH rats and treated with BTP (100 nM, 24 hours) in vitro. (F) RV apelin mRNA expression in normoxia, SuHx-PH, or SuHx-PH rats treated with E2 (75 μg/kg/day via s.c. pellets), ER-α agonist PPT (850 μg/kg/day; s.c. pellets) or EtOH vehicle (Veh). (G) Apelin expression in RVCMs isolated from male controls, SuHx-PH, or SuHx-PH rats treated with E2 or PPT in vivo. n = 3 independent experiments for B and C. Cells from n = 3–4 rats/group in D, E, and G. n = 6–8/group in F. BE and G depict representative Western blots with densitometric analyses. Pearson’s R value and P value shown in A. Dashed lines represent 95% CI. *P < 0.05 versus Scr (scrambled control), $P < 0.05 versus E2 in B; *P < 0.05 versus control in C and D; *P < 0.05 versus Normoxia, #P < 0.05 versus SuHx in EG. P values by ANOVA with Tukey’s post hoc correction in B, DG and by Student’s t test in C. Error bars represent mean ± SEM; each data point represents 1 experiment or animal.
Figure 7
Figure 7. ER-α is necessary for upregulating apelin in vivo.
(A) RV apelin expression in male WT, ER-α–KO (Esr1), and ER-β–KO (Esr2) mice with hypoxia-induced PH (HPH) treated with E2 (75 μg/kg/day; s.c. pellets). (B) RV apelin expression and (C) cardiac indices (echocardiographic cardiac output/body weight) in male and female control and ER-α (Esr1) mutant HPH rats. n = 5/group in A, n = 6/group in B and C. *P < 0.05 versus WT. P values by ANOVA with Tukey’s post hoc correction in A and by Student’s t test in B and C. Error bars represent mean ± SEM; each data point represents 1 experiment or animal.
Figure 8
Figure 8. ER-α is necessary for E2 to attenuate cardiopulmonary dysfunction in SuHx-PH.
(A) Experimental design. (BE) Effects of E2 treatment in WT or ER-α loss-of-function mutants on RV hypertrophy (RV weight divided by weight of left ventricle plus septum; RV/[LV + S]; B), RV systolic pressure (RVSP; C), cardiac index (echocardiographic cardiac output/body weight; D), and total pulmonary resistance index (cardiac index/RVSP; E). (F) Western blot analysis of RV apelin. Densitometric analysis demonstrates decreased ability of E2 to mediate increase in RV apelin in ER-α loss-of-function mutant (data expressed as fold-change increase in RV apelin with E2 versus untreated). *P < 0.05 versus normoxia control, ^P < 0.05 versus WT SuHx untreated, #P < 0.05 versus WT SuHx + E2 by 1-way ANOVA with Tukey post hoc correction in BE. #P < 0.05 versus WT SuHx + E2 by t test in F. Error bars represent mean ± SEM. Each data point represents 1 animal. Sq = subcutaneous.
Figure 9
Figure 9. E2 upregulates BMPR2 in stressed cardiomyoblasts, in SuHx-PH RVs, and in RV cardiomyocytes.
(A and B) Effects of E2 on BMPR2 expression in H9c2 cardiomyoblasts treated with TNF-α (10 ng/ml, 8 hours; (A) or staurosporine (stauro; 50 nM, 4 hours; (B). Cells were pretreated with E2 (100 nM) for 24 hours prior to TNF/stauro exposure and then lysed and analyzed by Western blot. (C) Western blot of BMPR2 expression in RVCMs isolated from male control rats treated with E2 in vitro (10 nM, 24 hours). (D) Western blot of BMPR2 expression in RVCMs isolated from male and female SuHx-PH rats and treated in vitro with E2 (10 nM, 24 hours). (E) Effects of endogenous or exogenous E2 on RV BMPR2 expression. SuHx-PH was induced in male, intact female, and ovariectomized (OVX) female rats. A subgroup of OVX females was replete with E2 (75 μg/kg/day via s.c. pellets for 7 weeks). Note higher baseline BMPR2 expression in female controls compared with males and increased RV BMPR2 protein abundance after E2 treatment. (F) BMPR2 expression evaluated by Western blot in RVCMs isolated from male normoxic control rats, untreated SuHx-PH rats, and SuHx-PH rats treated with E2 (75 μg/kg/day; s.c. pellets) for 7 weeks. n = 3 independent experiments in A and B; cells isolated from n = 4 rats/group in C, D, and F, with each data point indicating 1 animal; n = 6 rats/group in E. Figures depict representative Western blots with densitometric analyses for all experiments. *P < 0.05 versus untreated control, $P < 0.05 versus TNF or stauro treatment in A and B; *P < 0.05 versus untreated control in C; *P < 0.05 versus normoxia control, #P < 0.05 versus untreated SuHx in D and F. *P < 0.05 versus male normoxic control in E. All P values by ANOVA with post hoc Tukey correction except for C, where P value is by Student’s t test. Error bars represent mean ± SEM; each data point represents 1 experiment or animal.
Figure 10
Figure 10. ER-α binds to Bmpr2 promoter and is necessary and sufficient to increase RV BMPR2 in vitro and in vivo.
(A) RV BMPR2 and ER-α protein correlate positively in male and female control and SuHx-PH rats. (B) ChIP of ER-α binding at the Bmpr2 promoter. H9c2 cardiomyoblasts were treated with E2 (100 nM) for 0 (control), 4, or 20 hours. DNA/protein complexes were cross-linked and immunoprecipitated with anti–ER-α antibody or IgG isotype control. RNA polymerase II (RNA Pol II) binding to Gapdh promoter was used as positive control (bottom panel). NTC: no template control. (C) Time course of BMPR2 expression in H9c2 cardiomyoblasts after ER-α siRNA knockdown (5 nM; 24 hours prior to E2 [100 nM]; see Figure 4B for ER-α knockdown efficacy). (D) BMPR2 protein in H9c2 cells treated with ER-α agonist BTP-α (100 nM, 24 hours). (E) BMPR2 protein in RV cardiomyocytes (RVCMs) isolated from male rats and treated with E2 (10 nM, 24 hours) or BTP-α (100 nM, 24 hours) in vitro. (F) BMPR2 protein in RVCMs isolated from male and female SuHx-PH rats and treated in vitro with BTP-α (100 nM, 24 hours). (G) BMPR2 expression in RV homogenates from male normoxia, SuHx-PH, or SuHx-PH rats treated with E2 or ER-α agonist PPT (75 or 850 μg/kg/day; s.c. pellets). (H) BMPR2 protein in RVCMs from groups shown in F. n = 3 independent experiments in BD; n = 4 rats/group in EH. BG depict representative Western blots. Densitometries include data from all experiments or animals. Pearson’s R value and P value shown in A. Dashed lines represent 95% CI. *P < 0.05 versus Scr (scrambled control), $P < 0.05 versus E2 in C; *P < 0.05 versus control or normoxia in DH; #P < 0.05 versus untreated SuHx in F and H. P values in B, C, and EH by ANOVA/post hoc Tukey correction; P value in D by Student’s t test. Error bars represent mean ± SEM; each data point represents 1 experiment/animal.
Figure 11
Figure 11. E2 induces formation of PPARγ/β-catenin complexes and requires BMPR2 to increase apelin expression or ERK1/2 activation in cardiomyoblasts.
(A) H9c2 cardiomyoblasts were treated with E2 (100 nM) for 0, 4, or 24 hours and then immunoprecipitated with PPARγ antibody or rabbit IgG isotype control. Input control for each sample is indicated (bottom). Note formation of PPARγ/β-catenin complexes with E2 treatment at 4 and 24 hours. (B) Time course of siRNA knockdown of BMPR2 (5 nM) effects on apelin protein expression in E2-treated (100 nM) H9c2 rat cardiomyoblasts at baseline conditions. (C and D) Effects of BMPR2 knockdown on E2-mediated upregulation of apelin in stressed cardiomyoblasts. H9c2 cells were pretreated with E2 (100 nM, 24 hours) and then stressed with TNF-α (10 ng/ml, 8 hours; C) or staurosporine (stauro; 50 nM, 4 hours; D) with or without siRNA knockdown of BMPR2 (5 nM, 24 hours prior to E2). (E) Effects of BMPR2 knockdown on E2-mediated ERK1/2 activation in stressed cardiomyoblasts. Cells were pretreated with E2 (100 nM, 24 hours) and then treated with stauro (50 nM, 4 hours) with or without siRNA directed against BMPR2 (5 nM; 24 hours prior to E2 and stauro). Representative blots for 3 independent experiments shown in A and BE. Densitometries include data from all experiments. Scr = scramble siRNA. *P < 0.05 versus Scr control, $P < 0.05 versus E2 by ANOVA with post hoc Tukey’s correction in B; *P < 0.05 versus TNF + E2 or Stauro + E2 by Student’s t test in C and D; *P < 0.05 versus Scr control, #P < 0.05 versus Stauro, $P < 0.05 versus E2-treated Stauro group by ANOVA with post hoc Dunnett’s correction in E. Error bars represent mean ± SEM; each data point represents 1 experiment or animal.
Figure 12
Figure 12. E2 or ER-α agonist PPT rescues MCT-induced PH and increases RV BMPR2 and apelin.
(A) Experimental design. (B) Western blot analysis of RVs from MCT-PH rats. A representative Western blot is depicted on top of panel; densitometric analysis from all experimental animals is shown at bottom. (CF) Effects of E2 or PPT on RV systolic pressure (RVSP; C), RV hypertrophy (RV weight divided by weight of left ventricle plus septum; RV/[LV + S]; D), cardiac index (echocardiographic cardiac output/body weight; E), and total pulmonary resistance index (cardiac index/RVSP; F). (G) Time course of cardiac index. Percentage change in cardiac index versus 2-week baseline time point is shown in legend in parentheses behind group names. *P < 0.05 versus control, #P < 0.05 versus untreated MCT (1-way ANOVA with Tukey or Dunnett’s post hoc correction). Each data point in BF represents 1 male animal. Error bars represent mean ± SEM. Sq = subcutaneous.
Figure 13
Figure 13. E2 prevents and rescues RV failure induced by pulmonary artery banding.
(A) Experimental design. (BH) Effects of E2 treatment on RV hypertrophy (RV weight divided by weight of left ventricle plus septum; RV/[LV + S]; B), RV end-diastolic diameter (C), RV systolic pressure (RVSP) normalized for RV mass (D), stroke volume index (SVI; E) and cardiac index (F). SVI and cardiac index were determined echocardiographically. (GH) Time courses of SVI and cardiac index. Percentage change in SVI and cardiac index versus 4-week baseline time point is shown in legends in parentheses behind group names. (IJ) Effects of E2 treatment on atrial natriuretic peptide (Nppa, I) and B-type natriuretic peptide (Nppb, J) by real time RT-PCR. (K) Quantification of RV apelin by Western blot and densitometric analysis. *P < 0.05 versus sham control, #P < 0.05 versus untreated PAB (1-way ANOVA with Tukey’s or Dunnett’s post hoc correction). Each data point in BF and IK represents 1 male animal. Error bars represent mean ± SEM. Sq = subcutaneous; Prev = prevention group; Treat = treatment group.

Comment in

References

    1. Rabinovitch M. Molecular pathogenesis of pulmonary arterial hypertension. J Clin Invest. 2012;122(12):4306–4313. doi: 10.1172/JCI60658. - DOI - PMC - PubMed
    1. Lajoie AC, et al. Combination therapy versus monotherapy for pulmonary arterial hypertension: a meta-analysis. Lancet Respir Med. 2016;4(4):291–305. doi: 10.1016/S2213-2600(16)00027-8. - DOI - PubMed
    1. Lahm T, et al. Assessment of right ventricular function in the research setting: knowledge gaps and pathways forward. An official American Thoracic Society research statement. Am J Respir Crit Care Med. 2018;198(4):e15–e43. doi: 10.1164/rccm.201806-1160ST. - DOI - PMC - PubMed
    1. Vonk Noordegraaf A, et al. Pathophysiology of the right ventricle and of the pulmonary circulation in pulmonary hypertension: an update. Eur Respir J. 2019;53(1):1801900. doi: 10.1183/13993003.01900-2018. - DOI - PMC - PubMed
    1. Humbert M, et al. Survival in incident and prevalent cohorts of patients with pulmonary arterial hypertension. Eur Respir J. 2010;36(3):549–555. doi: 10.1183/09031936.00057010. - DOI - PubMed

Publication types

MeSH terms