. 2021 Mar 8;6(5):e137594.
doi: 10.1172/jci.insight.137594.

The pentose phosphate pathway mediates hyperoxia-induced lung vascular dysgenesis and alveolar simplification in neonates

Affiliations

The pentose phosphate pathway mediates hyperoxia-induced lung vascular dysgenesis and alveolar simplification in neonates

Jiannan Gong et al. JCI Insight. .

Abstract

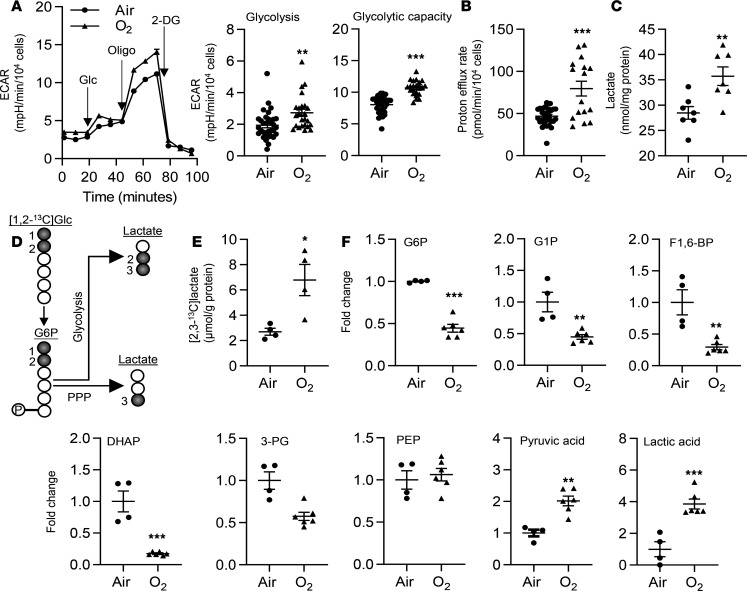
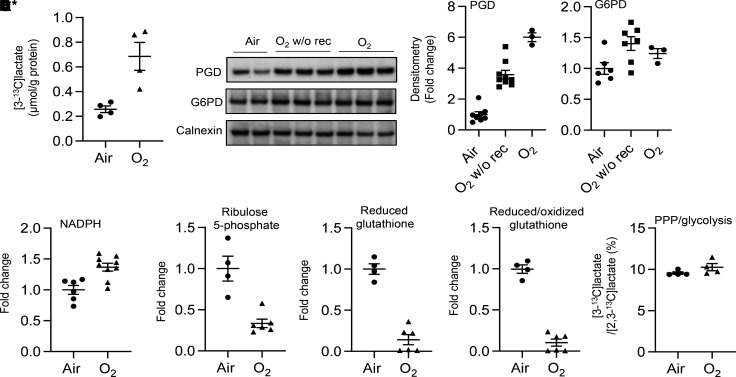
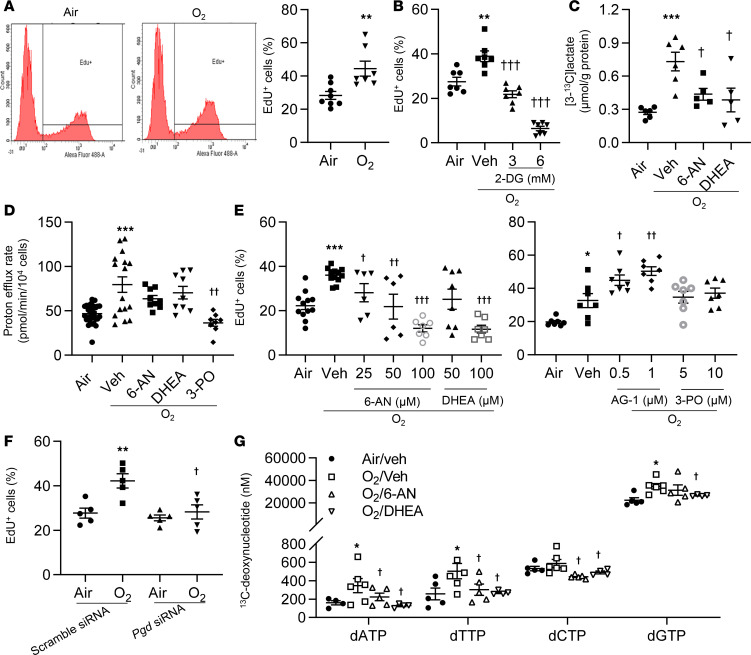
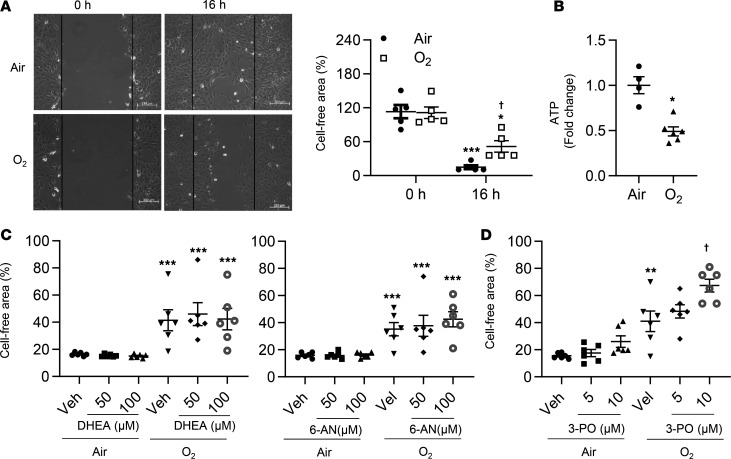
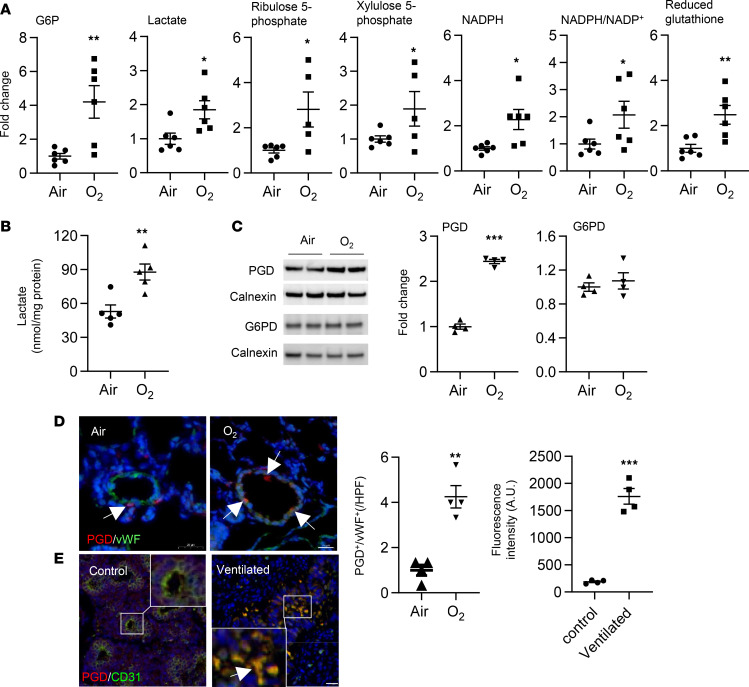
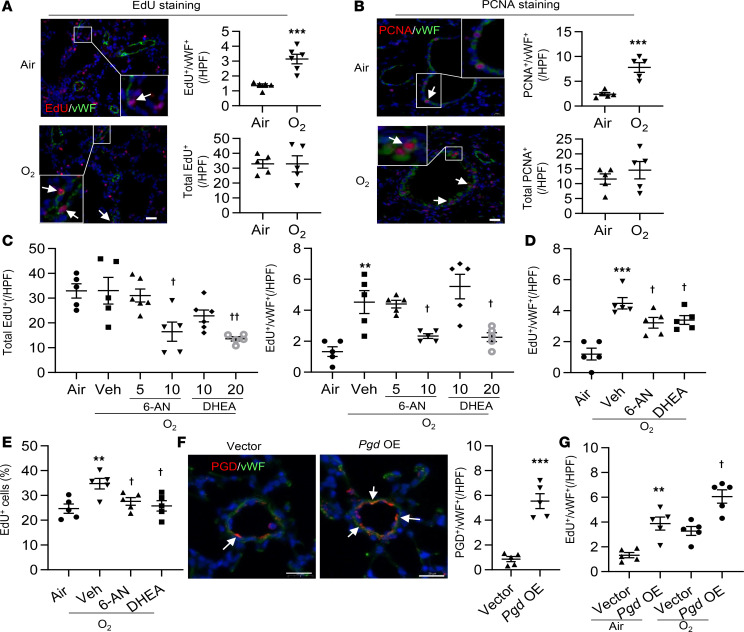
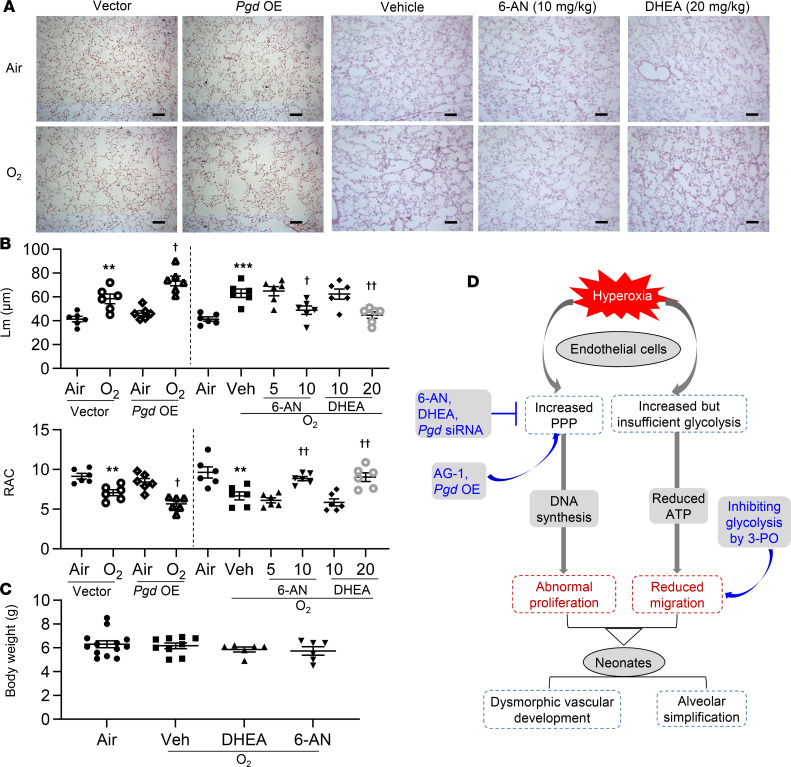
Dysmorphic pulmonary vascular growth and abnormal endothelial cell (EC) proliferation are paradoxically observed in premature infants with bronchopulmonary dysplasia (BPD), despite vascular pruning. The pentose phosphate pathway (PPP), a metabolic pathway parallel to glycolysis, generates NADPH as a reducing equivalent and ribose 5-phosphate for nucleotide synthesis. It is unknown whether hyperoxia, a known mediator of BPD in rodent models, alters glycolysis and the PPP in lung ECs. We hypothesized that hyperoxia increases glycolysis and the PPP, resulting in abnormal EC proliferation and dysmorphic angiogenesis in neonatal mice. To test this hypothesis, lung ECs and newborn mice were exposed to hyperoxia and allowed to recover in air. Hyperoxia increased glycolysis and the PPP. Increased PPP, but not glycolysis, caused hyperoxia-induced abnormal EC proliferation. Blocking the PPP reduced hyperoxia-induced glucose-derived deoxynucleotide synthesis in cultured ECs. In neonatal mice, hyperoxia-induced abnormal EC proliferation, dysmorphic angiogenesis, and alveolar simplification were augmented by nanoparticle-mediated endothelial overexpression of phosphogluconate dehydrogenase, the second enzyme in the PPP. These effects were attenuated by inhibitors of the PPP. Neonatal hyperoxia augments the PPP, causing abnormal lung EC proliferation, dysmorphic vascular development, and alveolar simplification. These observations provide mechanisms and potential metabolic targets to prevent BPD-associated vascular dysgenesis.

Keywords: Glucose metabolism; Pulmonology.


Conflict of interest statement

Conflict of interest: YYZ is the founder and Chief Scientific Officer of MountView Therapeutics LLC and is an inventor of a pending patent PCT/US2019/055787.

Figures

Figure 1
Figure 1. Hyperoxic exposure increases glycolysis in cultured lung ECs.
(AC, E, and F) Primary LMVECs (AC, and F) and MFLM-91U cells (E) were exposed to hyperoxia for 24 hours and then cultured in normoxia for 24 hours (refers to O2). (A) ECAR was measured in cells by the Seahorse XF24 Analyzer. Kinetic ECAR response to glucose (Glc), oligomycin (Oligo), and 2-DG was recorded. Basal glycolysis and glycolytic capacity were calculated after normalization into the number of live cells. n = 32 in air and n = 16 in hyperoxia. (B) Glycolytic rate assay was performed to determine glycolysis-derived proton efflux. n = 32 in air and n = 16 in hyperoxia. (C) Intracellular lactate was measured using the L-lactate Assay kit. n = 7 per group. (D) Schematic figure showing the production of [2,3-13C]lactate and [3-13C]lactate from [1,2-13C]glucose via glycolysis and the PPP, respectively. (E) [2,3-13C]lactate was measured by the NMR when cells were incubated with [1,2-13C]glucose (20 mM) for 24 hours during air recovery phase. n = 4 per group. (F) Detectable intracellular metabolites during glycolysis were presented. n = 4 in air and n = 6 in hyperoxia. Data are expressed as mean ± SEM. *P < 0.05, **P < 0.01, ***P < 0.001 versus air using 1-railed t test (AC, E, and F).
Figure 2
Figure 2. Hyperoxic exposure increases the PPP in cultured lung ECs.
(AE) MFLM-91U cells (A and E) and primary LMVECs (BD) were exposed to hyperoxia for 24 hours and then cultured in normoxia for 24 hours (refers to O2) unless specifically mentioned. (A) [3-13C]lactate was measured by the NMR when cells were incubated with [1,2-13C]glucose (20 mM) for 24 hours during air recovery phase. n = 4 per group. (B) Western blot was performed to determine levels of PGD and G6PD proteins. O2 w/o rec refers hyperoxic exposure for 24 hours without air recovery, while O2 refers hyperoxic exposure for 24 hours, followed by air recovery for 24 hours. n = 6 in air, n = 7 in hyperoxia without air recovery, and n = 3 in hyperoxia with air recovery. (C) NADPH levels were measured using a commercially available kit. n = 6 in air and n = 9 in hyperoxia. (D) Levels of ribulose 5-phosphate, reduced and reduced/oxidized glutathione were determined through metabolomics analysis. n = 4 in air and n = 6 in hyperoxia. (E) Ratio of [3-13C]lactate to [2,3-13C]lactate was calculated based on results from Figure 1D and A. n = 4 per group. Data are expressed as mean ± SEM. *P < 0.05, **P < 0.01, ***P < 0.001 versus air using 1-tailed t test (A, C, D, and E) or ANOVA followed by Tukey-Kramer test (B).
Figure 3
Figure 3. Blocking the PPP reduces hyperoxia-induced proliferation in cultured lung ECs.
(AG) Primary mouse LMVECs (A, B, D, E, G) or MFLM-91U cells (C and F) were exposed to hyperoxia for 24 hours, followed by normoxia for 24 hours (refers to O2). (A) EdU incorporation was measured by flow cytometry, and a percentage of EdU+ cells was calculated. n = 8 in air and n = 7 in hyperoxia. (B) EdU incorporation was measured by flow cytometry after incubation with 2-DG (3 and 6 mM, 12 hours) during air recovery phase. n = 7 per group. (C) [3-13C]lactate was measured by the NMR when cells were incubated with [1,2-13C]glucose (20 mM, 24 hours) along with 6-AN (50 μM, 12 hours) or DHEA (50 μM, 12 hours) during air recovery phase. n = 6 in air and O2/veh groups; n = 5 in 6-AN and DHEA treatment groups. (D) Glycolytic rate assay was performed after incubation with 6-AN (50 μM), DHEA (50 μM), or 3-PO (10 μM) for 12 hours during air recovery phase. n = 32 in air and O2/veh groups; n = 8 in 6-AN, DHEA and 3-PO treatment groups. (E) EdU incorporation was measured by flow cytometry after incubation with 6-AN (25–100 μM), DHEA (50 and100 μM), and 3-PO (5 and10 μM) for 12 hours during air recovery phase. n = 7 in per group. (F) EdU was measured by flow cytometry in scramble and pgd siRNA–transfected cells. n = 5 in per group. (G) [13C]-labeled deoxynucleotides were measured by mass spectrometry when cells were incubated with 20 mM [U-13C]glucose for 24 hours during air recovery phase. n = 5 per group. *P < 0.05, **P < 0.01, ***P < 0.001 versus air (AE), scramble siRNA/air (F), or air/veh (G); P<0.05, ††P < 0.01, †††P < 0.001 versus hyperoxia/vehicle (BE, and G) or scramble siRNA/hyperoxia (F) using 1-tailed t test (A) or ANOVA followed by Tukey-Kramer test (BG).
Figure 4
Figure 4. Blocking glycolysis further reduces migration in cultured lung ECs exposed to hyperoxia.
Primary mouse LMVECs were exposed to hyperoxia for 24 hours, followed by normoxia for 24 hours (refers to O2). (A) Scratch assay was performed 16 hours after hyperoxic exposure, and cell-free area was calculated using ImageJ software. n = 5 per group. (B) Intracellular ATP was measured through metabolomics analysis. n = 4 in air and n = 5 in hyperoxia. (C) Scratch assay was performed after incubation with DHEA (50 and 100 μM), 6-AN (50 and 100 μM), or (D) 3-PO (5 and 10 μM) for 12 hours during air recovery phase. n = 6 per group. *P < 0.05, **P < 0.01, ***P < 0.001 versus air/0 hours (A), air (B), or air/veh (C and D); P < 0.05 versus air/16 hours (A) or hyperoxia/vehicle (D) using 1-tailed t test (B) or ANOVA followed by Tukey-Kramer test (A, C, and D).
Figure 5
Figure 5. Glycolysis and the PPP are increased in lungs of mice exposed to hyperoxia, and endothelial PGD overexpression occurs in lungs of premature infants requiring mechanical ventilation.
(AD) C57BL/6J neonatal mice (<12 hours old) were exposed to air or hyperoxia (95% O2) for 3 days and were then allowed to recover in room air until P7 (A) or P14 (BD). (A) Untargeted metabolomics was performed by mass spectrometry in mouse lungs, and detectable metabolites in glycolysis and the PPP were presented. n = 6 per group. (B) Lactate levels were measured in mouse lungs using a L-lactate Assay kit. n = 5 per group. (C) Western blot was performed to assess protein levels of PGD and G6PD in mouse lungs. n = 4 per group. (D) Double immunofluorescence was conducted to determine the abundance of PGD in vWF+ cells in mouse lungs. Numbers of PGD+ and vWF+ cells were counted in 3 randomly selected high-power fields (HPF) for each sample, which was shown in left graph. Scale bar: 20 μm. n = 4 per group. (E) Immunofluorescence was carried out to detect colocalization of PGD and CD31 in lungs of premature infants requiring mechanical ventilation. Scale bar: 20 μm. Fluorescent intensity of PGD+/CD31+ cells was evaluated using an ImageJ software, which was shown in right graph. n = 4 per group. Data are expressed as mean ± SEM. *P < 0.05, **P < 0.01, ***P < 0.001 versus air (AD) or control subjects (E) using 1-tailed t test (AE).
Figure 6
Figure 6. The PPP enhances lung EC proliferation in mice exposed to hyperoxia as neonates.
C57BL/6J neonatal mice (<12 hours old) were exposed to air or hyperoxia (95% O2) for 3 days and were then allowed for recover in room air until P14. (A) EdU was i.p. injected at 50 mg/kg daily for 3 days before sacrificing. Lung tissues were utilized for EdU staining, along with costaining with vWF. Scale bar: 20 μm. n = 5 per group. (B) Double immunofluorescence was conducted to determine the abundance of PCNA in vWF+ cells in mouse lungs. Scale bar: 20 μm. n = 5 per group. (C) 6-AN (5 and 10 mg/kg, i.p.) or DHEA (10 and 20 mg/kg, i.p.) were administered daily in mice from P9 to P13. (D) 6-AN (10 mg/kg, i.p.) or DHEA (20 mg/kg, i.p.) were administered daily in mice from P12 to P13. (C and D) Lung tissues were utilized for double immunofluorescence of EdU incorporation and vWF. Numbers of EdU+ and vWF+ cells were counted in 3 randomly selected high-power fields (HPF) for each sample. n = 5 per group. (E) EdU incorporation was measured by flow cytometry in LMVECs isolated from hyperoxia-exposed mice treated with 6-AN (10 mg/kg) or DHEA (20 mg/kg) between P9 and P13. n = 5 per group. (F) Nanoparticles mixed with plasmid DNA expressing pgd or empty vector under the control of human CDH5 promoter was administered into normoxia-exposed mice via a retro-orbital injection at P9. At P14, immunofluorescence was performed to detect colocalization of PGD and vWF in mouse lungs. Pgd OE, pgd overexpression. Scale bar: 20 μm. n = 5 per group. (G) Immunofluorescence of EdU incorporation and vWF was performed in hyperoxia-exposed mice injected with nanoparticles mixed with plasmid DNA expressing pgd or empty vector under the control of human CDH5 promoter. Numbers of EdU+/vWF+ cells were counted in 3 randomly selected high-power fields (HPF) for each sample. n = 5 per group. Data are expressed as mean ± SEM. **P < 0.01, ***P < 0.001 versus air (AE), vector (F), or air/vector (G); P < 0.05, ††P < 0.01 versus hyperoxia/vehicle (CE) or hyperoxia/vector (G) using 1-tailed t test (A, B, and F) or ANOVA followed by Tukey-Kramer test (CE, and G).
Figure 7
Figure 7. Endothelial pgd overexpression augments, whereas blocking the PPP attenuates, alveolar simplification in neonatal mice exposed to hyperoxia.
C57BL/6J neonatal mice (<12 hours old) were exposed to air or hyperoxia (95% O2) for 3 days and were then allowed for recover in room air until P14. At P9, mixtures of nanoparticles and plasmid DNA expressing pgd or empty vector under the control of human CDH5 promoter were administered into mice via a retro-orbital injection. 6-AN (5 and 10 mg/kg, i.p.) or DHEA (10 and 20 mg/kg, i.p.) were administered daily in mice from P9 to P13. (A) H&E staining was performed to assess lung morphology in mouse lungs. Pgd OE, pgd overexpression. Scale bar: 100 μm. (B) Mean linear intercept (Lm) and radical alveolar count (RAC) were calculated in mouse lungs. n = 6 per group. (C) Body weight was calculated after 6-AN or DHEA administration in neonatal mice exposed to hyperoxia. n = 6 per group. (D) Schematic showing that hyperoxic exposure increased the PPP and glycolysis in lung ECs. Hyperoxia-induced increase in the PPP results in abnormal EC proliferation and subsequent dysmorphic vascular development and alveolar simplification in neonates. Data are expressed as mean ± SEM. **P < 0.01, ***P < 0.001 versus air/vector or air; P < 0.05, ††P < 0.01 versus hyperoxia/vector or hyperoxia/vehicle using ANOVA followed by Tukey-Kramer test (AC).

Similar articles

Cited by

References

    1. Jobe AH, Abman SH. Bronchopulmonary dysplasia: a continuum of lung disease from the fetus to the adult. Am J Respir Crit Care Med. 2019;200(6):659–660. doi: 10.1164/rccm.201904-0875ED. - DOI - PMC - PubMed
    1. Doyle LW, et al. Expiratory airflow in late adolescence and early adulthood in individuals born very preterm or with very low birthweight compared with controls born at term or with normal birthweight: a meta-analysis of individual participant data. Lancet Respir Med. 2019;7(8):677–686. doi: 10.1016/S2213-2600(18)30530-7. - DOI - PubMed
    1. Hislop AA. Airway and blood vessel interaction during lung development. J Anat. 2002;201(4):325–334. doi: 10.1046/j.1469-7580.2002.00097.x. - DOI - PMC - PubMed
    1. Jakkula M, et al. Inhibition of angiogenesis decreases alveolarization in the developing rat lung. Am J Physiol Lung Cell Mol Physiol. 2000;279(3):L600–L607. doi: 10.1152/ajplung.2000.279.3.L600. - DOI - PubMed
    1. Le Cras TD, et al. Treatment of newborn rats with a VEGF receptor inhibitor causes pulmonary hypertension and abnormal lung structure. Am J Physiol Lung Cell Mol Physiol. 2002;283(3):L555–L562. doi: 10.1152/ajplung.00408.2001. - DOI - PubMed

Publication types

MeSH terms