

Subcortical rather than cortical sources of the frequency-following response (FFR) relate to speech-in-noise perception in normal-hearing listeners
- PMID: 33497718
- PMCID: PMC7897268
- DOI: 10.1016/j.neulet.2021.135664
Subcortical rather than cortical sources of the frequency-following response (FFR) relate to speech-in-noise perception in normal-hearing listeners
Abstract
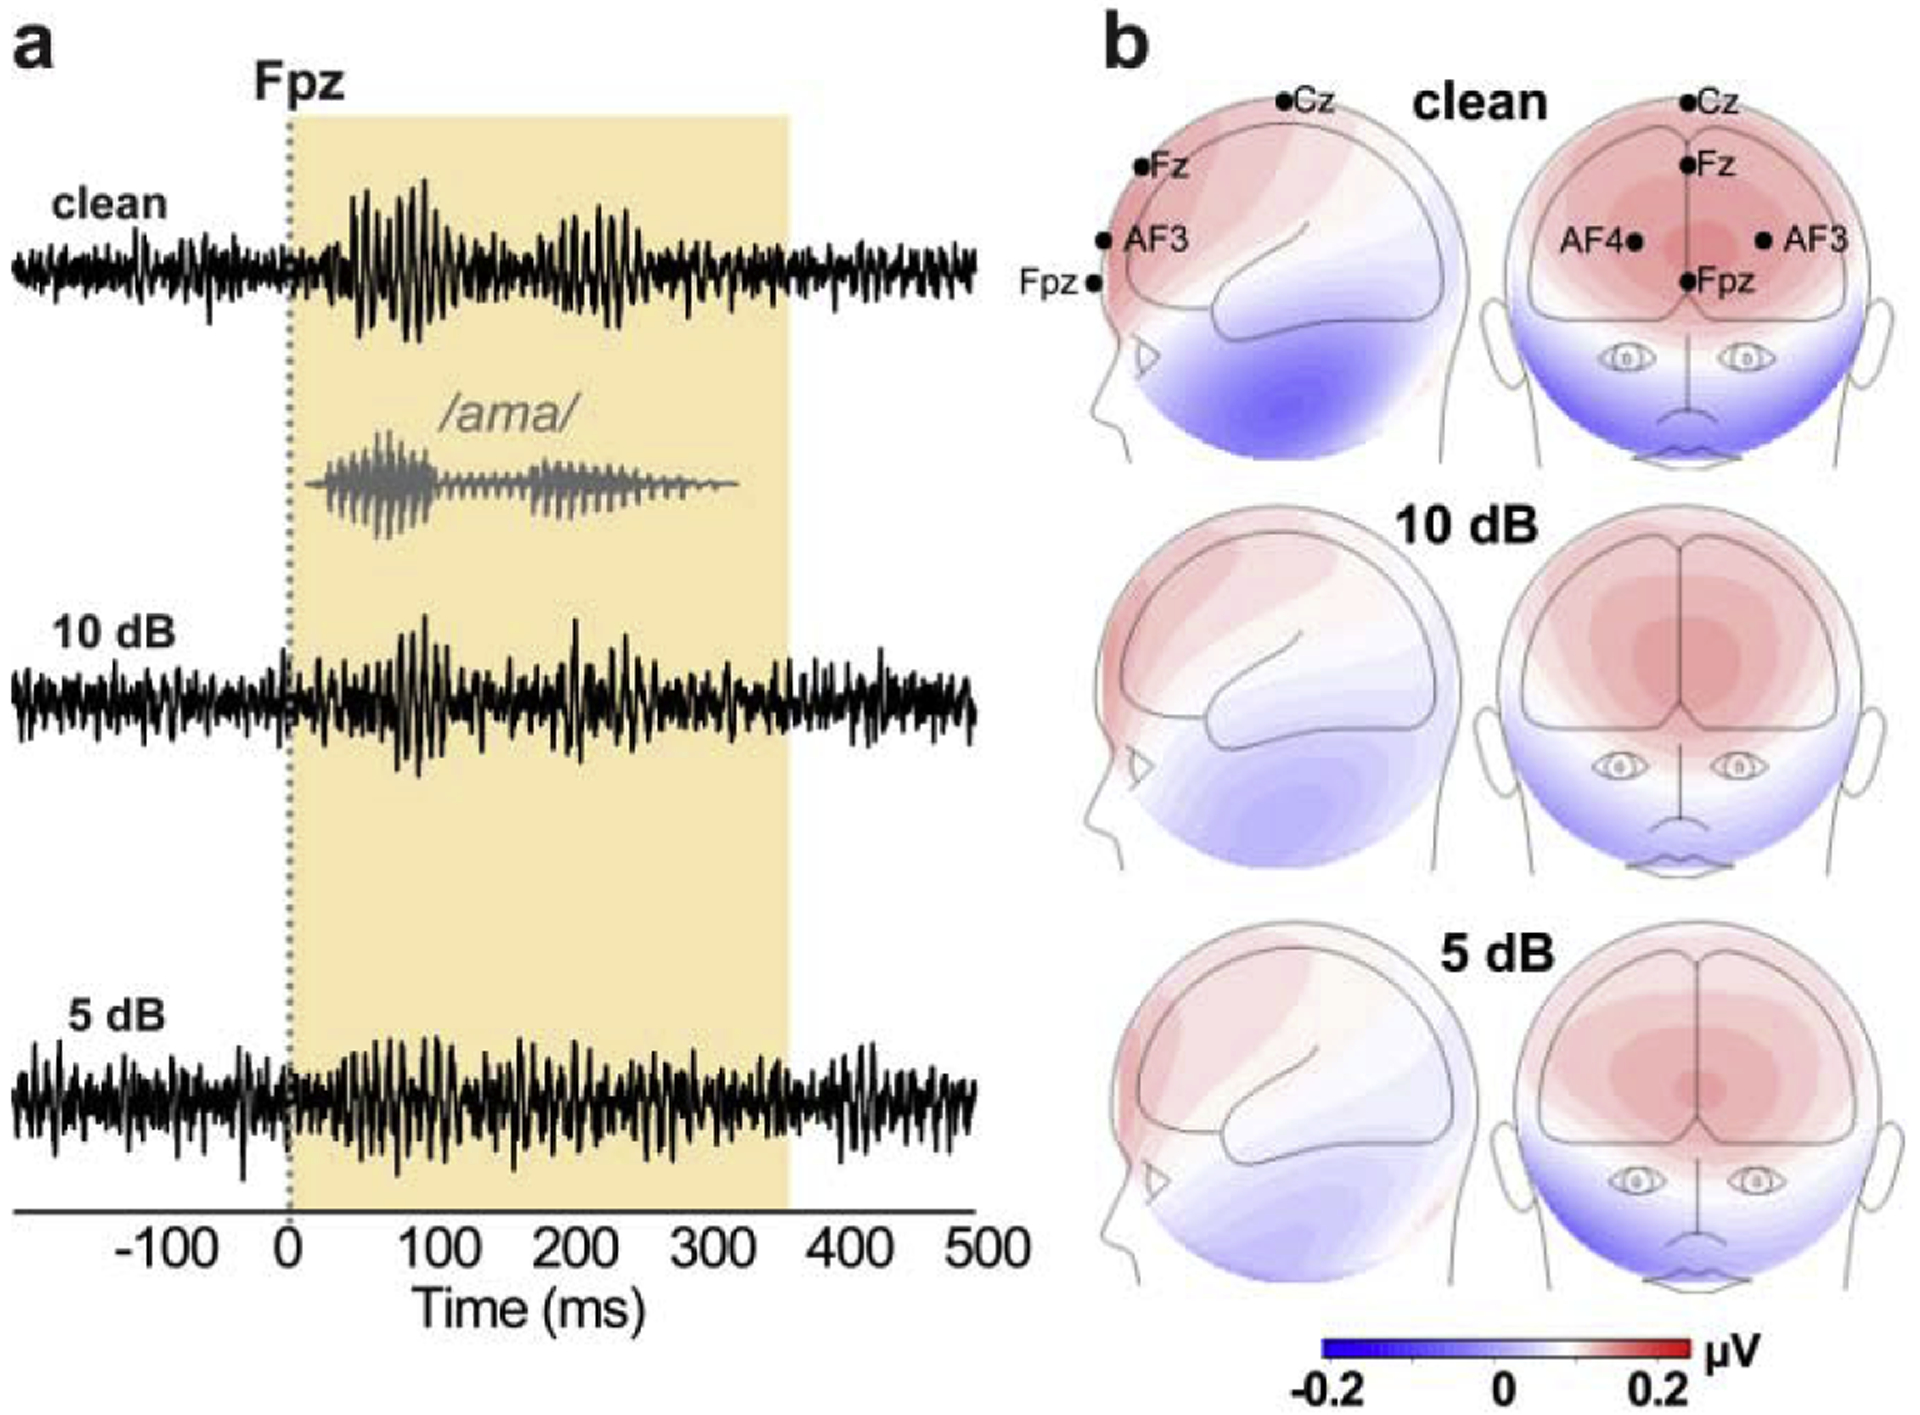
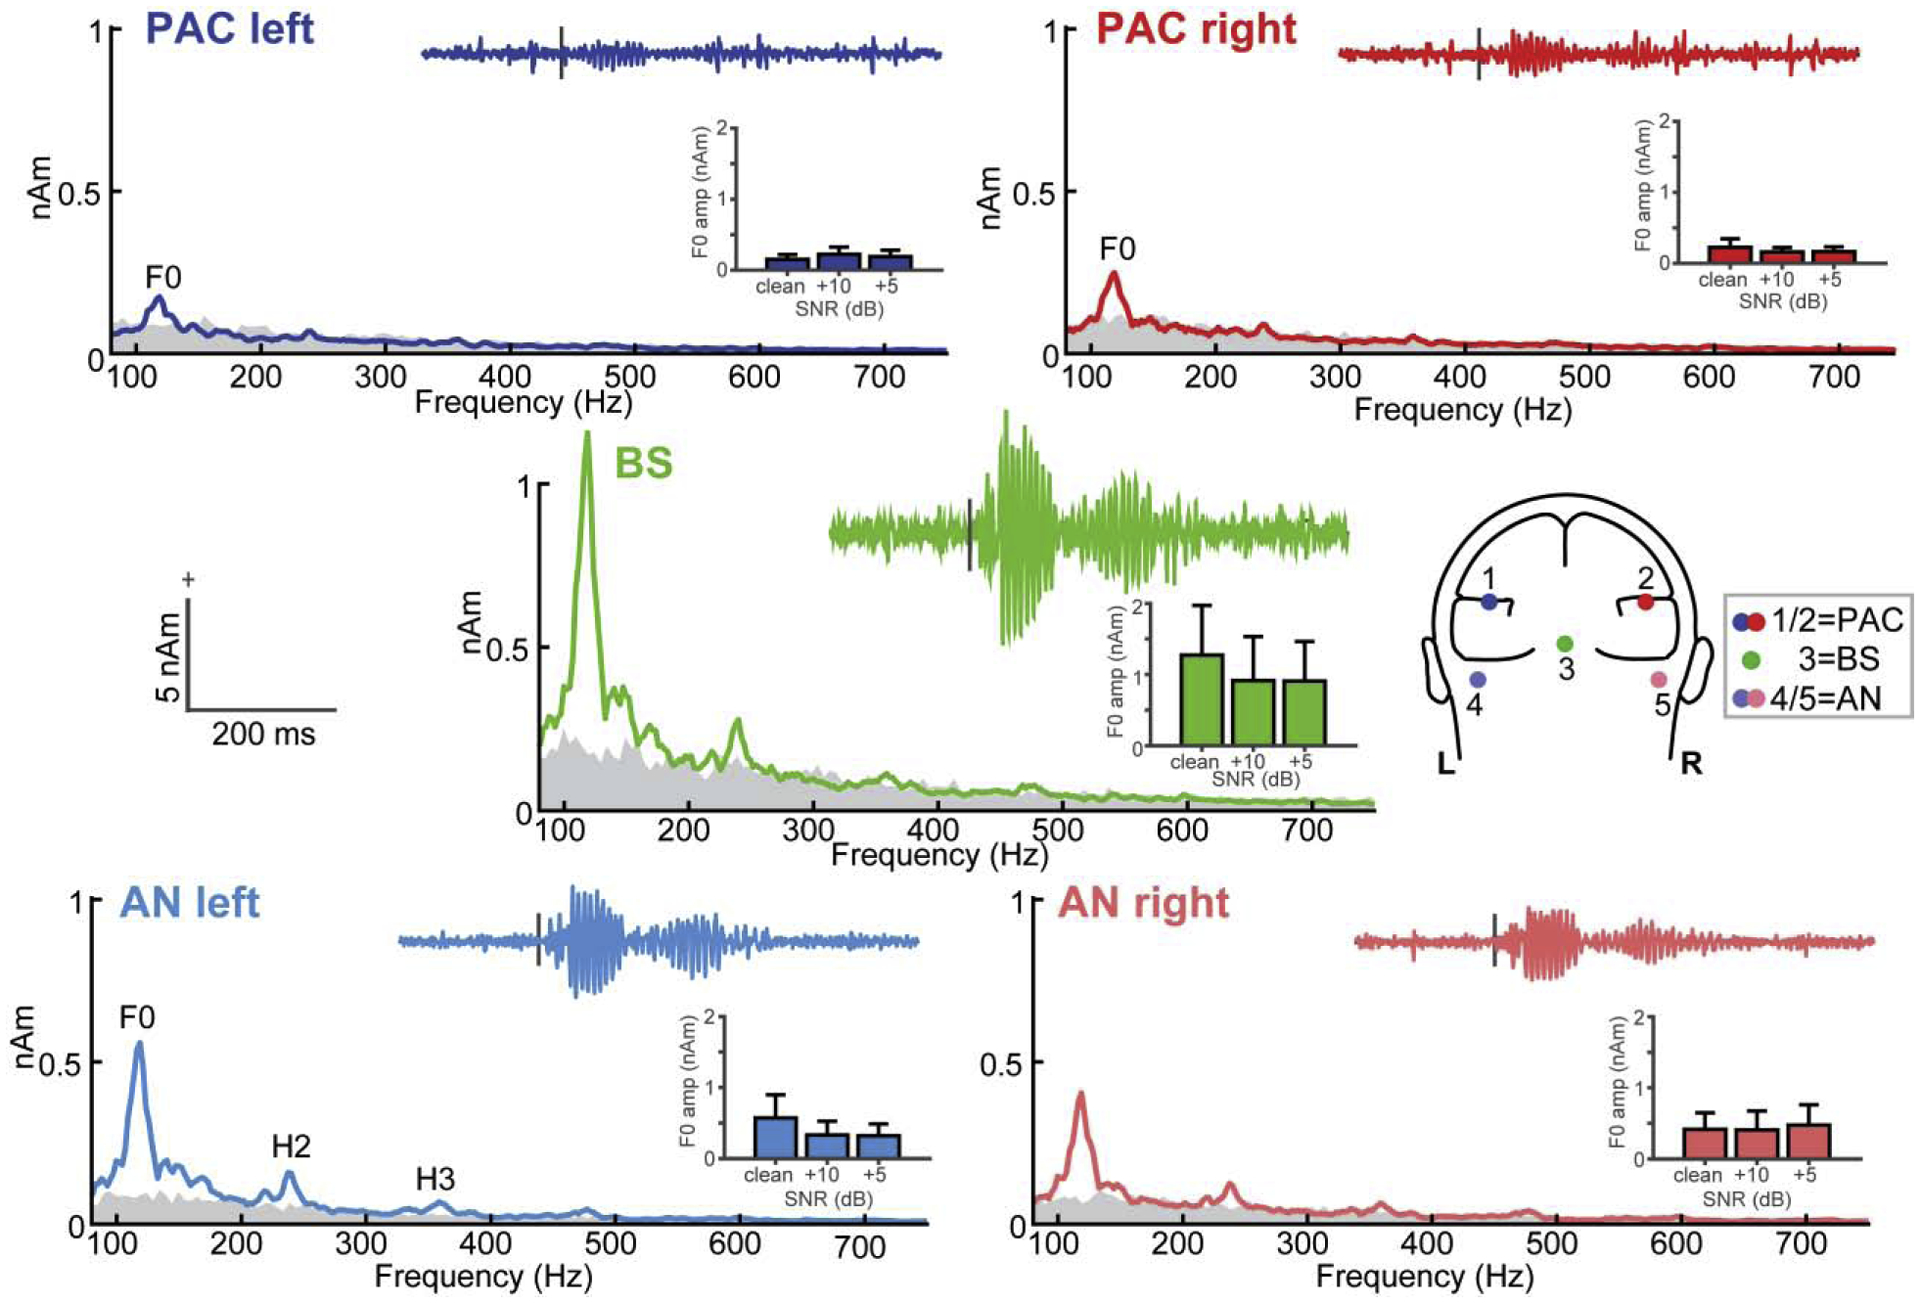
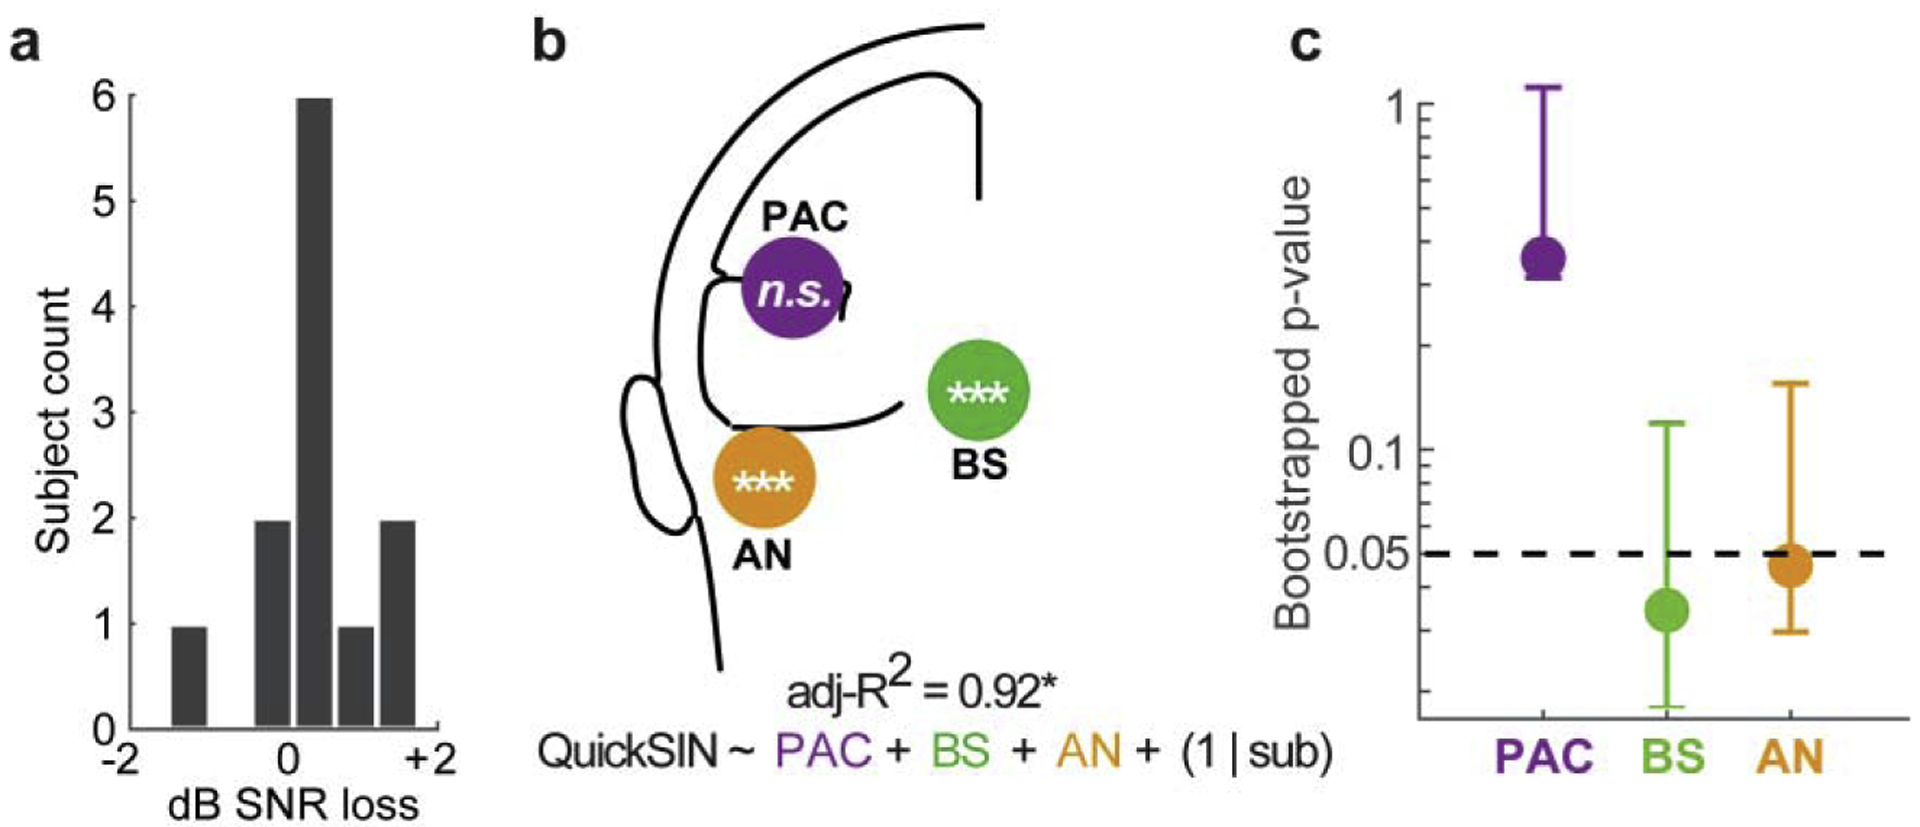
Scalp-recorded frequency-following responses (FFRs) reflect a mixture of phase-locked activity across the auditory pathway. FFRs have been widely used as a neural barometer of complex listening skills, especially speech-in noise (SIN) perception. Applying individually optimized source reconstruction to speech-FFRs recorded via EEG (FFREEG), we assessed the relative contributions of subcortical [auditory nerve (AN), brainstem/midbrain (BS)] and cortical [bilateral primary auditory cortex, PAC] source generators with the aim of identifying which source(s) drive the brain-behavior relation between FFRs and SIN listening skills. We found FFR strength declined precipitously from AN to PAC, consistent with diminishing phase-locking along the ascending auditory neuroaxis. FFRs to the speech fundamental (F0) were robust to noise across sources, but were largest in subcortical sources (BS > AN > PAC). PAC FFRs were only weakly observed above the noise floor and only at the low pitch of speech (F0≈100 Hz). Brain-behavior regressions revealed (i) AN and BS FFRs were sufficient to describe listeners' QuickSIN scores and (ii) contrary to neuromagnetic (MEG) FFRs, neither left nor right PAC FFREEG related to SIN performance. Our findings suggest subcortical sources not only dominate the electrical FFR but also the link between speech-FFRs and SIN processing in normal-hearing adults as observed in previous EEG studies.
Keywords: Auditory brainstem response (ABR); Auditory event-related potentials (ERPs); Cocktail party scenario; Cortical FFR; Noise-degraded speech perception.
Copyright © 2021 Elsevier B.V. All rights reserved.
Figures
Similar articles
-
Enhanced brainstem phase-locking in low-level noise reveals stochastic resonance in the frequency-following response (FFR).Brain Res. 2021 Nov 15;1771:147643. doi: 10.1016/j.brainres.2021.147643. Epub 2021 Aug 30. Brain Res. 2021. PMID: 34473999 Free PMC article. Review.
-
Subcortical sources dominate the neuroelectric auditory frequency-following response to speech.Neuroimage. 2018 Jul 15;175:56-69. doi: 10.1016/j.neuroimage.2018.03.060. Epub 2018 Mar 28. Neuroimage. 2018. PMID: 29604459
-
Brainstem-cortical functional connectivity for speech is differentially challenged by noise and reverberation.Hear Res. 2018 Sep;367:149-160. doi: 10.1016/j.heares.2018.05.018. Epub 2018 May 26. Hear Res. 2018. PMID: 29871826 Free PMC article.
-
Attention reinforces human corticofugal system to aid speech perception in noise.Neuroimage. 2021 Jul 15;235:118014. doi: 10.1016/j.neuroimage.2021.118014. Epub 2021 Mar 29. Neuroimage. 2021. PMID: 33794356 Free PMC article.
-
Sensory-cognitive interaction in the neural encoding of speech in noise: a review.J Am Acad Audiol. 2010 Oct;21(9):575-85. doi: 10.3766/jaaa.21.9.3. J Am Acad Audiol. 2010. PMID: 21241645 Free PMC article. Review.
Cited by
-
Effects of Temporal Processing on Speech-in-Noise Perception in Middle-Aged Adults.Biology (Basel). 2024 May 23;13(6):371. doi: 10.3390/biology13060371. Biology (Basel). 2024. PMID: 38927251 Free PMC article.
-
Cortical-brainstem interplay during speech perception in older adults with and without hearing loss.Front Neurosci. 2023 Feb 2;17:1075368. doi: 10.3389/fnins.2023.1075368. eCollection 2023. Front Neurosci. 2023. PMID: 36816123 Free PMC article.
-
Brainstem speech encoding is dynamically shaped online by fluctuations in cortical α state.Neuroimage. 2022 Nov;263:119627. doi: 10.1016/j.neuroimage.2022.119627. Epub 2022 Sep 16. Neuroimage. 2022. PMID: 36122686 Free PMC article.
-
Enhanced brainstem phase-locking in low-level noise reveals stochastic resonance in the frequency-following response (FFR).Brain Res. 2021 Nov 15;1771:147643. doi: 10.1016/j.brainres.2021.147643. Epub 2021 Aug 30. Brain Res. 2021. PMID: 34473999 Free PMC article. Review.
-
Relations between speech-reception, psychophysical temporal processing, and subcortical electrophysiological measures of auditory function in humans.Hear Res. 2022 Apr;417:108456. doi: 10.1016/j.heares.2022.108456. Epub 2022 Jan 31. Hear Res. 2022. PMID: 35149333 Free PMC article.
References
-
- Bauer M, Trahms L, Sander T, Magnetoencephalographic accuracy profiles for the detection of auditory pathway sources. Biomedical Engineering / Biomedizinische Technik, Vol. 60, 2015, p. 135. - PubMed
-
- Bidelman GM, Communicating in challenging environments: Noise and reverberation In: Kraus N, Anderson S, White-Schwoch T, Fay RR, Popper AN (Eds.), Springer Handbook of Auditory Research: The frequency-following response: A window into human communication, Springer Nature, New York, N.Y., 2017.
-
- Bidelman GM, Multichannel recordings of the human brainstem frequency-following response: Scalp topography, source generators, and distinctions from the transient ABR, Hear. Res 323 (2015) 68–80. - PubMed
Publication types
MeSH terms
Grants and funding
LinkOut - more resources
Full Text Sources
Other Literature Sources
Medical
