Comparative Study
. 2021 Apr 15:230:117778.
doi: 10.1016/j.neuroimage.2021.117778. Epub 2021 Jan 23.

MRI monitoring of macaque monkeys in neuroscience: Case studies, resource and normative data comparisons

Affiliations
Comparative Study

MRI monitoring of macaque monkeys in neuroscience: Case studies, resource and normative data comparisons

Fabien Balezeau et al. Neuroimage. .

Abstract

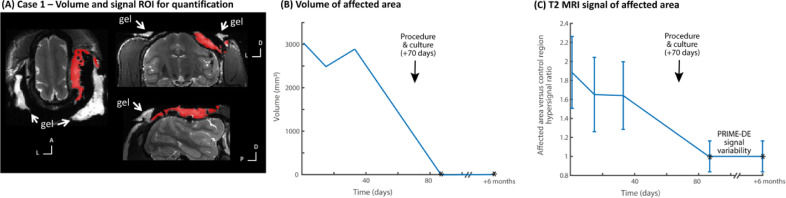
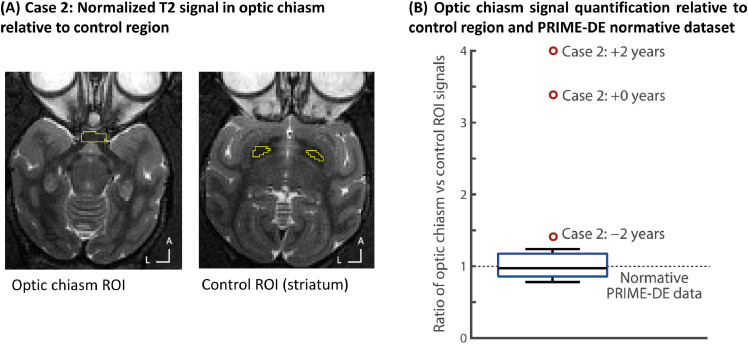
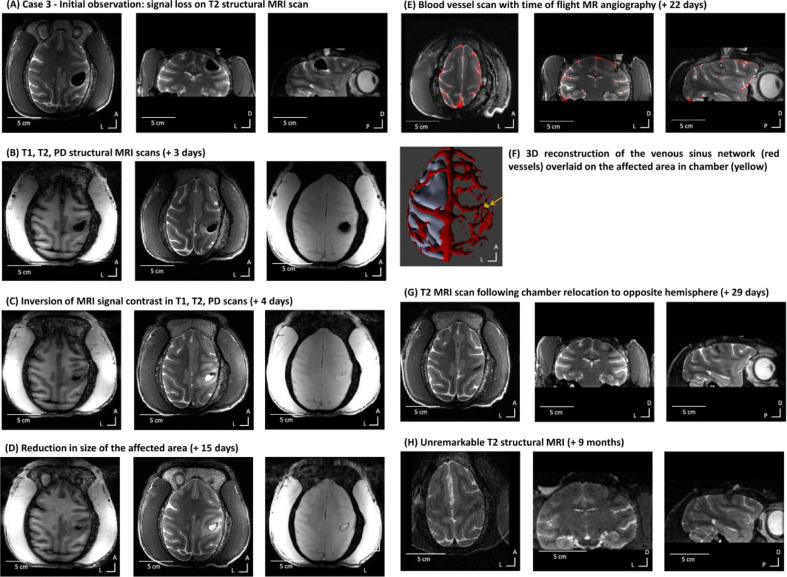
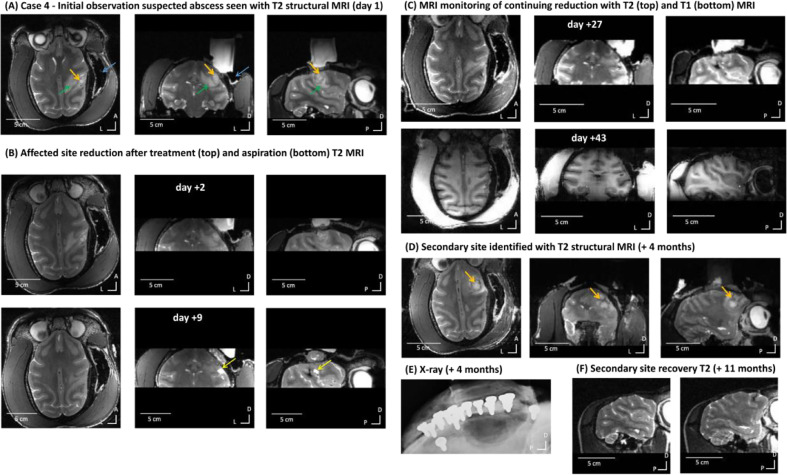
Information from Magnetic Resonance Imaging (MRI) is useful for diagnosis and treatment management of human neurological patients. MRI monitoring might also prove useful for non-human animals involved in neuroscience research provided that MRI is available and feasible and that there are no MRI contra-indications precluding scanning. However, MRI monitoring is not established in macaques and a resource is urgently needed that could grow with scientific community contributions. Here we show the utility and potential benefits of MRI-based monitoring in a few diverse cases with macaque monkeys. We also establish a PRIMatE MRI Monitoring (PRIME-MRM) resource within the PRIMatE Data Exchange (PRIME-DE) and quantitatively compare the cases to normative information drawn from MRI data from typical macaques in PRIME-DE. In the cases, the monkeys presented with no or mild/moderate clinical signs, were well otherwise and MRI scanning did not present a significant increase in welfare impact. Therefore, they were identified as suitable candidates for clinical investigation, MRI-based monitoring and treatment. For each case, we show MRI quantification of internal controls in relation to treatment steps and comparisons with normative data in typical monkeys drawn from PRIME-DE. We found that MRI assists in precise and early diagnosis of cerebral events and can be useful for visualising, treating and quantifying treatment response. The scientific community could now grow the PRIME-MRM resource with other cases and larger samples to further assess and increase the evidence base on the benefits of MRI monitoring of primates, complementing the animals' clinical monitoring and treatment regime.

Keywords: Diagnosis; Magnetic resonance imaging; Monitoring; Neurology; PRIME-DE; Primate; Resource; Treatment; Welfare.


Conflict of interest statement

Declaration of Competing Interest None.

Figures

Fig. 1
Fig. 1
Case 1 - MRI identifies and monitors treatment response of suspected infection. (A) Initial observation with T2 structural MRI (green arrow shows area of interest of affected MRI signal). MRI signal drop out underneath yellow arrow is not clinically significant, this is an expected and unremarkable loss of MRI signal around the chamber which is not visible on MRI scans. From left to right: axial, coronal and sagittal views. (B) T2 structural MRI showing reduction in affected area after treatment (green arrows and lines) from day +1 to day +33. (C) Recovery of affected area observed on T2 structural MRI (+3 months). The white regions around the head are caused by a hydrous gel (identified with white arrows) used to improve the overall scanning quality and thus are not clinically of interest.
Fig. 2
Fig. 2
Case 1 – MRI quantification of effects and resolution. (A) shows in red the region of interest (ROI) defined for the affected area (not clinically significant signal from the aqueous gel used to improve imaging quality is identified with white arrows). (B) shows the volume of the area (in mm3). Procedure and culture at +70 days is identified and was followed by resolution with no evidence of the suspected abscess (expected volume of 0 mm3 affected area based on normative data from PRIME-DE monkeys without evidence of abscess in MRI scans, shown by * in the plot). (C) shows the T2 MRI signal hyperintensity of the affected area relative to the unaffected brain area ROI as a control and the variability of the signal in the affected area (standard deviation); * shows the return to normal signal in the brain area, ratio value = 1, relative to signal variability from the PRIME-DE normative data cohort.
Fig. 3
Fig. 3
Case 2 – MRI identification of naturally occurring demyelinating condition. (A) Initial historical baseline T2 structural MRI during unaffected vision (2 years prior). No obvious sign of demyelination around the optic chiasm is seen – white matter around optic chiasm (orange arrow) looks typical. From left to right: axial, coronal and sagittal views. The white column in the coronal image is sterile solution used to visualize the location of the recording chamber. (B) Initial observation of T2 structural MRI two years after the historical scan (day 1) where weaker T2 signal in the optic chiasm is seen. (C) Evolution over time of the visual pathway with T2 structural MRI scans (axial and sagittal views). The orange arrow suggests demyelination of the optic chiasm, the green arrow shows less affected myelination of the rest of the optic tract. (D) Comparison of the optical chiasm from a T1/T2 ratio image (myelin weighted) in Case 2 (right) and a typical monkey (left). The orange circle shows the area around the optic chiasm. (E) Diffusion MRI tractography comparison between Case 2 and a typical monkey in the optical tracks from the optic chiasm (left two images) or focusing on the optical tracts starting from visual cortex (right two images).
Fig. 4
Fig. 4
Case 2 – MRI quantification of effects and progression. (A) Regions used for quantification of the MRI T2 signal in the optic chiasm and a control region in the striatum (yellow outline regions). (B) shows the ratio of the optic chiasm relative to the control ROI T2 signal; the box-plot shows the normative distribution from the PRIME-DE cohort. Note how Case 2 at first identification (-2 years) is already well outside of the normative distribution and there is progression of signal loss (higher control vs. optic chiasm ratio values) at 0 and +2 years.
Fig. 5
Fig. 5
Case 3 – MRI signals and time course of resolution of suspected ICH. (A) Initial MRI identification consisting of MRI signal loss in a T2 structural MRI scan (day 1). From left to right: axial, coronal and sagittal views. (B) Initial T1 and T2 MRI scans of uncertain diagnosis (+ 3 days). From left to right: T1, T2 and PD MRI scans. (C) Inversion of contrast on T1, T2 and PD scans (+ 4 days). (D) Continued reduction in size of the affected area (+ 15 days) on T1, T2 and PD scans. (E) Blood vessel enhancement scan (time of flight MR angiography) overlaid on a T2 RARE structural scan (+ 22 days). (F) 3D reconstruction of the venous sinus network and an overlay of the craniectomy area (yellow). (G) T2 structural MRI after chamber was relocated to the opposite hemisphere (+ 29 days). (H) Unremarkable T2 structural MRI (+ 9 months).
Fig. 6
Fig. 6
Case 3 – MRI quantification of effects and resolution. (A) shows in red ROI used for quantification. (B) Shows the volume of the affected area for both the T1 and T2 signals. Note how there is substantial reduction and resolution in the affected area after about one month, with return to normal brain signal. Normative PRIME-DE cohort brain scans show 0 mm3 of affected areas.
Fig. 7
Fig. 7
Case 4 - MRI identification, treatment and resolution of suspected abscess. (A) Initial observation with T2 structural MRI (day 1). Orange arrow over the affected area centre and green arrow shows the oedema penumbra. Blue arrow points to MRI signal dropout that is not clinically significant (expected lack of MRI signal from the cement around the chamber that is not visible on MRI scans). Scans shown from left to right: axial, coronal and sagittal views. (B-C) Affected site resolution time-course following treatment and monitoring with T2 structural MRI. (D) Secondary site identification and monitoring with T2 structural MRI (orange arrows). (E) X-ray monitoring of implant integration; x-ray image shows where the cement implant above the skull can be seen as well as the ceramic anchoring screws. Shadowing around screws may indicate bone retraction. This x-ray shows that the implant is intact and well integrated apart from two screws with shadowing (in the front and middle), which was also confirmed visually during the implant removal procedure. (F) Secondary affected site resolution after implant removal confirmed with T2 MRI scans.
Fig. 8
Fig. 8
Case 4 – MRI quantification of effects and resolution. (A) shows on an axial MRI image the regions of interest (ROI) defined for the affected areas (suspected abscess in green outline, surrounding oedema in blue outline) and a reference region in the rest of the brain (yellow outline). (B) shows the T2 MRI signal hyperintensity of the affected areas relative to the unaffected brain area as a control and the variability of the signal in the affected area (standard deviation); * shows the return to normal signal in the brain area, ratio value = 1, relative to signal variability from the PRIME-DE normative data cohort.

References

    1. Basso M.A. Using non-invasive neuroimaging to enhance the care, well-being and experimental outcomes of laboratory non-human primates (monkeys) Neuroimage. 2021;228 - PMC - PubMed
    1. Bradley Jr W. MR appearance of hemorrhage in the brain. Radiology. 1993;189(1):15–26. - PubMed
    1. Luan L. Pharmacological MRI (phMRI) monitoring of treatment in hemiparkinsonian rhesus monkeys. Cell Transplant. 2008;17(4):417–425. - PMC - PubMed
    1. Li C.-.X. Longitudinal MRI evaluation of ischemic stroke in the basal ganglia of a rhesus macaque (Macaca mulatta) with seizures. Comp. Med. 2018;68(6):496–502. - PMC - PubMed
    1. Sadoun A. Cognitive impairment in a young marmoset reveals lateral ventriculomegaly and a mild hippocampal atrophy: a case report. Sci. Rep. 2015;5(1):1–11. - PMC - PubMed

Publication types

MeSH terms