. 2014 Feb;13(2):407-19.
doi: 10.1074/mcp.M113.028639. Epub 2013 Dec 8.

Both targeted mass spectrometry and flow sorting analysis methods detected the decreased serum apolipoprotein E level in Alzheimer's disease patients

Affiliations

Both targeted mass spectrometry and flow sorting analysis methods detected the decreased serum apolipoprotein E level in Alzheimer's disease patients

Sun-Ho Han et al. Mol Cell Proteomics. 2014 Feb.

Abstract

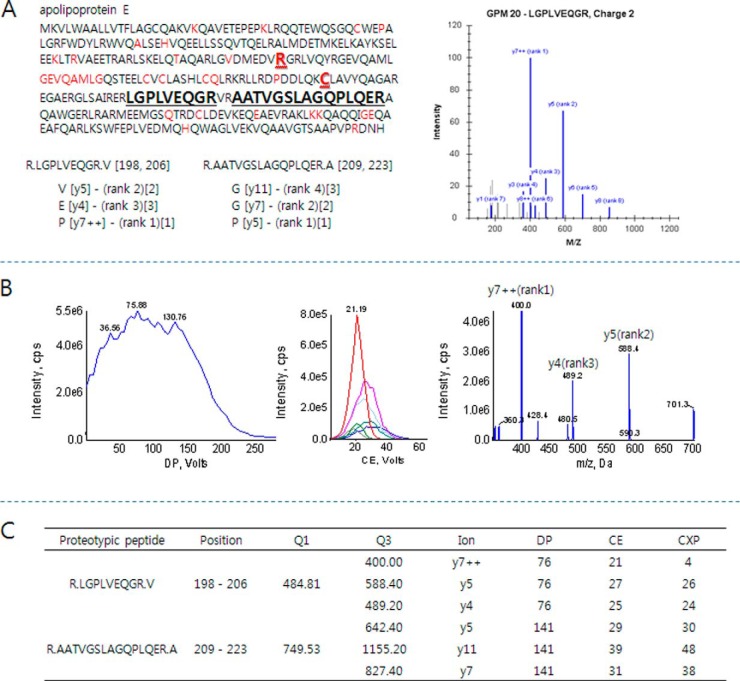
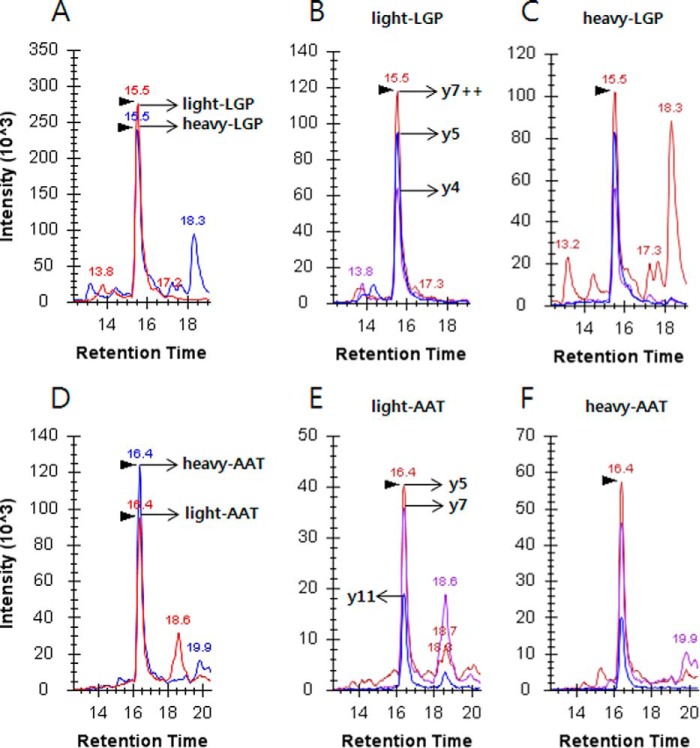
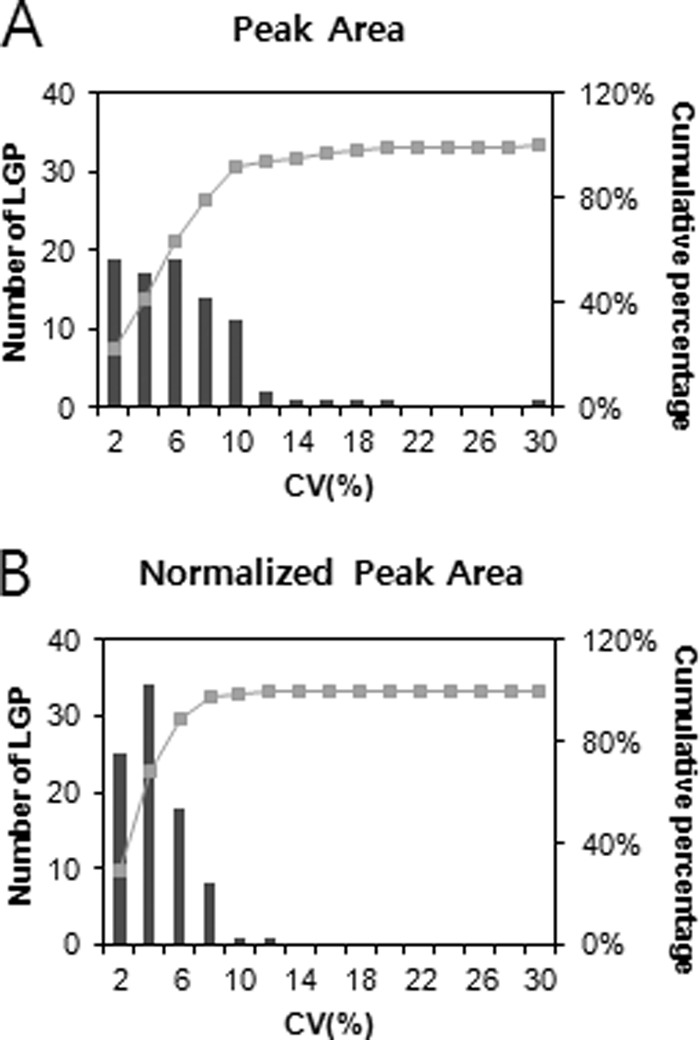
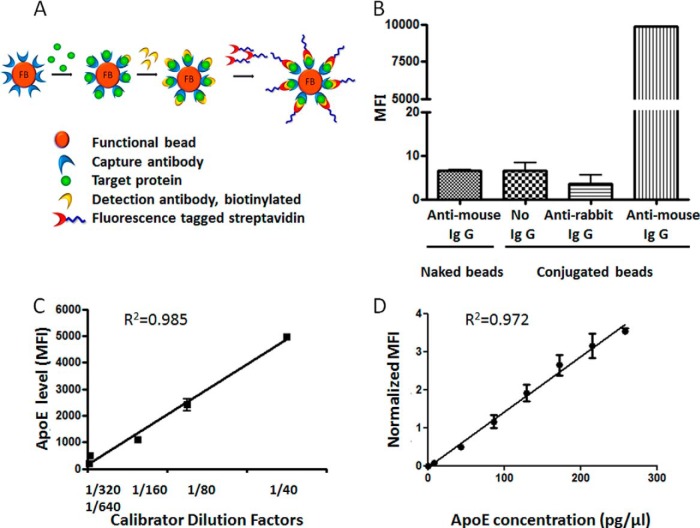
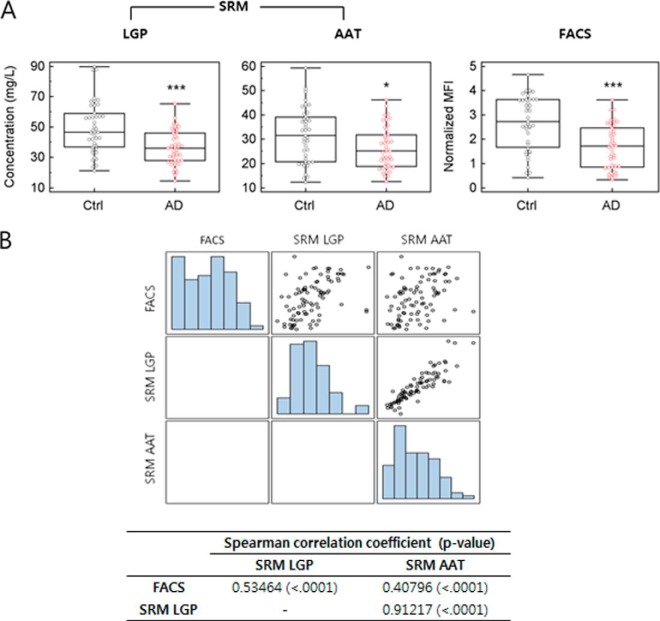
Apolipoprotein E (ApoE) polymorphism has been appreciated as a valuable predictor of Alzheimer disease (AD), and the associated ε4 allele has been recognized as an indicator of susceptibility to this disease. However, serum ApoE levels have been a controversial issue in AD, due to the great variability regarding the different target detection methods, ethnicity, and the geographic variations of cohorts. The aim of this study was to validate serum ApoE levels in relation to AD, particularly using two distinct detection methods, liquid chromatography-selected reaction monitoring (SRM) mass spectrometry and microsphere-based fluorescence-activated cell sorting (FACS) analysis, to overcome experimental variations. Also, comparison of serum ApoE levels was performed between the level of protein detection by FACS and peptide level by SRM in both control and AD patients. Results from the two detection methods were cross-confirmed and validated. Both methods produced fairly consistent results, showing a significant decrease of serum ApoE levels in AD patients relative to those of a control cohort (43 control versus 45 AD, p < 0.0001). Significant correlation has been revealed between results from FACS and SRM (p < 0.0001) even though lower serum ApoE concentration values were measured in protein by FACS analysis than in peptide-level detections by SRM. Correlation study suggested that a decrease of the serum ApoE level in AD is related to the mini-mental state exam score in both results from different experimental methods, but it failed to show consistent correlation with age, gender, or clinical dementia rating.


Figures

Fig. 1.
Fig. 1.
A representative optimization scheme of a proteotypic peptide (LGPLVEQGR) of ApoE for SRM quantification. A, two proteotypic peptides (bold black) were selected to determine ApoE levels in sera. The peptides representing different isoforms (bold red), ApoE2 and ApoE4, and mutant sequences by single-nucleotide polymorphism (red) were excluded. Highly intense SRM transitions were collected from the GPM database (bracket with rank) and used to select the three most intense transitions for SRM quantification. The three transitions are depicted in square brackets. B, SRM optimization for highly sensitive measurement. The dominant charge state, [M+2H]2+, of the peptide was used to determine the optimized DP value by ramping DP voltage (left). Q1/Q3 scan with a CE voltage ramp was conducted to determine the optimized CE values for each selected transition (middle). Final product ions were collected after optimizing instrumental parameters (right). The three most intense y-ions, y7++, y5, and y4, were selected for further SRM quantification. C, instrumental parameters for the transitions of proteotypic peptides.
Fig. 2.
Fig. 2.
Extracted ion chromatograms of the proteotypic peptides, LGPLVEQGR (top) and AATVGSLAGQPLQER (bottom), of ApoE in a pooled serum. A, integrated intensities of y7++, y5, and y4 of light (red) and heavy (blue) LGPLVEQGR; heavy-to-light ratio was 1:1.12. Heavy peptide indicates stable isotope [13C6,15N4]-labeled arginine. The retention times of each peptide are shown above the individual peaks. For the rest of the analysis, the amount of spiked heavy peptide was fixed at 50 fmol as in A. B, extracted ion chromatogram of the three most intense transitions of light peptide. C, extracted ion chromatogram of heavy peptide with transitions identical to those in B. D–F, another selected proteotypic peptide for SRM quantification. The concentration of the spiked heavy peptide was 50 fmol, and the heavy-to-light ratio was 1.20:1.
Fig. 3.
Fig. 3.
Analytical reproducibility of LGPLVEQGR for 88 samples in SRM. Cumulative frequencies of 88 samples are shown by using raw peak area (top) and normalized peak area to heavy peptide (bottom). The most intense y-ion, y7++, of LGPLVEQGR was used for the measurement.
Fig. 4.
Fig. 4.
Schematic diagram, confirmation, and validation of ApoE capture antibody-conjugated functional beads using FACS analysis. A, the schematic process of target protein detection by FACS analysis using capture antibody-conjugated functional beads. B, the attachment of ApoE capture antibody to functional beads was demonstrated by PE-conjugated anti-mouse IgG treatment. Negative controls were compared, including naked beads, no antibody incubation, and PE-conjugated anti-rabbit IgG incubation. C, D, validation of ApoE capture antibody-conjugated functional beads was performed using serial dilution of calibrator serum (C) and ApoE standard protein (D), showing proportional change of MFI in an ApoE concentration-dependent manner.
Fig. 5.
Fig. 5.
Serum ApoE levels of 43 controls (black) and 45 AD patients (red) were analyzed by SRM and FACS. For SRM measurement, the highly intense y-ions, y7++ of LGPLVEQGR (LGP) and y5 of AATVGSLAGQPLQER (AAT), of two proteotypic peptides representing ApoE were used. A, serum ApoE levels of AD patients were compared with those of controls. B, correlation study between results from SRM and FACS analysis.
Fig. 6.
Fig. 6.
ROC curves generated based on serum ApoE levels in control and AD subjects. A, ROC curves were obtained using results from SRM (LGP, LGPLVEQGR; AAT, AATVGSLAGQPLQER) and FACS-based serum ApoE quantification. AUC-ROCs for serum ApoE levels in AD by LGP SRM, AAT SRM, and FACS analysis were 0.731, 0.637, and 0.752, respectively. B–D, ROC curves were used to investigate the correlation between serum ApoE levels and MMSE score in three sets of ApoE quantifications. AUC-ROCs of serum ApoE levels for MMSE scores ≤ 14 (severe AD) were 0.850, 0.753, and 0.884 in LGP SRM, AAT SRM, and FACS analysis, respectively.

References

    1. Hardy J. A., Higgins G. A. (1992) Alzheimer's disease: the amyloid cascade hypothesis. Science 256, 184–185 - PubMed
    1. Hardy J., Allsop D. (1991) Amyloid deposition as the central event in the aetiology of Alzheimer's disease. Trends Pharmacol. Sci. 12, 383–388 - PubMed
    1. Hardy J., Selkoe D. J. (2002) The amyloid hypothesis of Alzheimer's disease: progress and problems on the road to therapeutics. Science 297, 353–356 - PubMed
    1. Alloul K., Sauriol L., Kennedy W., Laurier C., Tessier G., Novosel S., Contandriopoulos A. (1998) Alzheimer's disease: a review of the disease, its epidemiology and economic impact. Arch. Gerontol. Geriatr. 27, 189–221 - PubMed
    1. Wimo A., Winblad B., Grafstrom M. (1999) The social consequences for families with Alzheimer's disease patients: potential impact of new drug treatment. Int. J. Geriatr. Psychiatry 14, 338–347 - PubMed

Publication types

Substances

LinkOut - more resources