. 2021 Jan 20;9(2):67.
doi: 10.3390/vaccines9020067.

Human Transcriptomic Response to the VSV-Vectored Ebola Vaccine

Affiliations

Human Transcriptomic Response to the VSV-Vectored Ebola Vaccine

Francesco Santoro et al. Vaccines (Basel). .

Abstract

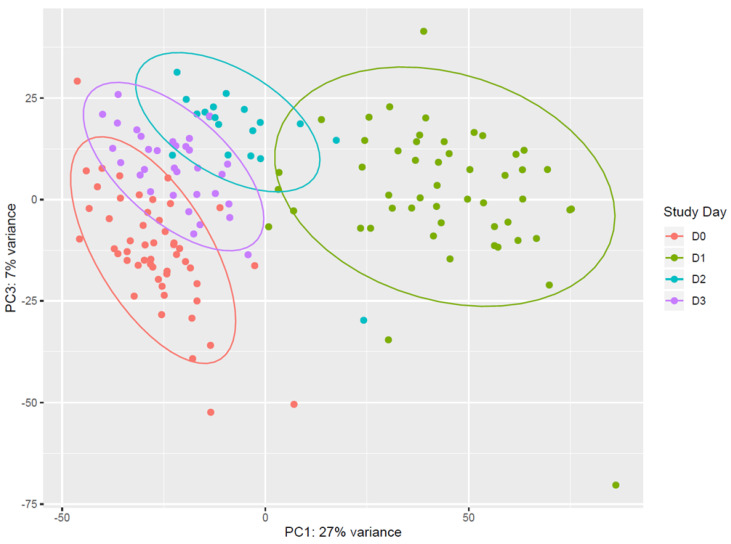
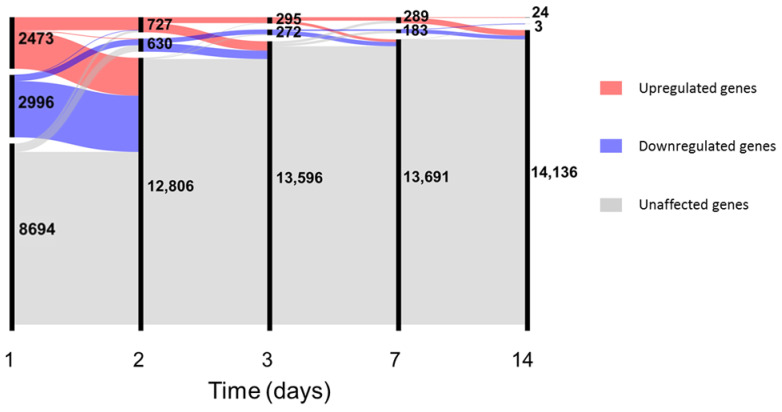
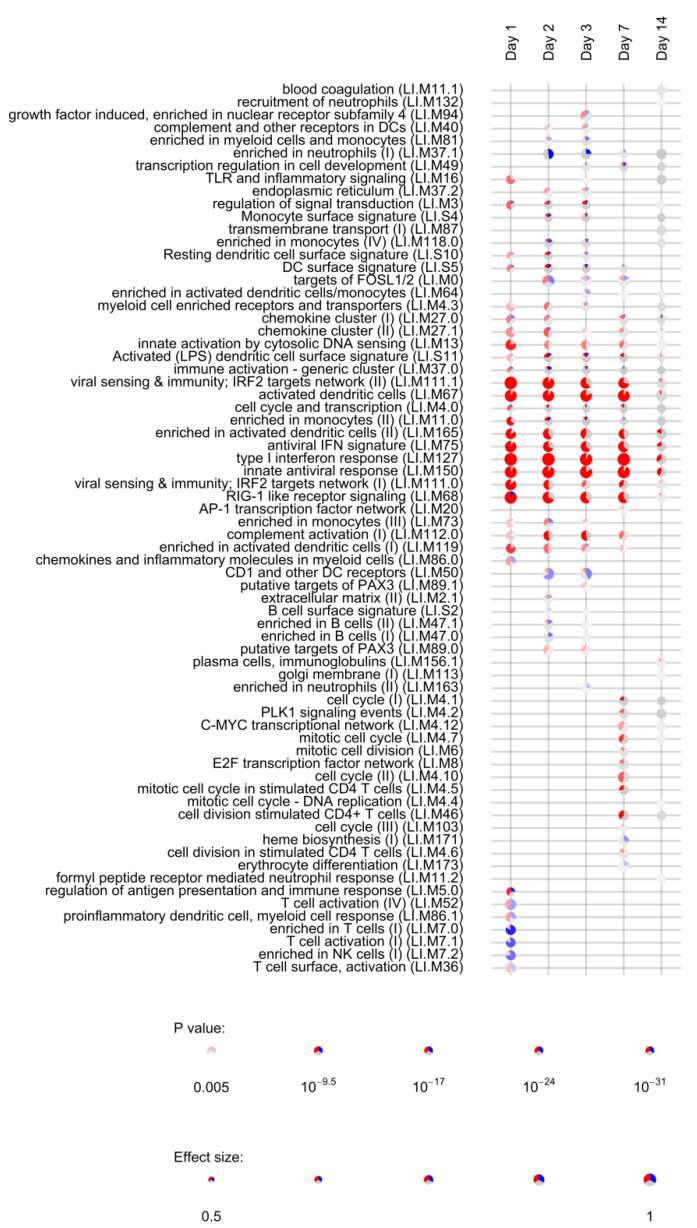
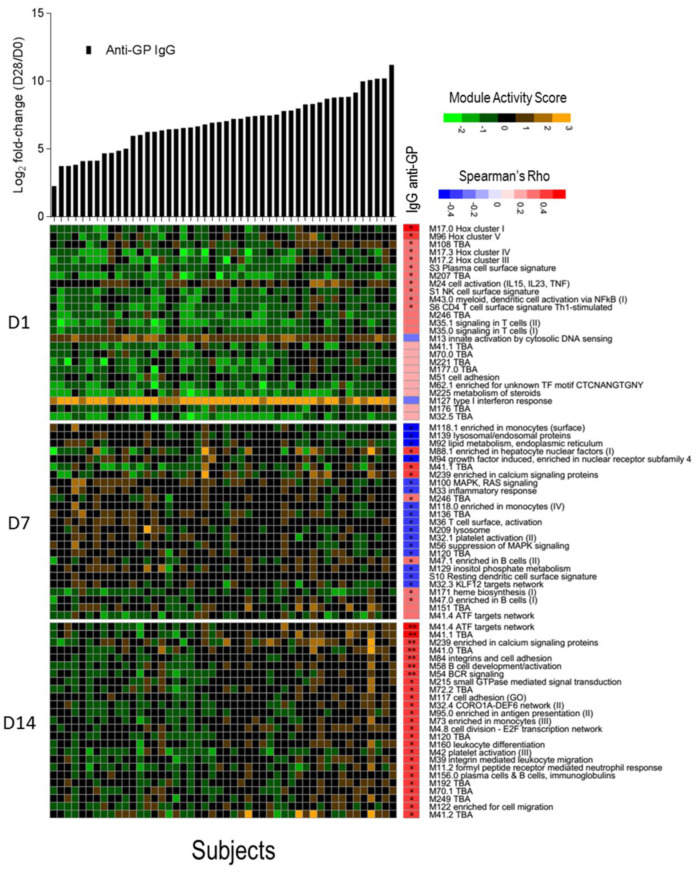
Ebolavirus Disease (EVD) is a severe haemorrhagic fever that occurs in epidemic outbreaks, with a high fatality rate and no specific therapies available. rVSVΔG-ZEBOV-GP (Ervebo®), a live-attenuated recombinant vesicular stomatitis virus vector expressing the glycoprotein G of Zaire Ebolavirus, is the first vaccine approved for prevention of EVD. Both innate and adaptive responses are deemed to be involved in vaccine-induced protection, yet the mechanisms are not fully elucidated. A global transcriptomic approach was used to profile the blood host-response in 51 healthy volunteers enrolled in a phase 1/2 clinical trial. Signatures of the host responses were investigated assessing the enrichment in differentially expressed genes (DEGs) of specific "blood transcription modules" (BTM). Comparison of gene-expression levels showed that vaccination produces a peak of 5469 DEGs at day one, representing 38.6% of the expressed genes. Out of 346 BTMs, 144 were significantly affected by vaccination. Innate immunity pathways were induced from day 1 to day 14. At days 2 and 3, neutrophil modules were downregulated and complement-related modules upregulated. T-cell and cell-cycle associated modules were upregulated at days 7 and 14, while at day 28, no modules remained activated. At day 14, a direct correlation was observed between ZEBOV glycoprotein-specific antibody titres and activation of seven BTMs, including two related to B-cell activation and B cell receptor signalling. Transcriptomic analysis identified an rVSVΔG-ZEBOV-GP-induced signature and demonstrated a direct correlation of blood transcriptomic changes with ZEBOV glycoprotein-specific antibody titres.

Keywords: Ebolavirus Disease; VSV-ZEBOV; live viral vector; recombinant VSV; transcriptomics; vaccine.


Conflict of interest statement

The authors declare no conflict of interest. The funders had no role in the design of the study; in the collection, analyses, or interpretation of data; in the writing of the manuscript, or in the decision to publish the results.

Figures

Figure 1
Figure 1
Principal component analysis of gene expression. Data from pre-vaccination (D0, red) and from the first 3 days after vaccination (D1, green; D2, light blue; D3, purple.) are reported in the principal component analysis (PCA) plot. Each dot represents a sample and the distance between samples reflects the variance in gene expression. Plot indicates a clear clustering of data by day of sampling. D0 and D1 data are very well separated along the PC1 axis, and appear more distributed along the PC3 axis than D2 and D3. Data from D2 and D3 are well separated from D1, while they tend to cluster with D0. Coloured ellipses define the normal confidence interval (95%) for each group of samples. Principal Component 1 (27% of total variance) and Principal Component 3 (7% of total variance) were chosen for this plot, as the plot produced using Principal Component 1 and Principal Component 2 (11% of total variance) was less discriminative (data not shown).
Figure 2
Figure 2
Number of differentially expressed genes up to day 14. In the alluvial plot, each vertical line represents a time point, the line is broken in sections proportional to the number of upregulated (red), downregulated (blue) and unaffected (grey) genes. Changes in composition of the different sections are shown by the lines connecting the time points. Data for plot construction were retrieved from the glmTreat analysis with edgeR. Days 21 and 28 are not shown since no differentially expressed genes (DEGs) were detected.
Figure 3
Figure 3
Activation of blood transcription modules by rVSVΔG-ZEBOV vaccination. Each column represents a study day after vaccination. Activation of modules was tested using the false discovery rate (FDR)-ranked lists of genes generated by edgeR glmTreat fitting and applying the CERNO test. Rows indicate different blood transcription modules, which were significantly (FDR < 0.005) activated in at least one time point. Each module is represented by a pie in which the proportion of significantly upregulated and downregulated genes is shown in red and blue, respectively. The grey portion of the pie represents genes that are not significantly differentially regulated. The significance of module activation is proportional to the intensity of the pie, while the effect size (Area Under the Curve) is proportional to its size.
Figure 4
Figure 4
Correlation between activation of blood transcription modules (BTMs) and antibody titres. The gene expression of gene members of each module was collapsed in a single module activity score, defined as the mean value of normalized gene expression of gene member compared to the baseline level. Positive score indicates an increase in gene expression, negative score a decrease. Heat map of module activity scores (rows) and subjects (columns). Upper panel shows log2 fold increase (day 28/day 0) in each subject of total IgG anti-glycoprotein (GP) (in black). Subjects are ranked by fold increase of the total IgG anti-GP. A correlation analysis was performed calculating Spearman’s Rho coefficient between fold increase in antibody titres and module activity score. For each day, the top 25 modules ranked by absolute Spearman’s Rho correlation with anti-GP IgGs (right panel) are reported. Statistical significance of each correlation is reported within the correlation boxes ** = adjusted p-value < 0.05 (Benjamini–Hochberg method), * = p-value < 0.05.

References

    1. Ebola Virus Disease. [(accessed on 7 December 2020)]; Available online: https://www.who.int/news-room/fact-sheets/detail/ebola-virus-disease.
    1. 2014–2016 Ebola Outbreak in West Africa|History|Ebola (Ebola Virus Disease)|CDC. [(accessed on 7 December 2020)]; Available online: https://www.cdc.gov/vhf/ebola/history/2014-2016-outbreak/index.html.
    1. Dixon M.G., Schafer I.J. Centers for Disease Control and Prevention (CDC) Ebola Viral Disease Outbreak—West Africa, 2014. MMWR Morb. Mortal. Wkly. Rep. 2014;63:548–551. - PMC - PubMed
    1. Ebola Health Update—North Kivu/Ituri, DRC, 2018–2020. [(accessed on 7 December 2020)]; Available online: https://www.who.int/emergencies/diseases/ebola/drc-2019.
    1. Vaccine against Ebola: Commission Grants Market Authorisation. [(accessed on 7 December 2020)]; Available online: https://ec.europa.eu/commission/presscorner/detail/en/ip_19_6246.

LinkOut - more resources