Comparative Study
. 2021 Jan 20;13(2):75.
doi: 10.3390/toxins13020075.

Staphylococcus aureus Extracellular Vesicles: A Story of Toxicity and the Stress of 2020

Affiliations
Comparative Study

Staphylococcus aureus Extracellular Vesicles: A Story of Toxicity and the Stress of 2020

Xiaogang Wang et al. Toxins (Basel). .

Abstract

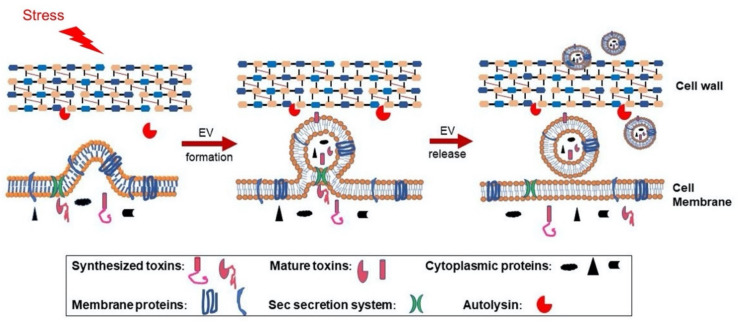
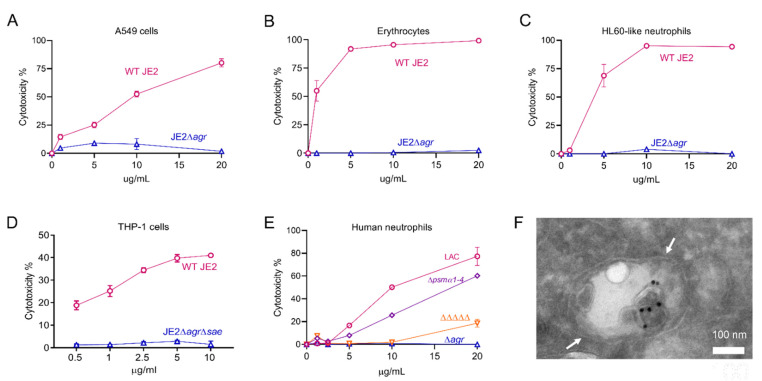
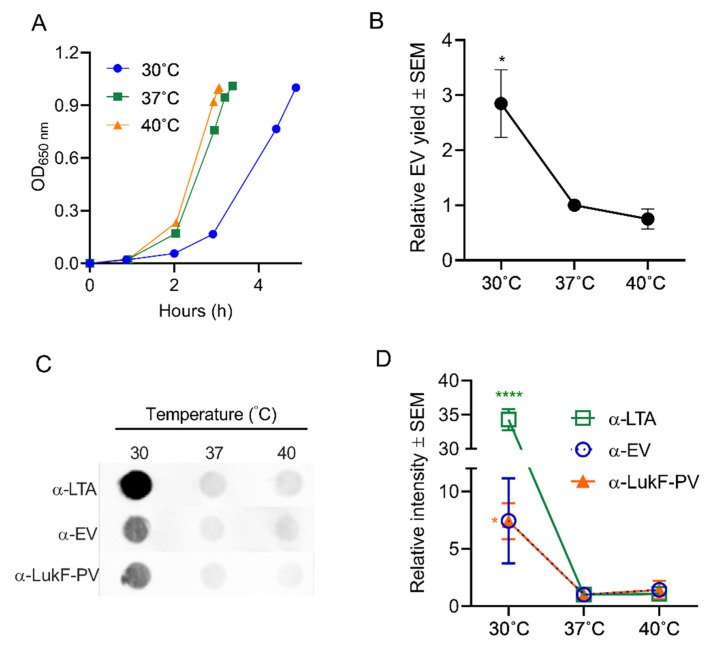
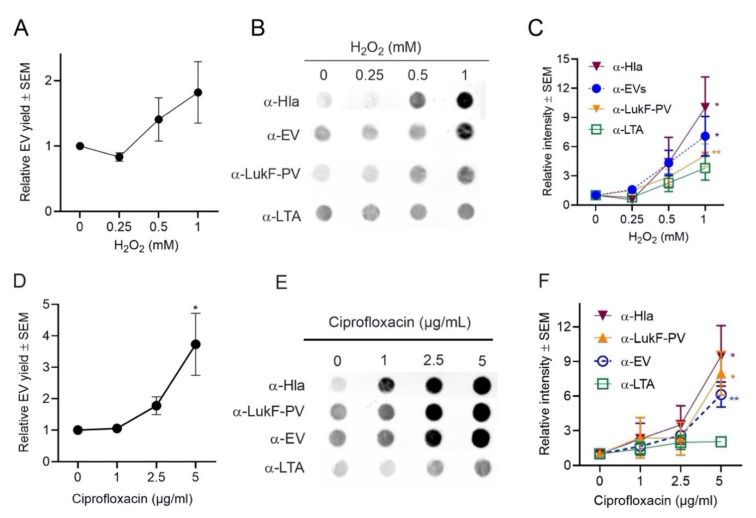
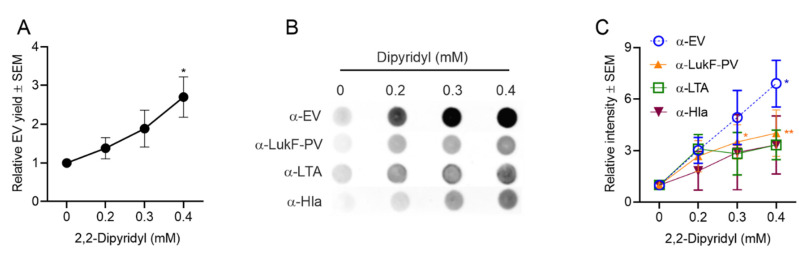
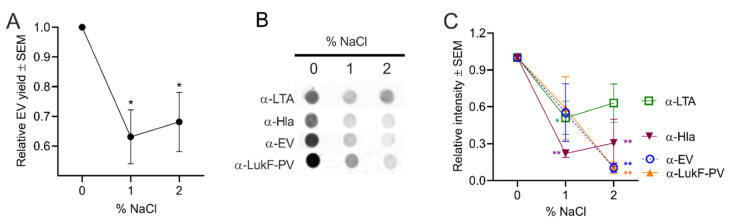
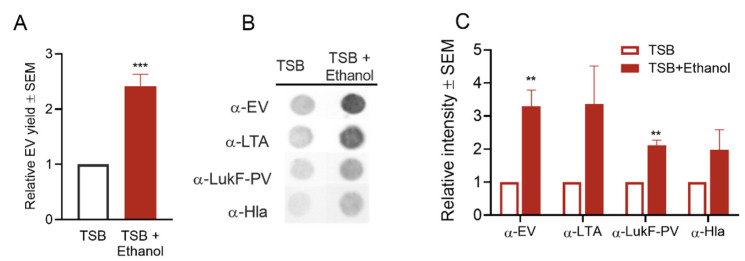
Staphylococcus aureus generates and releases extracellular vesicles (EVs) that package cytosolic, cell-wall associated, and membrane proteins, as well as glycopolymers and exoproteins, including alpha hemolysin, leukocidins, phenol-soluble modulins, superantigens, and enzymes. S. aureus EVs, but not EVs from pore-forming toxin-deficient strains, were cytolytic for a variety of mammalian cell types, but EV internalization was not essential for cytotoxicity. Because S. aureus is subject to various environmental stresses during its encounters with the host during infection, we assessed how these exposures affected EV production in vitro. Staphylococci grown at 37 °C or 40 °C did not differ in EV production, but cultures incubated at 30 °C yielded more EVs when grown to the same optical density.S. aureus cultivated in the presence of oxidative stress, in iron-limited media, or with subinhibitory concentrations of ethanol, showed greater EV production as determined by protein yield and quantitative immunoblots. In contrast, hyperosmotic stress or subinhibitory concentrations of erythromycin reduced S. aureus EV yield. EVs represent a novel S. aureus secretory system that is affected by a variety of stress responses and allows the delivery of biologically active pore-forming toxins and other virulence determinants to host cells.

Keywords: Staphylococcus aureus; extracellular vesicles; stress; toxins.


Conflict of interest statement

The authors declare no conflict of interest.

Figures

Figure 1
Figure 1
Proposed model for S. aureus extracellular vesicle (EV) biogenesis. EVs are formed from the bacterial cytoplasmic membrane due to turgor pressure, and this process is modulated by environmental stresses or by S. aureus PSMα peptides, which have surfactant-like activity, enhancing membrane curvature and EV formation. During biogenesis, selective cytoplasmic proteins and membrane proteins are packaged within EVs. Although S. aureus exoproteins are normally processed by the Sec machinery and released into the culture supernatant, the bacterial secretome includes EV toxin cargo. If exoproteins are transported to the EV lumen or associate with the membrane when Sec-mediated secretion occurs at the junction between the EV and the mother cell, the toxins are likely to lose their signal peptides, fold properly, and demonstrate biological activity. EVs released from the cytoplasmic membrane must traverse the highly cross-linked bacterial cell wall before release, and this process is promoted by S. aureus autolysins, such as Sle1 [24], which reduce cell wall crosslinking by hydrolyzing specific linkages within the peptidoglycan. PSM: Phenol-soluble modulins.
Figure 2
Figure 2
Purification of EVs from S. aureus cultures harvested at the post-exponential growth phase. Culture supernatants were filtered and concentrated 25-fold with a 100-kDa tangential flow filtration system, and the EVs were pelleted by ultracentrifugation. To remove non-membranous proteins, protein aggregates, and other contaminants, the EV sample was further purified by Optiprep density gradient ultracentrifugation. Gradient fractions were subjected to SDS-PAGE and silver stained. Fractions (#4–7) enriched for EVs were pooled, concentrated by diafiltration with phosphate buffered saline (PBS), and filtered. The purified EVs were negatively stained and examined by transmission electron microscopy.
Figure 3
Figure 3
Cytotoxicity and cellular entry of S. aureus EVs. (A) Human lung A549 lung epithelial cells, (B) rabbit erythrocytes, (C) neutrophil-like HL60 cells, (D) THP-1 macrophages or (E) human neutrophils were incubated with increasing concentrations of EVs produced by indicated S. aureus WT or mutant strains, and cytotoxicity was evaluated. Each sample was tested in duplicate, and two independent experiments were performed with similar results. A representative experiment is shown. (F) Differentiated THP-1 macrophages were incubated with S. aureus EVs for 30 min. A representative electron micrograph shows antibody-labeled EVs (black dots) internalized within a macrophage endosomal compartment, denoted by white arrows.
Figure 4
Figure 4
Effect of temperature on EV production. (A) S. aureus was cultivated in 100 mL tryptic soy both (TSB) at the indicated temperatures until an OD of 1 was achieved. (B) EV production quantified by relative protein yield (compared to 37 °C cultures) or (C) by reactivity of dot immunoblots of EV suspensions with indicated antibodies. Dot bots were performed at least three times, and a representative image is presented. (D) Mean relative intensity values (compared to 37 °C cultures) pooled from 3 independent immunoblot experiments are shown. One-way ANOVA with Dunnett’s multiple comparison tests were used for statistical analyses of protein yield and relative intensity of dot blot images. * p < 0.05, **** p < 0.0001.
Figure 5
Figure 5
EV production was enhanced by oxidative stress. (A) EV production from S. aureus grown in TSB supplemented with indicated concentrations of H2O2 was evaluated by quantification of relative EV protein yield or (B) by dot blots of EV suspensions probed with indicated antibodies. (C) Relative intensity of dot blot images pooled from 3 to 4 independent experiments are shown. (D) EV production by S. aureus grown in TSB supplemented with indicated concentrations of ciprofloxacin was evaluated by quantification of relative EV protein yield or (E) by dot immunoblots of EV suspensions probed with indicated antibodies. (F) Relative intensity of dot blot images pooled from 3 to 4 independent experiments are shown. EV protein yield was determined from at least three independent experiments. One-way ANOVA with Dunnett’s multiple comparison tests were used for statistical analysis of protein yield and relative intensity of dot blot images. * p < 0.05, ** p < 0.01.
Figure 6
Figure 6
S. aureus EV production was enhanced in iron-depleted media as determined by (A) quantification of relative EV protein yield and (B) dot immunoblots of EV suspensions with indicated antibodies. (C) Relative intensity of dot blot images was assessed from 3 to 4 independent experiments, and a representative dot blot is shown. EV protein yield was analyzed from at least three independent experiments. One-way ANOVA with Dunnett’s multiple comparison tests were used for statistical analysis of protein yield and relative intensity of dot blot images. * p < 0.05, ** p < 0.01.
Figure 7
Figure 7
S. aureus EV production was reduced by osmotic stress. (A) EV production from S. aureus grown in TSB supplemented with 1 to 2% NaCl was evaluated by quantification of relative EV protein yield or (B) by dot immunoblots of EV suspensions probed with indicated antibodies. (C) Relative intensity of dot blot images pooled from three independent experiments are shown, and a representative blot is shown. EV protein yield was analyzed from three independent experiments. One-way ANOVA with Dunnett’s multiple comparison tests were used for statistical analysis of protein yield and relative intensity of dot blot images. *p < 0.05, ** p < 0.01.
Figure 8
Figure 8
S. aureus EV production was enhanced by ethanol stress. (A) Quantification of relative EV protein yield and (B) dot blots of EV suspensions probed with indicated antibodies showed increases in EV production from cultures with added ethanol. (C) The relative intensity of dot blot images pooled from 3 independent experiments was calculated, and a representative image is shown in (B). EV protein yield was calculated from three independent experiments. ** p < 0.01, *** p < 0.001, as determined by the Student t-test.

References

    1. Tong S.Y.C., Davis J.S., Eichenberger E., Holland T.L., Fowler V.G. Staphylococcus aureus Infections: Epidemiology, Pathophysiology, Clinical Manifestations, and Management. Clin. Microbiol. Rev. 2015;28:603–661. doi: 10.1128/CMR.00134-14. - DOI - PMC - PubMed
    1. Giersing B.K., Dastgheyb S.S., Modjarrad K., Moorthy V. Status of vaccine research and development of vaccines for Staphylococcus aureus. Vaccine. 2016;34:2962–2966. doi: 10.1016/j.vaccine.2016.03.110. - DOI - PubMed
    1. Clarke S.R., Foster S.J. Surface Adhesins of Staphylococcus aureus. Adv. Microb. Physiol. 2006;51:187–224. doi: 10.1016/s0065-2911(06)51004-5. - DOI - PubMed
    1. Weidenmaier C., Lee J.C. Structure and Function of Surface Polysaccharides of Staphylococcus aureus. Curr. Top. Microbiol. Immunol. 2015;409:57–93. doi: 10.1007/82_2015_5018. - DOI - PubMed
    1. Reyes-Robles T., Torres V.J. Staphylococcus aureus Pore-Forming Toxins. Curr. Top. Microbiol. Immunol. 2016;409:121–144. doi: 10.1007/82_2016_16. - DOI - PubMed

Publication types

MeSH terms