. 2021 Jan 24;11(2):32.
doi: 10.3390/bios11020032.

Dissociation Constant of Integrin-RGD Binding in Live Cells from Automated Micropipette and Label-Free Optical Data

Affiliations

Dissociation Constant of Integrin-RGD Binding in Live Cells from Automated Micropipette and Label-Free Optical Data

Tamás Gerecsei et al. Biosensors (Basel). .

Abstract

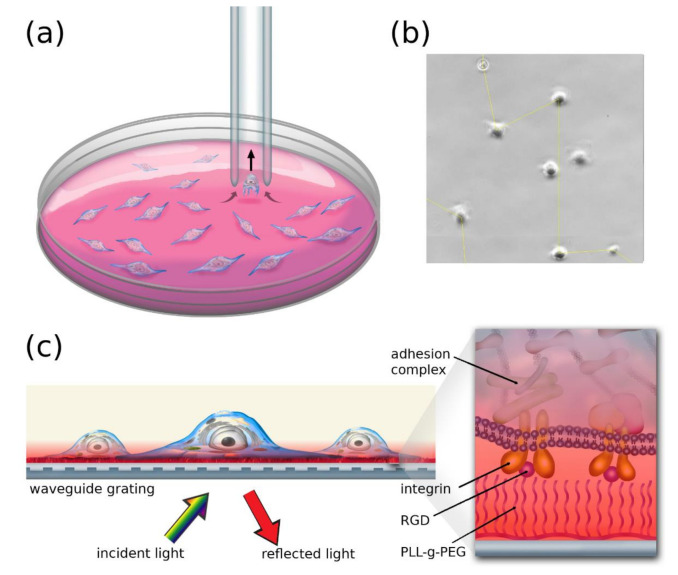
The binding of integrin proteins to peptide sequences such as arginine-glycine-aspartic acid (RGD) is a crucial step in the adhesion process of mammalian cells. While these bonds can be examined between purified proteins and their ligands, live-cell assays are better suited to gain biologically relevant information. Here we apply a computer-controlled micropipette (CCMP) to measure the dissociation constant (Kd) of integrin-RGD-binding. Surface coatings with varying RGD densities were prepared, and the detachment of single cells from these surfaces was measured by applying a local flow inducing hydrodynamic lifting force on the targeted cells in discrete steps. The average behavior of the populations was then fit according to the chemical law of mass action. To verify the resulting value of Kd2d = (4503 ± 1673) 1/µm2, a resonant waveguide grating based biosensor was used, characterizing and fitting the adhesion kinetics of the cell populations. Both methods yielded a Kd within the same range. Furthermore, an analysis of subpopulations was presented, confirming the ability of CCMP to characterize cell adhesion both on single cell and whole population levels. The introduced methodologies offer convenient and automated routes to quantify the adhesivity of living cells before their further processing.

Keywords: adhesion; biosensor; integrin-RGD-binding; micropipette; two-dimensional dissociation constant; waveguide.


Conflict of interest statement

Balint Szabo is the founder of the CellSorter Biotechnology Innovations Company.

Figures

Figure 1
Figure 1
Illustration of the methods used to measure cell adhesion (a). The computer-controlled micropipette (CCMP) automatically visits each detected cell and probes them by applying a preset negative pressure. In the drawing, the targeted cell detaches from the surface and enters the micropipette. The ratio of cells picked up in a round is determined by scanning the area of interest with the optical microscope on which the CCMP is mounted. The size of the Petri dish and the cells are not to scale for better visibility (b). Section of a field of view in a Petri dish containing adhered HeLa cells. The yellow line shows the path of the micropipette that was automatically calculated by the CCMP control software. Note that the two cells that were too close to each other (closer than 70 µm) were excluded from the measurement. (c) Schematic representation of the resonant waveguide-based measurement. The cells adhere to the sensor plate, which is illuminated from below. The intensity of the reflected resonant light is detected by a charge-coupled device (CCD) camera (not shown). The magnified drawing shows the binding of integrins to the arginine-glycine-aspartic acid (RGD)-grafted PLL-g-PEG (PP) layer and the intracellular adhesion complex. Red coloring signifies the evanescent electric field, the intensity of which decreases exponentially into the media above the sensor. The refractive index change is measured within this field through the wavelength shift of the reflected light.
Figure 2
Figure 2
Curves representing the detachment of cells from surfaces with different PPR to PP ratios (Q). (a) Averaging of data: each point corresponds to the average of values measured in three separate experiments, while the error bars represent the standard error. (b) The pooling of data: points correspond to unified datasets coming from three separate experiments.
Figure 3
Figure 3
(a): Histograms of cell detachment calculated from the detachment curves. The inset shows the PPR to PP percentage ratio (Q) of the surfaces on which the cells were seeded. As Q increases, the distributions shift to the right, towards higher detachment pressures. (b) The fit of Equation (6) on the weighted average of all detachment histograms. From the fit, the two-dimensional dissociation constant can be determined. Error bars show the standard error of 3 measurements. (c) Adhesion kinetics of cell populations measured by RWG optical biosensor. Surface coatings with different PPR to PP ratio were used to create different RGD densities. The maximum wavelength shift was fitted for each curve according to Equation (8), and the resulting values were plotted against the RGD density in (d). Here, Equation (6) is fitted on the maximal wavelength values to determine the two-dimensional dissociation constant. Error bars show the standard error of three separate measurements.
Figure 4
Figure 4
Subpopulation analysis of HeLa cells on different RGD densities. (a) Dependence of the fraction of weakly, moderately, and strongly adhered cells on the RGD density. Weak adhesion stands for cells that were picked up in the first round of probing by the negative pressure of 0.07 atm, while strongly adhered cells were not picked up even with a negative pressure of 0.22 atm. Moderate adhesion stands for cells in between the 0.07–0.22 atm range. (b) Heat map of the distribution of cell adhesion. The color scale indicates the ratio of cells having the indicated detachment pressure on the substrate with the given RGD density. It can be observed that the distribution widens and flattens with increasing ligand density.

Similar articles

Cited by

References

    1. Beckerle M.C. Cell Adhesion. Oxford University Press Inc.; New York, NY, USA: 2001.
    1. Slack J.M.W. Principles of Tissue Engineering. 4th ed. Elsevier; Amsterdam, The Netherlands: 2013. Molecular Biology of the Cell. - DOI
    1. Galbraith C.G., Yamada K.M., Sheetz M.P. The relationship between force and focal complex development. J. Cell Biol. 2002;159:695–705. doi: 10.1083/jcb.200204153. - DOI - PMC - PubMed
    1. Dermutz H., Gruter R.R., Truong A.M., Demkó L., Voros J., Zambelli T. Local polymer replacement for neuron patterning and in situ neurite guidance. Langmuir. 2014;30:7037–7046. doi: 10.1021/la5012692. - DOI - PubMed
    1. Saftics A., Turk B., Sulyok A., Nagy N., Gerecsei T., Szekacs I., Kurunczi S., Horvath R. Biomimetic Dextran-Based Hydrogel Layers for Cell Micropatterning over Large Areas Using the FluidFM BOT Technology. Langmuir. 2019;35:2412–2421. doi: 10.1021/acs.langmuir.8b03249. - DOI - PubMed

LinkOut - more resources