. 2021 Jan 22;13(3):412.
doi: 10.3390/cancers13030412.

Lack of Electron Acceptors Contributes to Redox Stress and Growth Arrest in Asparagine-Starved Sarcoma Cells

Affiliations

Lack of Electron Acceptors Contributes to Redox Stress and Growth Arrest in Asparagine-Starved Sarcoma Cells

Christoph Bauer et al. Cancers (Basel). .

Abstract

Amino acids are integral components of cancer metabolism. The non-essential amino acid asparagine supports the growth and survival of various cancer cell types. Here, different mass spectrometry approaches were employed to identify lower aspartate levels, higher aspartate/glutamine ratios and lower tricarboxylic acid (TCA) cycle metabolite levels in asparagine-deprived sarcoma cells. Reduced nicotinamide adenine dinucleotide (NAD+)/nicotinamide adenine dinucleotide hydride (NADH) ratios were consistent with redirection of TCA cycle flux and relative electron acceptor deficiency. Elevated lactate/pyruvate ratios may be due to compensatory NAD+ regeneration through increased pyruvate to lactate conversion by lactate dehydrogenase. Supplementation with exogenous pyruvate, which serves as an electron acceptor, restored aspartate levels, NAD+/NADH ratios, lactate/pyruvate ratios and cell growth in asparagine-deprived cells. Chemicals disrupting NAD+ regeneration in the electron transport chain further enhanced the anti-proliferative and pro-apoptotic effects of asparagine depletion. We speculate that reductive stress may be a major contributor to the growth arrest observed in asparagine-starved cells.

Keywords: asparagine starvation; metabolomics; reductive stress; sarcoma.


Conflict of interest statement

The authors declare no conflict of interest.

Figures
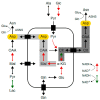
Figure 1
Figure 1
Asparagine synthesis. Mammalian cells maintain intracellular asparagine availability through import from the extracellular space and de novo synthesis from glutamine and aspartate (Asp, marked in yellow) through a unidirectional ATP-dependent reaction catalyzed by asparagine synthetase (ASNS). As aspartate transport into most mammalian cells is inefficient, aspartate supply depends on conversion of glutamine to glutamate to alpha-ketoglutarate, which enters the tricarboxylic acid (TCA) cycle and is converted into aspartate via reductive carboxylation (marked in dark gray) or oxidative decarboxylation (marked in light gray). TCA cycle flux and glycolysis are accompanied by a continuous flow of electrons, during which nicotinamide adenine dinucleotide (NAD+) serves as an electron carrier in a continuous cycle of reduction to nicotinamide adenine dinucleotide hydride (NADH) (marked in red) and oxidation back to NAD+ (marked in green).
Figure 2
Figure 2
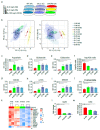
Asparagine depletion in mouse sarcoma cells. Physiological glucose, glutamine and asparagine concentrations in (a) mouse and (b) human plasma. Intracellular asparagine was depleted in mouse sarcoma cells by abrogating asparagine synthesis via shRNA-mediated ASNS knockdown and culture in asparagine-free medium (A-N0). (c) Reduction in intracellular asparagine content in A-N0 cells to <66% of that in shLuc (C-N5) and wild-type (W-N5) sarcoma cells grown in medium containing near-physiological (5 mg/L) asparagine. (d) Minimal ASNS expression in shASNS cells cultured in medium with 5 mg/L or excess (100 mg/L) asparagine; upregulation of ASNS expression in shASNS cells grown in asparagine-free (0 mg/L) medium. Raw data please see Figure S8. (e) Increased processing of LC3I/II in shASNS cells grown in asparagine-free medium for 6 and 24 h. Raw data please see Figure S9. (fg) The growth of shASNS sarcoma cells (red line) was significantly reduced compared to the growth of wild-type cells (blue line) and shLuc control cells (gray line) (f) in asparagine-free medium and (g) in medium containing 5 mg/L asparagine. (h) In medium containing excess asparagine, shASNS and wild-type sarcoma cells grew equally well. Please see Figure S1 for asparagine content of cells measured by LC-MS. Please see Figure S2 (Raw data in Figure S10) and Figure S3 for the impact of asparagine starvation on proliferation, apoptosis and autophagy of mouse sarcoma cells in the context of high, physiological and low glutamine (584.6, 73.1 and 7.3 mg/L, respectively) and high and low glucose (4.5 and 0.5 g/L, respectively) concentrations. Data were evaluated for statistical significance by one-way ANOVA with Tukey’s post-hoc test (ns p ≥ 0.05, * p < 0.05, ** p < 0.01, **** p < 0.0001).
Figure 3
Figure 3
Metabolic adaptation of asparagine-deprived mouse sarcoma cells. (a) Asparagine availability was modified by exposing shASNS (A) sarcoma cells, shLuc control (C) sarcoma cells and wild-type (W) sarcoma cells to asparagine-free medium, medium containing near-physiological (5 mg/L) or supraphysiological asparagine concentrations (100 mg/L) for 2 days. Global metabolomic changes were investigated by GC-MS: samples were run in three independent experiments with four replicates per condition (experiment 1: 1-W-N0, 1-W-N5, 1-W-N100; experiment 2: 2-A-N0, 2-A-N5, 2-A-N100, 2-W-N5; experiment 3: 3-C-N0. 3-C-N5. 3-C-N100, 3-W-N5). Each of the three experiments included wild-type control cells grown at physiological asparagine concentrations (1-W-5, 2-W-N5, 3-W-N5). For each experiment, MS data from W-5 runs were averaged and then used to normalize MS data obtained for the other samples. (b) Principal component analyses highlighted global differences in the metabolome of shASNS cells cultured with 0 (2-A-N0; marked in red) or 5 mg/L (2-A-N5; marked in yellow) asparagine as opposed to shLuc and wild-type control cells (marked in shades of blue). After supplementation with 100 mg/L asparagine (2-A-N100, marked in green), shASNS cells clustered with shLuc and wild-type cells. Further analyses by LC-MS revealed that the metabolome of asparagine-deprived A-N0 sarcoma cells grown without supplemental asparagine was marked by (c) low aspartate, (d) glutamate and (e) glutamine levels compared to control C-N5 and W-N5 cells. (f) Higher aspartate/glutamine ratios suggest that glutamine is shunted towards aspartate synthesis in asparagine-deprived N0 cells. Reduced (g) citrate, (h) alpha-ketoglutarate and (i) malate levels in asparagine-starved A-N0 compared to control C-N5 and W-N5 cells further support (j) redirection of TCA cycle flux in asparagine-starved A0 cells. (cj) Supplementation with excess asparagine (A-N100) partially reverted aspartate/glutamine ratios and aspartate, glutamate, glutamine, citrate, alpha-ketoglutarate and malate content to levels similar to those in control C-N5 and W-N5 cells. The transcriptome of asparagine-depleted A-N0 and A-N5 mouse sarcoma cells was evaluated by RNA-Seq and compared to A-N100 and C-N5 cells. (k) Pathway analyses using the Kyoto Encyclopedia of Genes and Genomes (KEGG) database demonstrated that one of the three top pathways enriched among transcripts upregulated in asparagine-depleted cells was oxidative phosphorylation (false discovery rate (FDR) < 0.05). Higher transcript levels of the (l) alpha-ketoglutarate dehydrogenase subunit OGDHL and the (m) succinate dehydrogenase subunit SDHB in asparagine-starved A-N0 compared to A-N100 and control C-N5 cells were confirmed by PCR. Please see Figures S4 and S5 for transcripts upregulated in asparagine-depleted cells and involved in aminoacyl transfer RNA (tRNA) biosynthesis and ribosome. Please see Table S1 for lists of metabolites detected in cell lysates by GC-MS, Table S2 for transcripts upregulated (FDR < 0.05) in A-N0 and A-N5 versus A-N100 and C-N5 cells and Table S3 for pathways enriched (FDR<0.05) in A-N0 and N-N5 cells compared to A-N100 and C-N5 cells. Data were evaluated for statistical significance by one-way ANOVA with Tukey’s post-hoc test (ns p ≥ 0.05, * p < 0.05, ** p < 0.01, *** p < 0.001, **** p < 0.0001).
Figure 4
Figure 4
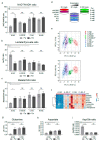
Reversal of altered metabolic flux/reductive stress in asparagine-depleted mouse sarcoma cells by supplementation with pyruvate. (a) Relative lack of electron acceptors as evidenced by reduced NAD+/NADH rations was consistent with reductive stress in asparagine-starved A-N0 cells compared to control cells cultured in near-physiological asparagine conditions (C-N5, W-N5). Pyruvate and asparagine supplementation rescued the reduced NAD+/NADH ratios in asparagine-depleted sarcoma cells. Pyruvate and asparagine supplementation also reversed the (b) increased lactate/pyruvate ratios and (c) reduced malate/oxaloacetate ratios in A-N0 compared to C-N5/W-N5 cells. (d) Asparagine-deprived shASNS cells (A-N0) were grown in medium containing 0mg/L asparagine, 5 mg/L asparagine and 100 mg/L asparagine and supplemented with exogenous pyruvate at a concentration of 88.06 mg/L (1 mM). (e) GC-MS data were evaluated by principal component analysis, which demonstrated reversal of the global metabolomic changes in asparagine-depleted cells (A-N0, marked in red) compared to control cells (marked in shades of blue) after pyruvate supplementation (A-N0-P, marked in pink); shASNS cells grown in medium with excess asparagine are marked in green. (f) Further LC analyses again demonstrated that reversal of metabolic changes in asparagine-depleted cells (A-N0) included TCA cycle metabolites, which were restored in asparagine-depleted cells supplemented with pyruvate (A-N0-P) to levels comparable to those in control cells (C-N5). (g) Pyruvate supplementation restored glutamine levels in asparagine-depleted cells compared to control cells. (h) Pyruvate supplementation raised aspartate levels in asparagine-deprived cells, but these changes did not reach significance. (i) Pyruvate supplementation restored aspartate/glutamine rations in asparagine-depleted cells. Please see Table S4 for lists of metabolites detected in cell lysates by GC-MS. Please see Figure S6 for lower oxygen consumption rates in asparagine-starved compared to control cells. Data were evaluated for statistical significance by one-way ANOVA with Tukey’s post-hoc test (ns p ≥ 0.05, * p < 0.05, ** p < 0.01, *** p < 0.001, **** p < 0.0001).
Figure 5
Figure 5
Metabolic adaptation of mouse sarcoma cells treated with asparaginase. (a) Asparaginase (N-ase) is an FDA-approved drug which catalyzes the breakdown of asparagine. (b) Cells were treated with asparaginase (W-A) or vehicle (W-0) in the presence or absence of supplemental asparagine at a concentration of 100 mg/L. (c) The global metabolome of asparaginase-treated sarcoma cells grown with exogenous asparagine (W-A-N100) was evaluated by GC-MS and clustered with asparaginase-treated cells cultured in asparagine-free medium (W-A-N0), but there were marked differences between asparaginase-treated (W-A-N0, W-A-N100) and control sarcoma (W-0-N0, W-0-N100) cells. (dg) Alterations in metabolic flux included (d) lower citrate, (e) lower alpha-ketoglutarate and (f) lower malate levels in asparaginase-treated (W-A-N0, W-A-N100) compared to vehicle-treated control (W-0-N0, W-0-N100) cells. (g) Overall, the changes observed in asparaginase-treated cells recapitulated the metabolic changes observed in asparagine-deprived shASNS cells cultured in asparagine-free medium compared to control cells. (hi) The growth-inhibitory effects of asparaginase on mouse sarcoma cells were reversed by supplementation with (h) pyruvate (88.06 mg/L) and (i) aspartate (2.66 g/L)). Please see Table S5 for lists of metabolites detected in cell lysates by GC-MS. Data were evaluated for statistical significance by one-way ANOVA with Tukey’s post-hoc test. Data were evaluated for statistical significance by one-way ANOVA with Tukey’s post-hoc test (ns p ≥ 0.05, * p < 0.05, ** p < 0.01, **** p < 0.0001).
Figure 6
Figure 6
Synergistic growth-inhibitory effects of complex 1 inhibitors and asparaginase on mouse sarcoma cells. (a) Flux through the tricarboxylic acid cycle (TCA) and electron transport chain (ETC) is associated with a continuous flow of electrons, during which NAD+ serves as an electron carrier in continuous cycles of reduction to NADH (e.g., via the TCA cycle) and oxidation back to NAD+ (e.g., via the electron transport chain (ETC)). (b) Mouse sarcoma cells were exposed to low concentrations of the complex 1 inhibitor phenformin, which did not reduce sarcoma cell proliferation. However, combinatorial exposure to phenformin and asparaginase augmented the growth-inhibitory effects of asparaginase alone. Supplementation with the exogenous electron acceptor pyruvate reversed the growth inhibitory effects of phenformin and asparaginase, alone and in combination. (c,d) Two alternative complex 1 inhibitors (metformin and imiquimod) reduced mouse sarcoma cell proliferation and deepened the anti-proliferative effects of asparaginase. Again, the growth-inhibitory effects of asparaginase and metformin/imiquimod alone and in combination were reversed by supplementing cells with pyruvate. Chemicals were added using the following concentrations: phenformin 10 µM, metformin 1 mM, imiquimod 20 µM, asparaginase 0.3 U/mL and pyruvate 88.06 mg/L. Data were evaluated for statistical significance by one-way ANOVA with Tukey’s post-hoc test (ns p ≥ 0.05, **** p < 0.0001).
Figure 7
Figure 7
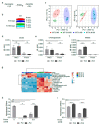
Synergistic growth-inhibitory effects of phenformin and asparaginase on human RD rhabdomyosarcoma cells. In the human rhabdomyosarcoma cell line RD, asparagine deprivation by shASNS knockdown and culture in asparagine-free medium reduced proliferation in (a) supraphysiological glutamine conditions and in (b) physiological glutamine conditions. (a,b) The anti-proliferative effects of asparagine deprivation were reversed by supplementation with exogenous asparagine in (b) a physiological glutamine, but not (a) a supraphysiological glutamine, environment. (a,b) The anti-proliferative effects of asparagine deprivation were reversed by supplementation with exogenous pyruvate in both physiological glutamine and supraphysiological glutamine conditions. (ce) Asparaginase, which hydrolyzes both asparagine and glutamine in the cell environment, (c) reduced the growth and (d,e) raised apoptosis of human RD cells at certain concentrations. (c) Supplementation with exogenous pyruvate reversed the anti-proliferative effects of asparaginase treatment. (d,e) Combinatorial treatment with asparaginase and phenformin deepened the pro-apoptotic effects of asparaginase on RD cells. (f) Phenformin also augmented the growth-inhibitory effects of asparaginase on RD cells. The anti-proliferative effects of phenformin and asparaginase, alone and in combination, were again reversed by addition of pyruvate. (g) NAD+/NADH ratios were reduced in RD cells treated with asparaginase and phenformin alone and in combination. Supplementation with pyruvate partially restored NAD+/NADH ratios in RD cells treated with phenformin alone. Pyruvate also raised the NAD+/NADH ratios in RD cells treated with asparaginase alone or asparaginase and phenformin in combination, but these changes did not reach statistical significance. Chemicals were added using the following concentrations for proliferation assays: phenformin 10 µM, asparaginase 0.3 U/mL and pyruvate 88.06 mg/L. Chemicals were added using the following concentrations for apoptosis assays: phenformin 50 µM and asparaginase 1 U/mL. Please see Figure S7 for metformin and imiquimod effects on RD cells, alone and in combination with asparaginase. Data were evaluated for statistical significance by one-way ANOVA with Tukey’s post-hoc test (ns p ≥ 0.05, * p < 0.05, ** p < 0.01, *** p < 0.001, **** p < 0.0001).
Figure 8
Figure 8
Synergistic growth-inhibitory effects of phenformin and asparaginase on human primary rhabdomyosarcoma cell cultures. Asparaginase and the complex 1 inhibitor imiquimod reduce the proliferation of primary patient-derived human rhabdomyosarcoma cultures (a) Ic pPDX-29_XC, (b) SJRHB011_YC, (c) SJRHB012_ZC and (d) RMS-ZH003_XC. (ad) Simultaneous exposure to asparaginase and imiquimod enhances the anti-proliferative effects of both compounds in all four primary rhabdomyosarcoma cell cultures. Data were evaluated for statistical significance by one-way ANOVA with Tukey’s post-hoc test (** p < 0.01, **** p < 0.0001).

References

    1. Lieu E.L., Nguyen T., Rhyne S., Kim J. Amino acids in cancer. Exp. Mol. Med. 2020;52:15–30. doi: 10.1038/s12276-020-0375-3. - DOI - PMC - PubMed
    1. DeBerardinis R.J., Mancuso A., Daikhin E., Nissim I., Yudkoff M., Wehrli S., Thompson C.B. Beyond aerobic glycolysis: Transformed cells can engage in glutamine metabolism that exceeds the requirement for protein and nucleotide synthesis. Proc. Natl. Acad. Sci. USA. 2007;104:19345–19350. doi: 10.1073/pnas.0709747104. - DOI - PMC - PubMed
    1. Hettmer S., Schinzel A.C., Tchessalova D., Schneider M., Parker C.L., Bronson R.T., Richards N.G., Hahn W.C., Wagers A.J. Functional genomic screening reveals asparagine dependence as a metabolic vulnerability in sarcoma. Elife. 2015;4 doi: 10.7554/eLife.09436. - DOI - PMC - PubMed
    1. Gwinn D.M., Lee A.G., Briones-Martin-Del-Campo M., Conn C.S., Simpson D.R., Scott A.I., Le A., Cowan T.M., Ruggero D., Sweet-Cordero E.A. Oncogenic KRAS Regulates Amino Acid Homeostasis and Asparagine Biosynthesis via ATF4 and Alters Sensitivity to L-Asparaginase. Cancer Cell. 2018;33:91–107. doi: 10.1016/j.ccell.2017.12.003. - DOI - PMC - PubMed
    1. Krall A.S., Xu S., Graeber T.G., Braas D., Christofk H.R. Asparagine promotes cancer cell proliferation through use as an amino acid exchange factor. Nat. Commun. 2016;7:11457. doi: 10.1038/ncomms11457. - DOI - PMC - PubMed