. 2021 Jan 22;9(2):78.
doi: 10.3390/vaccines9020078.

Optimising Vaccine Dose in Inoculation against SARS-CoV-2, a Multi-Factor Optimisation Modelling Study to Maximise Vaccine Safety and Efficacy

Affiliations

Optimising Vaccine Dose in Inoculation against SARS-CoV-2, a Multi-Factor Optimisation Modelling Study to Maximise Vaccine Safety and Efficacy

John Benest et al. Vaccines (Basel). .

Abstract

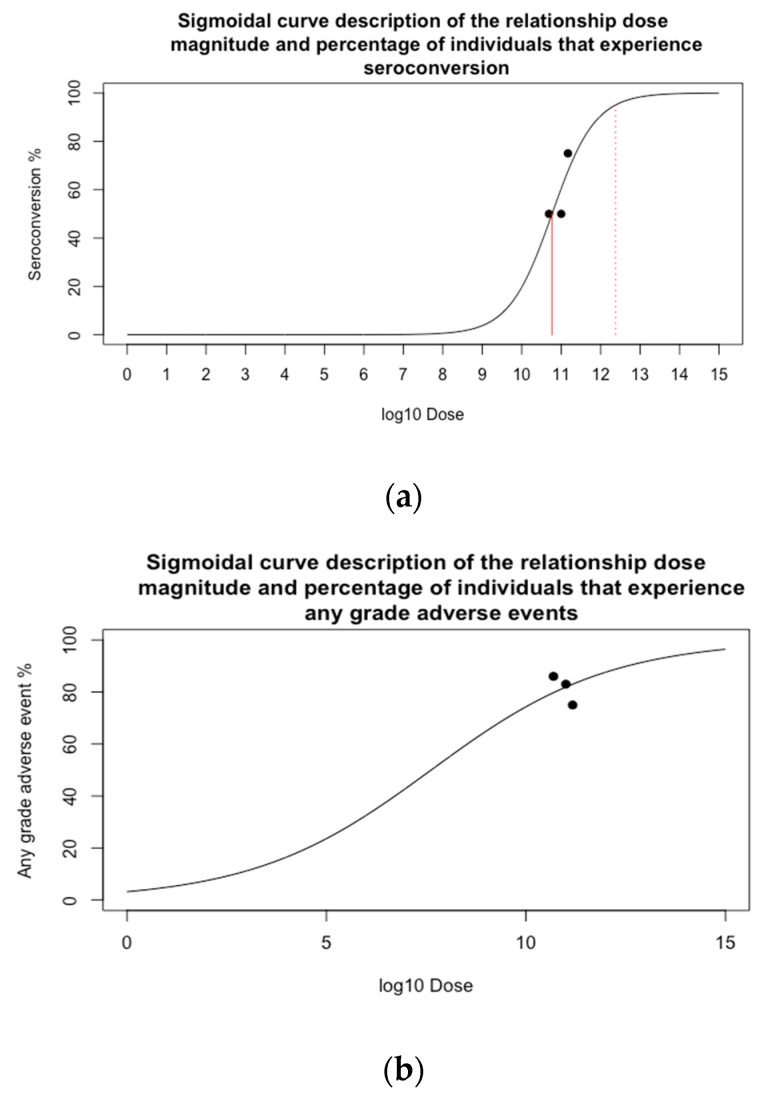
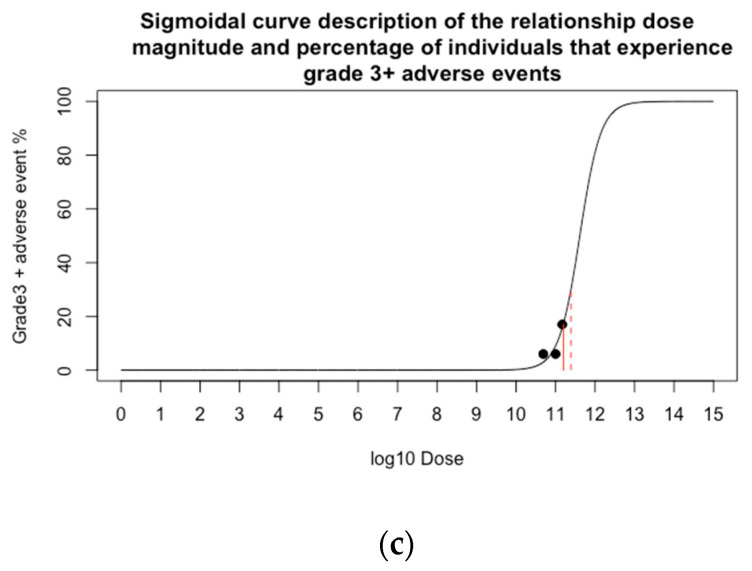
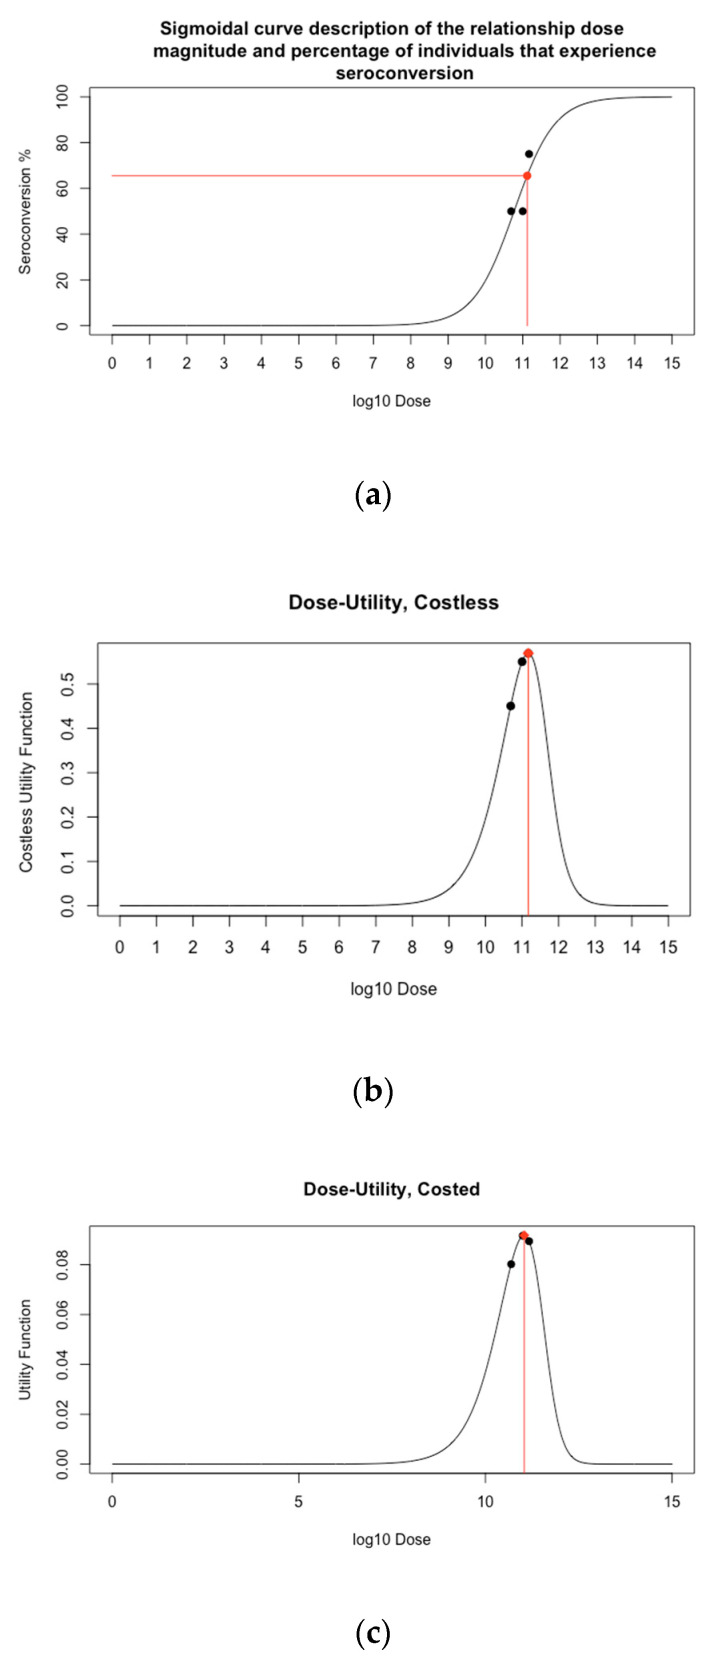
Developing a vaccine against the global pandemic SARS-CoV-2 is a critical area of active research. Modelling can be used to identify optimal vaccine dosing; maximising vaccine efficacy and safety and minimising cost. We calibrated statistical models to published dose-dependent seroconversion and adverse event data of a recombinant adenovirus type-5 (Ad5) SARS-CoV-2 vaccine given at doses 5.0 × 10¹⁰, 1.0 × 10¹¹ and 1.5 × 10¹¹ viral particles. We estimated the optimal dose for three objectives, finding: (A) the minimum dose that may induce herd immunity, (B) the dose that maximises immunogenicity and safety and (C) the dose that maximises immunogenicity and safety whilst minimising cost. Results suggest optimal dose [95% confidence interval] in viral particles per person was (A) 1.3 × 10¹¹ [0.8-7.9 × 10¹¹], (B) 1.5 × 10¹¹ [0.3-5.0 × 10¹¹] and (C) 1.1 × 10¹¹ [0.2-1.5 × 10¹¹]. Optimal dose exceeded 5.0 × 10¹⁰ viral particles only if the cost of delivery exceeded £0.65 or cost per 1011 viral particles was less than £6.23. Optimal dose may differ depending on the objectives of developers and policy-makers, but further research is required to improve the accuracy of optimal-dose estimates.

Keywords: COVID-19; adenovirus-vectored vaccines; dose dynamics; dose-response; dosing.


Conflict of interest statement

This work is partially funded by Vaccitech, a company that is developing novel adenoviral vector vaccines using the vectors ChAdOx1 and ChAdOx2.

Figures

Figure 1
Figure 1
Venn diagram representation of possible outcomes of inoculation, where the left set includes individuals that experience grade 3+ adverse events and the right set includes individuals that experience seroconversion. We aimed to maximise the number of individuals that experience seroconversion and do not experience grade 3+ adverse events, represented in the green segment of the diagram. Black diamonds represent individuals that experience both outcomes, black pentagons represent individuals that experience grade 3+ adverse events with no seroconversion, and black triangles represent individuals that experience neither outcome.
Figure 2
Figure 2
The three curves displaying the relationship between dose and (a) percentage of vaccinated individuals predicted to seroconvert, (b) percentage of vaccinated individuals predicted to experience any grade adverse events and (c) percentage of vaccinated individuals predicted to experience grade 3+ adverse events. The curves are sigmoid curves calibrated to data. Black dots represent the data the curves were calibrated to. In (a) the solid and dashed red lines show respectively the doses for which 50% and 90% of individuals are predicted to seroconvert. In (c) the solid and dashed red lines show respectively the doses for which 17% and 30% of individuals are predicted to experience grade 3+ adverse events. We note that the percentage of individuals experiencing any grade adverse events in (b) qualitatively decreased with increasing dose, whereas the model curve was increasing. This decreasing trend could be explained by the expected stochasticity in the data, hence the sigmoid model did not seem unreasonable (Supplementary S4).
Figure 2
Figure 2
The three curves displaying the relationship between dose and (a) percentage of vaccinated individuals predicted to seroconvert, (b) percentage of vaccinated individuals predicted to experience any grade adverse events and (c) percentage of vaccinated individuals predicted to experience grade 3+ adverse events. The curves are sigmoid curves calibrated to data. Black dots represent the data the curves were calibrated to. In (a) the solid and dashed red lines show respectively the doses for which 50% and 90% of individuals are predicted to seroconvert. In (c) the solid and dashed red lines show respectively the doses for which 17% and 30% of individuals are predicted to experience grade 3+ adverse events. We note that the percentage of individuals experiencing any grade adverse events in (b) qualitatively decreased with increasing dose, whereas the model curve was increasing. This decreasing trend could be explained by the expected stochasticity in the data, hence the sigmoid model did not seem unreasonable (Supplementary S4).
Figure 3
Figure 3
Displays of the predicted utility of doses between 100 and 1015 VP. (a) shows dose-seroconversion, with the horizontal red line indicating the 65.5% seroconversion threshold required for herd immunity. (b) shows the relationship between dose and the costless utility function and (c) shows the relationship between dose and the costed utility function. The black dots represent Table 1. 3 × 10¹¹, (b) 1.5 × 10¹¹ VP and (c) 1.1 × 10¹¹ VP.
Figure 4
Figure 4
Optimal predicted dose for +/− 3 orders of magnitude around CostDelivery. (a) has CostDelivery at a log10 scale and (b) scaled normally. The black line represents the optimal dose, and the red lines indicate the threshold values of CostDelivery for which optimal dose is 1 × 10¹¹ and 5 × 10¹⁰ VP.
Figure 5
Figure 5
Optimal predicted dose (log10 scale) for +/− 3 orders of magnitude (log10 scale) around Cost per 1011 viral particles. Table 1. viral particles at a log10 scale and the right is scaled normally. The black line represents the optimal dose, and the red lines indicate the threshold values of Cost per 1011 viral particles for which the optimal dose was 1 × 10¹¹ and 5 × 10¹⁰ VP.

References

    1. Sharma A., Tiwari S., Deb M.K., Marty J.L. Severe Acute Respiratory Syndrome Coronavirus-2 (SARS-CoV-2): A Global Pandemic and Treatment Strategies. Int. J. Antimicrob. Agents. 2020;56:106054. doi: 10.1016/j.ijantimicag.2020.106054. - DOI - PMC - PubMed
    1. Nicola M., Alsafi Z., Sohrabi C., Kerwan A., Al-Jabir A., Iosifidis C., Agha M., Agha R. The Socio-Economic Implications of the Coronavirus Pandemic (COVID-19): A Review. Int. J. Surg. 2020;78:185–193. doi: 10.1016/j.ijsu.2020.04.018. - DOI - PMC - PubMed
    1. Greenwood B. The Contribution of Vaccination to Global Health: Past, Present and Future. Philos. Trans. R. Soc. B Biol. Sci. 2014;369:20130433. doi: 10.1098/rstb.2013.0433. - DOI - PMC - PubMed
    1. Kaur S.P., Gupta V. COVID-19 Vaccine: A Comprehensive Status Report. Virus Res. 2020;288:198114. doi: 10.1016/j.virusres.2020.198114. - DOI - PMC - PubMed
    1. Rhodes S.J., Knight G.M., Kirschner D.E., White R.G., Evans T.G. Dose Finding for New Vaccines: The Role for Immunostimulation/Immunodynamic Modelling. J. Theor. Biol. 2019;465:51–55. doi: 10.1016/j.jtbi.2019.01.017. - DOI - PMC - PubMed

LinkOut - more resources