. 2021 Feb 16;143(7):713-726.
doi: 10.1161/CIRCULATIONAHA.120.051231. Epub 2021 Jan 27.

Sex-Stratified Gene Regulatory Networks Reveal Female Key Driver Genes of Atherosclerosis Involved in Smooth Muscle Cell Phenotype Switching

Affiliations

Sex-Stratified Gene Regulatory Networks Reveal Female Key Driver Genes of Atherosclerosis Involved in Smooth Muscle Cell Phenotype Switching

Robin J G Hartman et al. Circulation. .

Abstract

Background: Although sex differences in coronary artery disease are widely accepted with women developing more stable atherosclerosis than men, the underlying pathobiology of such differences remains largely unknown. In coronary artery disease, recent integrative systems biological studies have inferred gene regulatory networks (GRNs). Within these GRNs, key driver genes have shown great promise but have thus far been unidentified in women.

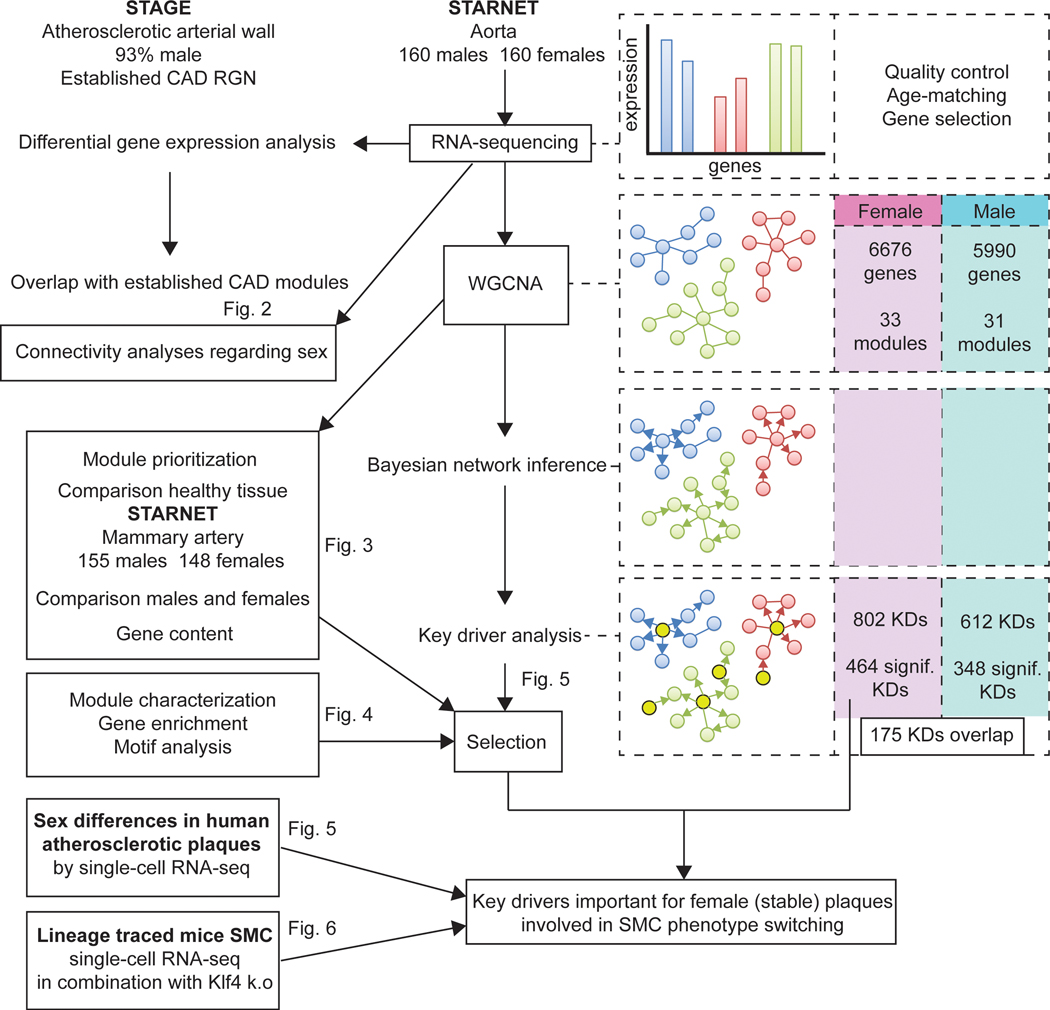
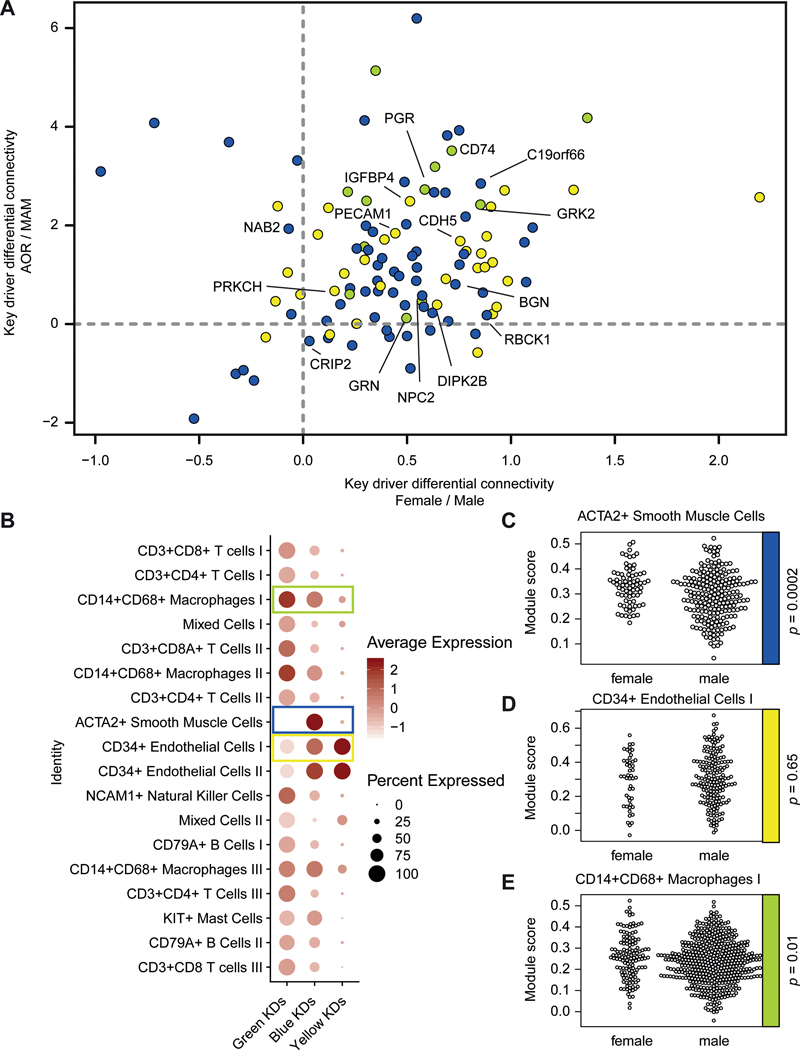
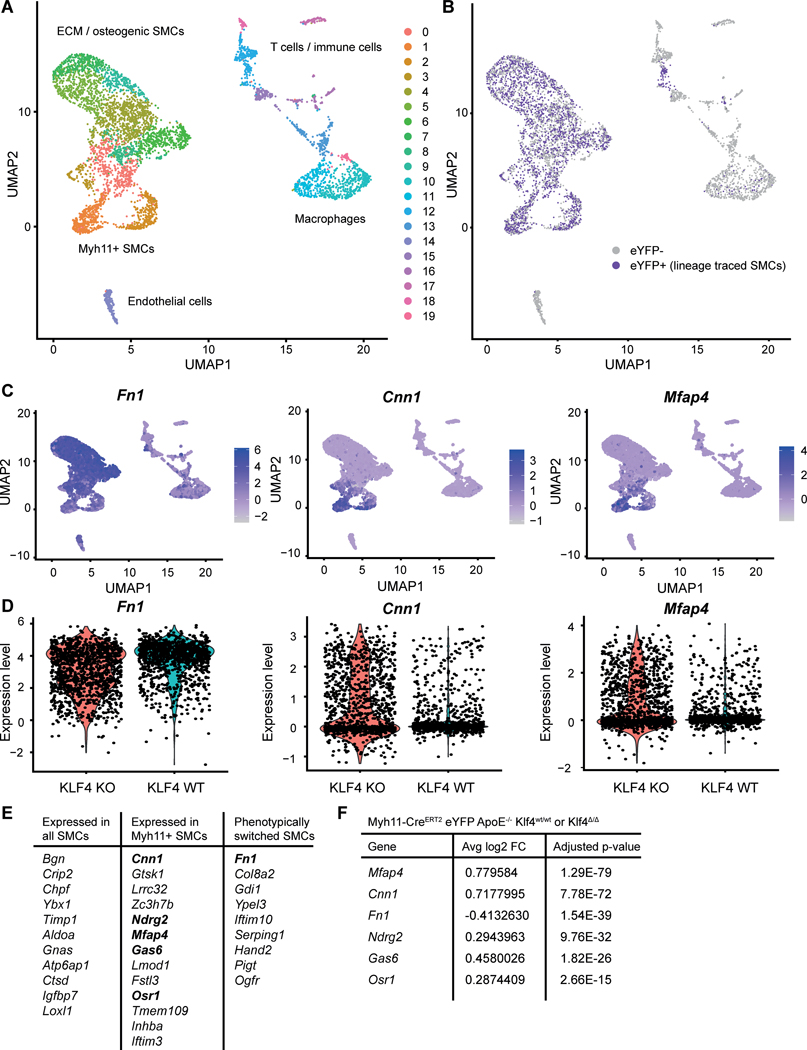
Methods: We generated sex-specific GRNs of the atherosclerotic arterial wall in 160 women and age-matched men in the STARNET study (Stockholm-Tartu Atherosclerosis Reverse Network Engineering Task). We integrated the female GRNs with single-cell RNA-sequencing data of the human atherosclerotic plaque and single-cell RNA sequencing of advanced atherosclerotic lesions from wild type and Klf4 knockout atherosclerotic smooth muscle cell (SMC) lineage-tracing mice.

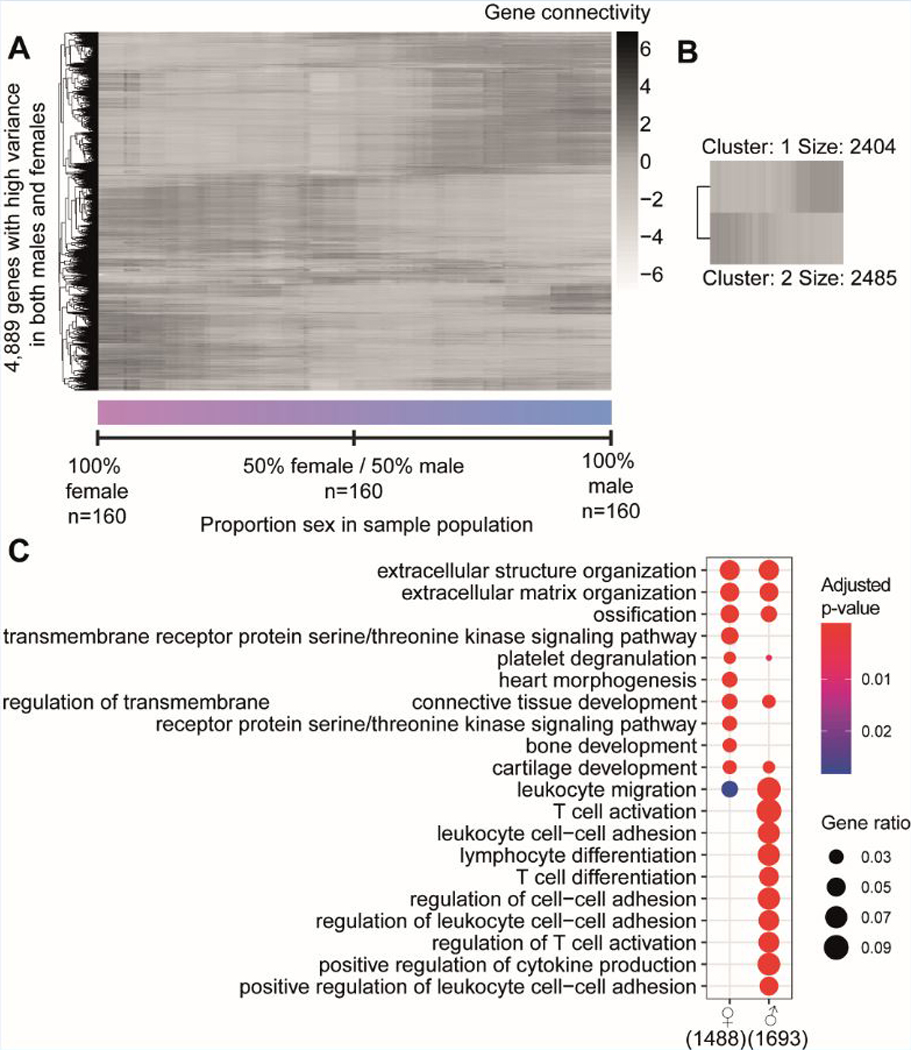
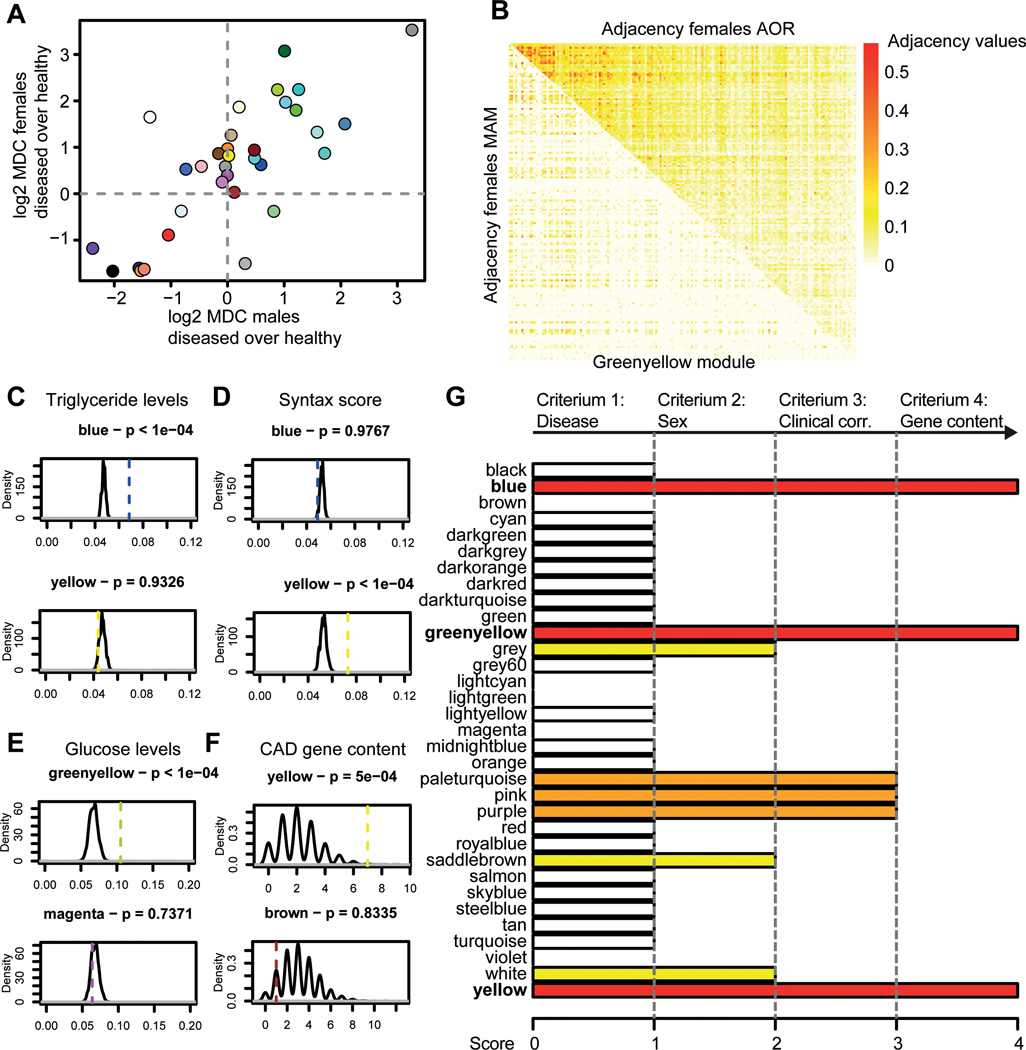
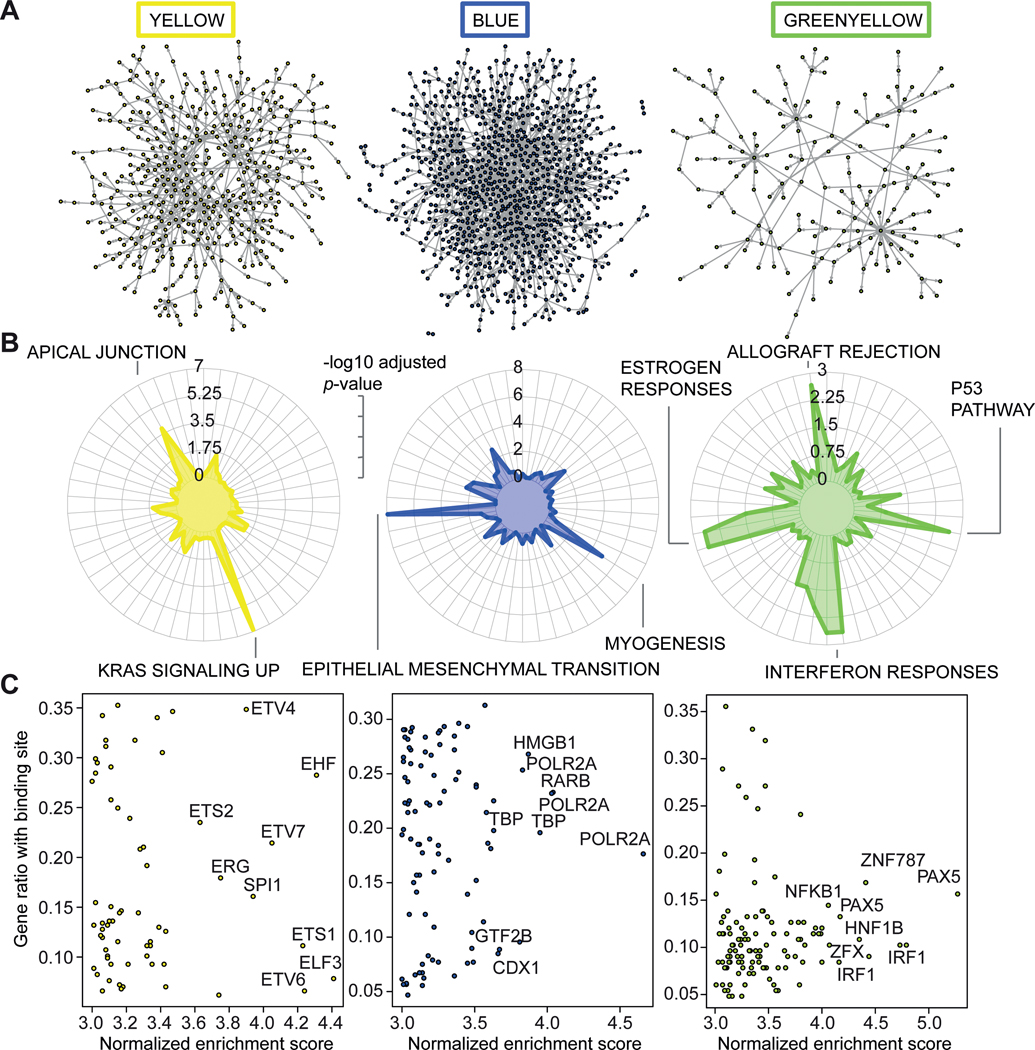
Results: By comparing sex-specific GRNs, we observed clear sex differences in network activity within the atherosclerotic tissues. Genes more active in women were associated with mesenchymal cells and endothelial cells, whereas genes more active in men were associated with the immune system. We determined that key drivers of GRNs active in female coronary artery disease were predominantly found in (SMCs by single-cell sequencing of the human atherosclerotic plaques, and higher expressed in female plaque SMCs, as well. To study the functions of these female SMC key drivers in atherosclerosis, we examined single-cell RNA sequencing of advanced atherosclerotic lesions from wild type and Klf4 knockout atherosclerotic SMC lineage-tracing mice. The female key drivers were found to be expressed by phenotypically modulated SMCs and affected by Klf4, suggesting that sex differences in atherosclerosis involve phenotypic switching of plaque SMCs.

Conclusions: Our systems approach provides novel insights into molecular mechanisms that underlie sex differences in atherosclerosis. To discover sex-specific therapeutic targets for atherosclerosis, an increased emphasis on sex-stratified approaches in the analysis of multi-omics data sets is warranted.

Keywords: atherosclerosis; gene regulatory networks; myocytes, smooth muscle; sex; systems biology; transcriptome.


Conflict of interest statement

Conflict of interest:

There are no conflicts of interest to disclose.

Figures

Figure 1.
Figure 1.. Workflow of sex-stratified GRN analyses.
The workflow of all analyses performed in this study are shown. We started by analysing previous determined CAD GRNs in STAGE (90%+ male) by using DEG data between the sexes from AOR in STARNET. To determine whether connectivity is affected by sex, we calculated gene connectivities in a multitude of populations in which we changed the proportion of females and males. Next, we generated sex-stratified GRNs by WGCNA, Bayesian network inference and key-driver analysis. The number of sex-stratified genes, modules, and key drivers are noted in the right boxes. We prioritized modules created by WGCNA for their importance in female CAD, by comparing how these modules behaved in healthy arterial tissue (MAM) and between the sexes. Further, we correlated the expression of the gene contents with clinical parameters of CAD, measured in STARNET, among which HDL, LDL, TG, glucose, and CRP levels, as well as Syntax score (a measure for the abundance and complexity of coronary atherosclerosis). After prioritization, we annotated the modules and analysed their gene content by gene enrichment analyses and motif analyses. We then selected the key drivers for the female CAD modules and determined their sex-specifc cellular expression by single-cell RNA-sequencing of atherosclerotic plaques. Lastly, we used lineage traced mouse SMC single-cell RNA-seq data to determine female key driver functionality. AOR = atherosclerotic aortic root, CAD = coronary artery disease, GRN = gene regulatory network, MAM = mammary artery, SMC = smooth muscle cell, WGCNA = weighted gene co-expression analysis
Figure 2.
Figure 2.. Sex as a biological variable in network biology.
A) A median-centered heatmap of log2 - connectivity values of 4,889 genes is shown over 160 populations that differ in proportion of sex. The left-most values indicate a population that is 100% female, while the right-most values indicate 100% male. Every step in between from left to right changes the ratio by removing one female sample and adding one male sample. B) A heatmap of k-means clustering of the genes from the connectivity pattern of figure 2A (kmeans k = 2). Two clusters are formed with cluster 1 containing 2,404 genes higher connected in predominantly male populations, while cluster 2 contains 2,485 genes higher connected in female populations. C) Gene enrichment analysis of k-means clusters 1 and 2. Color indicates significance, while size of the dot shows gene ratio. Number indicates the amount of genes from the original cluster that had a use in the analysis.
Figure 3.
Figure 3.. Module prioritization.
A) A scatterplot of module differential connectivity (MDC) values is shown, colors indicate the different WGCNA-generated modules. The x-axis shows log2 MDC values of AOR/MAM in males, while the y-axis shows log2 MDC values of AOR/MAM in females. For example, yellow is higher connected in females in disease (MDC > 1.5), but equally connected in diseased and healthy tissue in males (MDC ~ 0). B) An example of a differentially connected module (greenyellow) is shown in a differential adjacency matrix. Upper triangle of the matrix shows adjacency values of greenyellow in female AOR, while the lower triangle shows female MAM. Color code indicates adjacency, a measure of connectivity, from white (not adjacent) to red (strongly adjacent). C-F) Density plots are shown indicating the distribution of permuted median absolute correlation values to clinical traits (C-E) and overlap with CAD gene content (F). Dashed lines indicate the observed comparator value. Permutation p-values and modules are indicated in the title of the panel. Two examples are given per panel, all comparison can be found in the Suppl. Fig. VI-XV. G) A barplot indicating score for prioritization of modules is shown. We selected 4 criteria to test the WGCNA-generated modules, of which differential connectivity in health and disease, sex-differential connectivity, association to CAD-related clinical parameters, and enrichment for CAD-related gene content. Color indicates score (white = 1, yellow = 2, orange = 3, red (selected) = 4). For example, the yellow module is differentially connected in healthy and diseased tissue, while also being differentially connected between males and females. Yellow is also more associated to clinical parameters for CAD than random genes, and contains more genes relevant to CAD than random genes. AOR = atherosclerotic aortic root, CAD = coronary artery disease, MAM = mammary artery, MDC = module differential connectivity, WGCNA = weighted gene co-expression analysis.
Figure 4.
Figure 4.. Module characterization.
A) Graphical representations of the selected modules (yellow, blue and greenyellow) are shown in their respective colors. Edges (lines) show connections, whereas nodes (dots) show genes. Gene names have been omitted for clarity. B) Hallmark gene enrichments are shown in radar plots for the selected modules. The color highlights the significance of the gene enrichment of genes in their respective modules. The length of the radius measures significance (-log10 adjusted p-value). The most significant terms are highlighted by name, such as KRAS signalling up for yellow, and epithelial mesenchymal transition for blue. C) Promoter motif enrichment scores are shown in scatterplots for the selected modules. X-axis indicates the normalized enrichment score (NES) for the factor, while the y-axis shows the ratio of genes in the module with a binding site for that factor. The factors with the highest NES are highlighted with their gene name.
Figure 5.
Figure 5.. Female CAD key drivers.
A) Gene differential connectivity of the key drivers of the female CAD modules is shown in a scatterplot. The x-axis shows differential connectivity in females over males, whereas the y-axis shows differential connectivity in AOR over MAM in females. Color indicates to which module the key driver belongs (yellow, blue, or greenyellow). The majority of the key drivers are grouped together in the upper right quadrant, indicating that they are more connected in females and in disease. The most significant key drivers of the three modules are highlighted with their gene name. B) Single cell RNA-sequencing expression in human carotid atherosclerotic plaques of the female CAD key drivers is shown in a dotplot. The columns show the module, whereas the rows show cell clusters found within the single cell RNA-sequencing of human atherosclerotic plaques. Each data point show the averaged expression of the key drivers in a module in that particular cell cluster. Color indicates expression, size of the dot indicate the percentage of expression. E.g. the key drivers of the yellow module are mostly expressed in endothelial cells of the human plaque. Key drivers selected for panel C-E are boxed in their respective color. C-E) Sex-stratified module scores of selected modules are shown in their respective cell-type. From top to bottom: blue key drivers in ACTA2+ SMCs, yellow key drivers in CD34+ endothelial cells I, green key drivers in CD14+CD68+ macrophages I. The p-value of the sex difference is shown on the right side (Welch Two Sample T-Test). AOR = atherosclerotic aortic root, CAD = coronary artery disease, MAM = mammary artery, SMC = smooth muscle cell.
Figure 6.
Figure 6.. Female key drivers and SMC phenotypic switching.
Genes enriched in female plaques reflect Klf4-dependent SMC phenotypic switching. A) UMAP of scRNAseq data from advanced BCA plaques of SMC lineage tracing Myh11-CreERT2 eYFP ApoE−/− Klf4wt/wt or Klf4△/△ mice, organized by UMAP cluster (annotations refer to markers in Supplement). B) Clusters 0–7 represent SMC lineage traced cells, as shown by eYFP status. C) Feature plots of representative blue module driver genes. D) Violin plots of representative blue module driver genes with and without knockout of Klf4. E) Table of blue module driver genes expressed by lineage traced SMC. Boldly printed genes are expanded upon in F. F) Differential expression analysis of data in A revealed six blue module drivers are significantly regulated by Klf4 in SMCs (Avg_log2FC expressed relative to wild-type). SMC = smooth muscle cell.

References

    1. Vrijenhoek JEP, Haitjema S, De Borst GJ, De Vries JPPM, Vaartjes I, Moll FL, Pasterkamp G, Den Ruijter HM. The impact of female sex on long-term survival of patients with severe atherosclerosis undergoing endarterectomy. Atherosclerosis. 2014;237:521–527. - PubMed
    1. Vrijenhoek JEP, Den Ruijter HM, De Borst GJ, De Kleijn DP V, De Vries JPPM, Bots ML, Van De Weg SM, Vink A, Moll FL, Pasterkamp G. Sex is associated with the presence of atherosclerotic plaque hemorrhage and modifies the relation between plaque hemorrhage and cardiovascular outcome. Stroke. 2013;44:3318–3323. - PubMed
    1. Man JJ, Beckman JA, Jaffe IZ. Sex as a Biological Variable in Atherosclerosis. Circ Res. 2020; 123: 1297–1319. - PMC - PubMed
    1. Pim V der H, Niek V. Identification of 64 Novel Genetic Loci Provides an Expanded View on the Genetic Architecture of Coronary Artery Disease. Circ Res. 2018;122:433–443. - PMC - PubMed
    1. Talukdar HA, Foroughi Asl H, Jain RK, Ermel R, Ruusalepp A, Franzén O, Kidd BA, Readhead B, Giannarelli C, Kovacic JC et al. Cross-Tissue Regulatory Gene Networks in Coronary Artery Disease. Cell Syst. 2016;2:196–208. - PMC - PubMed

Publication types