. 2021 Aug;17(8):2011-2036.
doi: 10.1080/15548627.2021.1874133. Epub 2021 Jan 26.

Mammalian BCAS3 and C16orf70 associate with the phagophore assembly site in response to selective and non-selective autophagy

Affiliations

Mammalian BCAS3 and C16orf70 associate with the phagophore assembly site in response to selective and non-selective autophagy

Waka Kojima et al. Autophagy. 2021 Aug.

Abstract

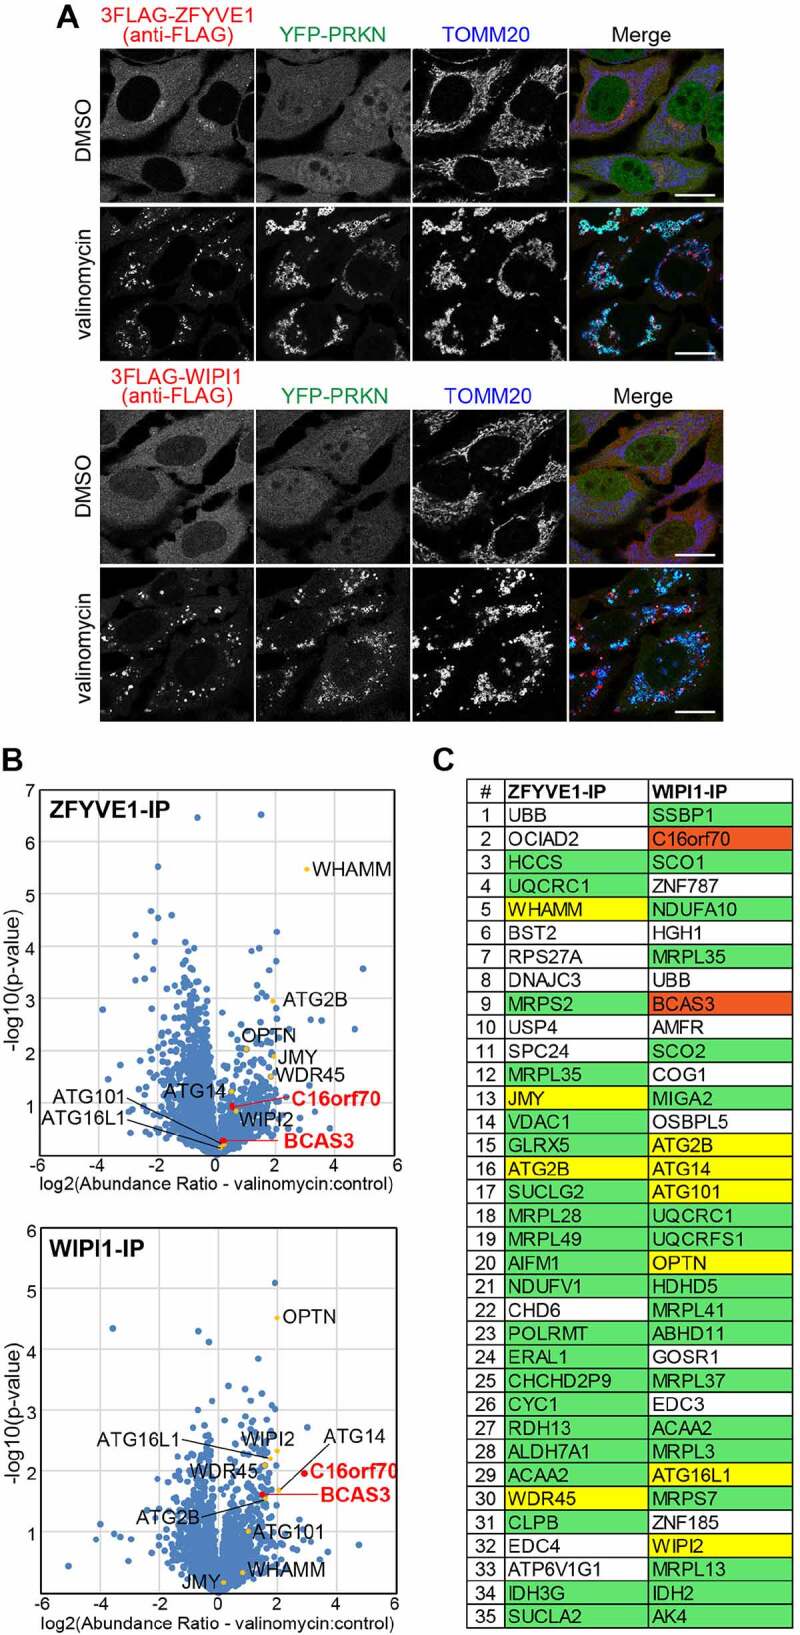
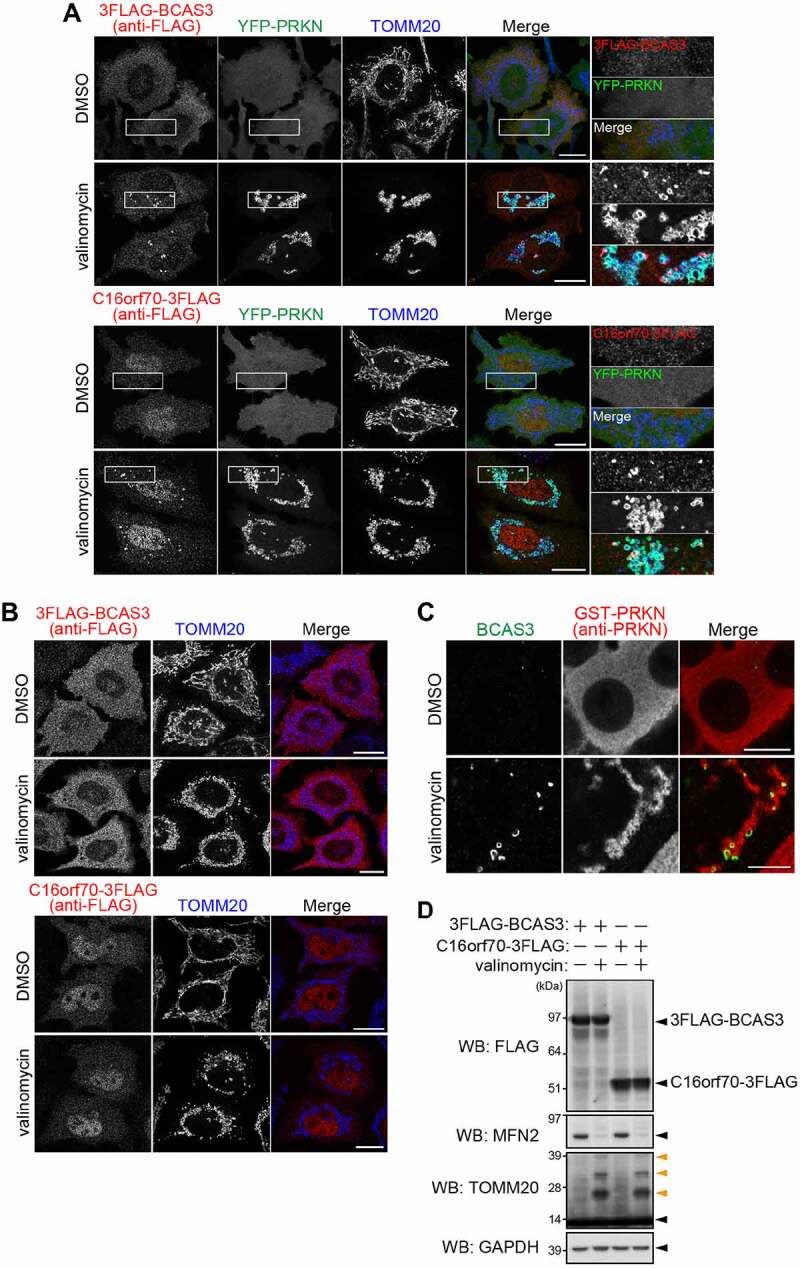
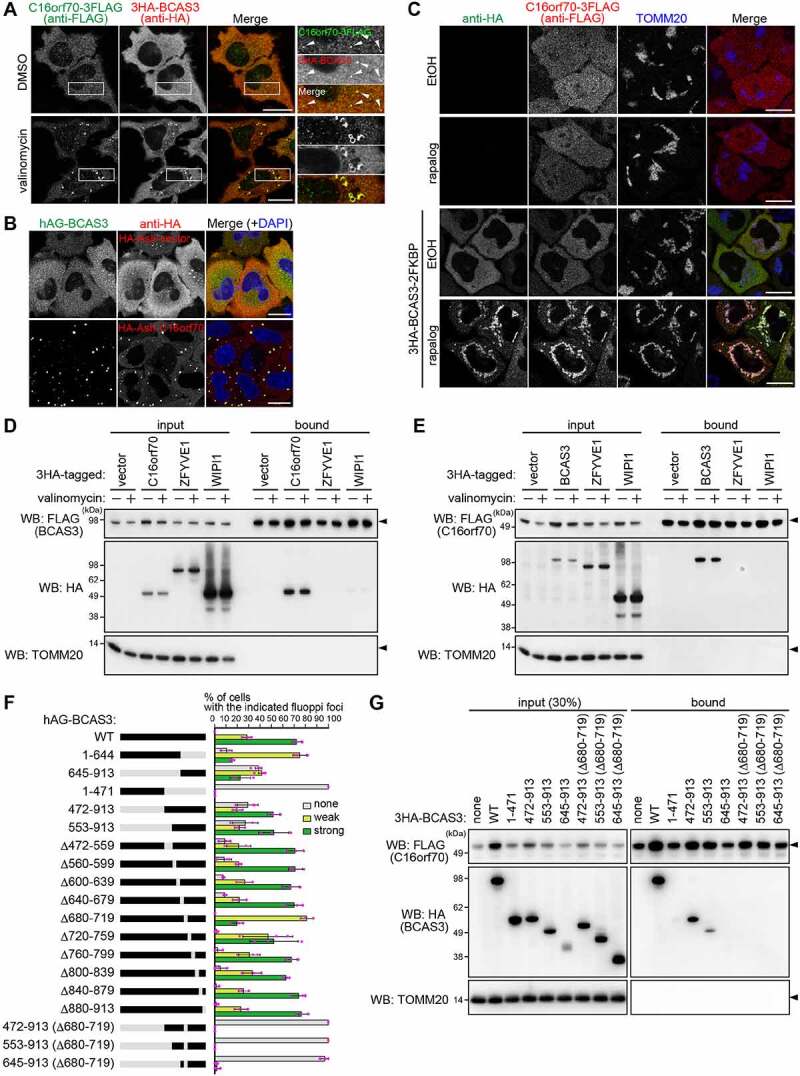
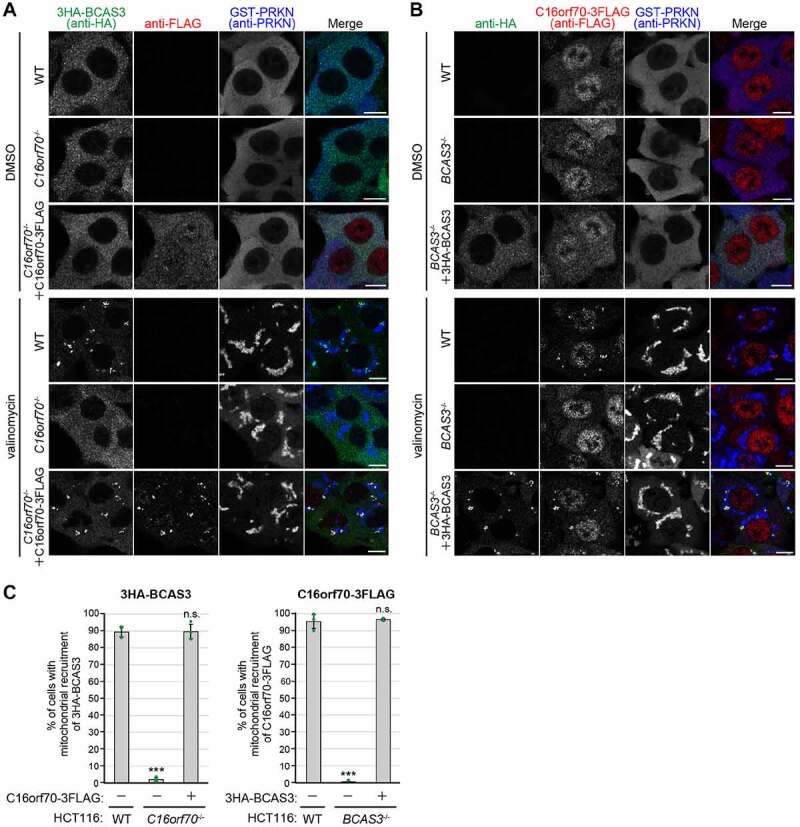
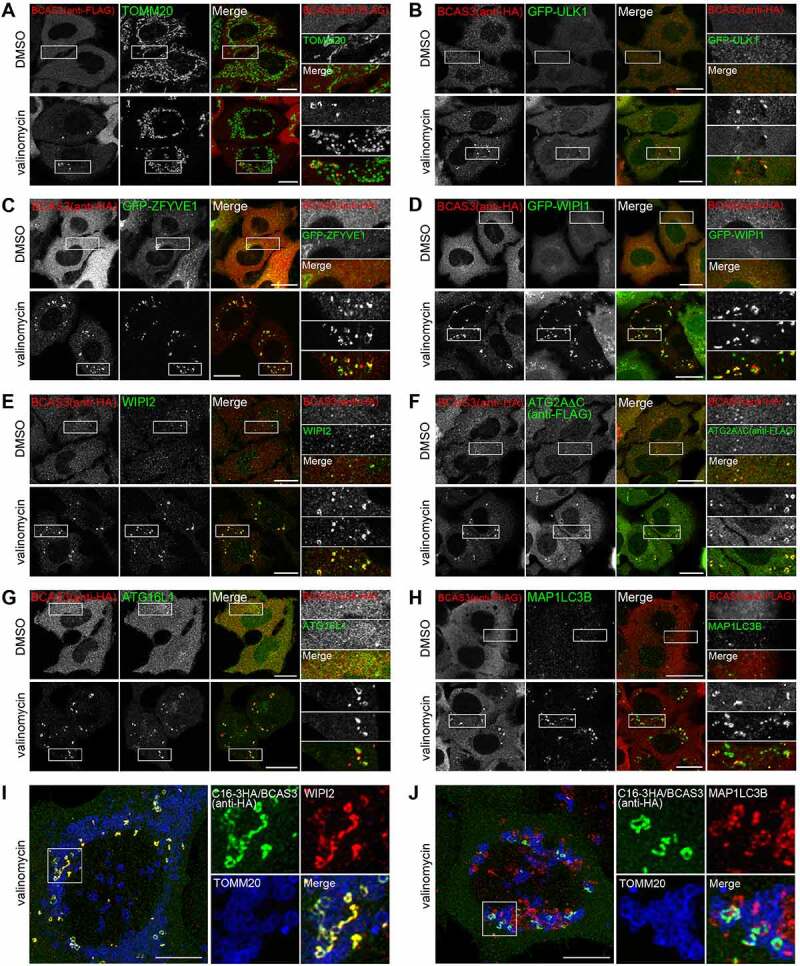
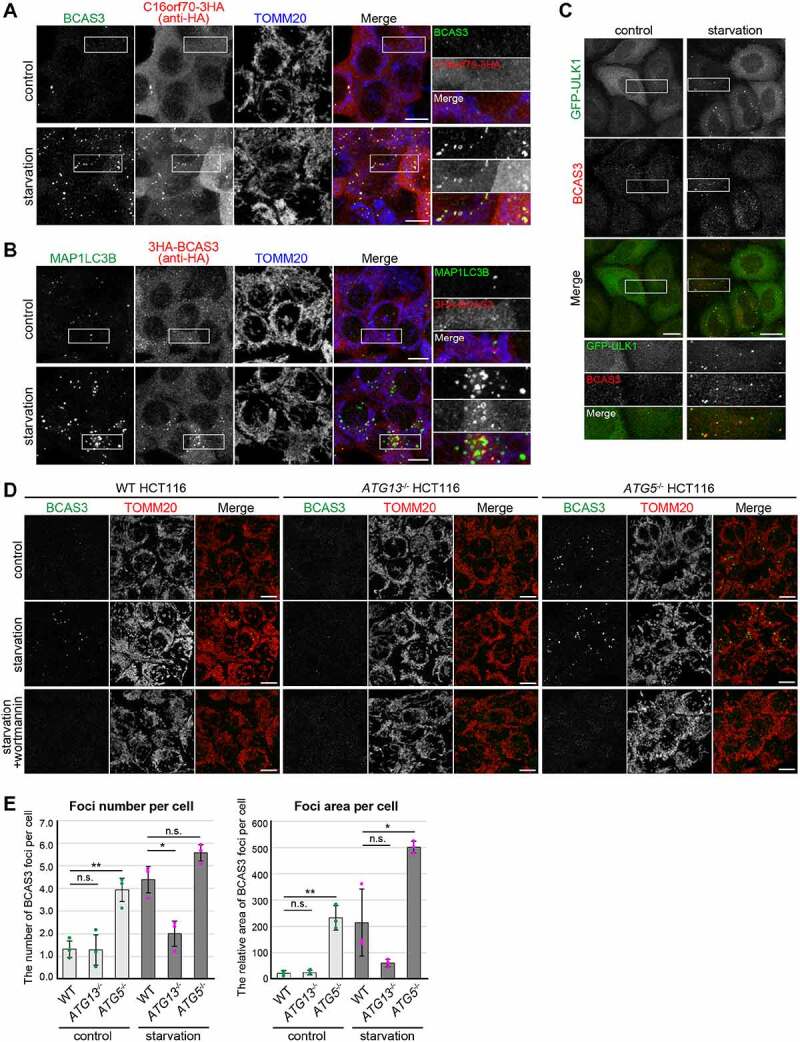
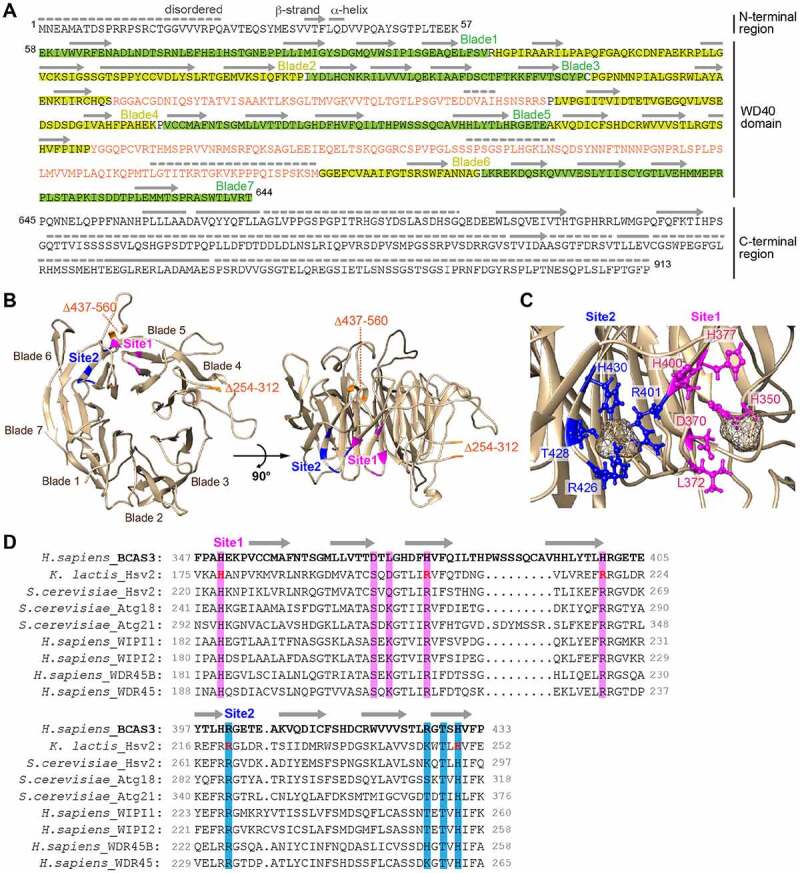
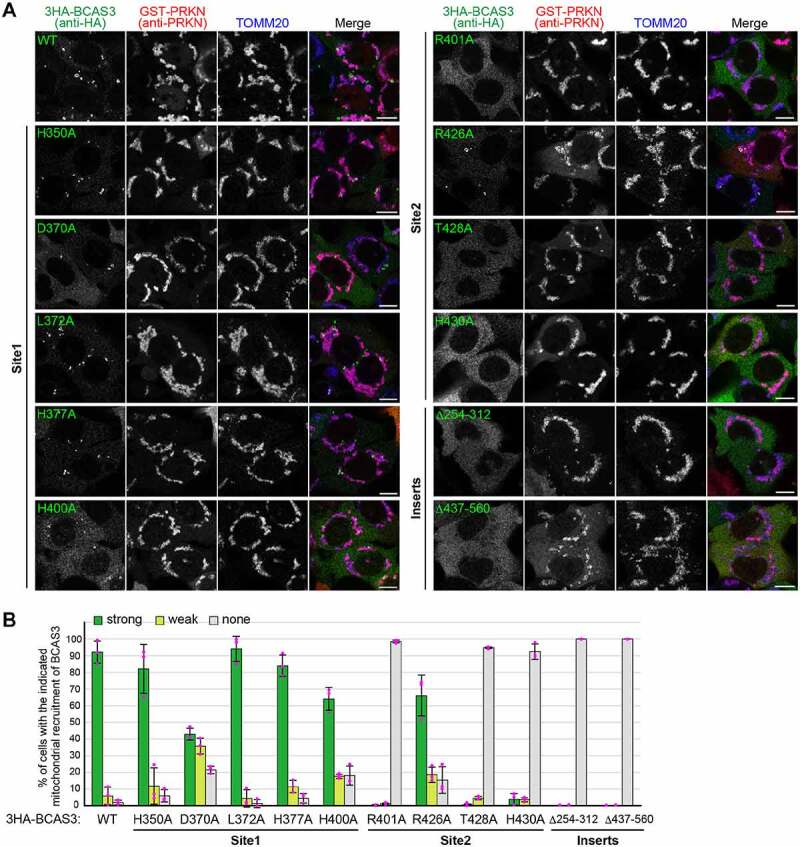
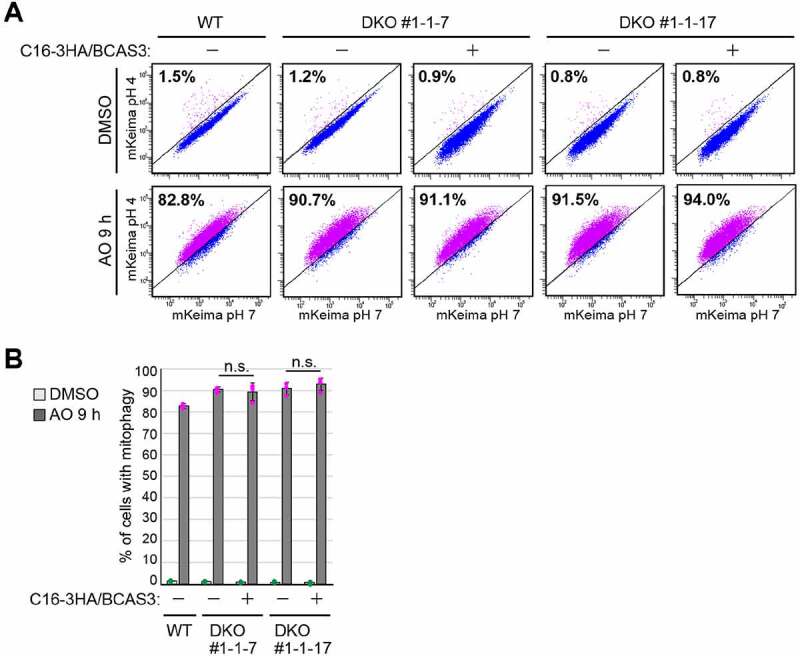
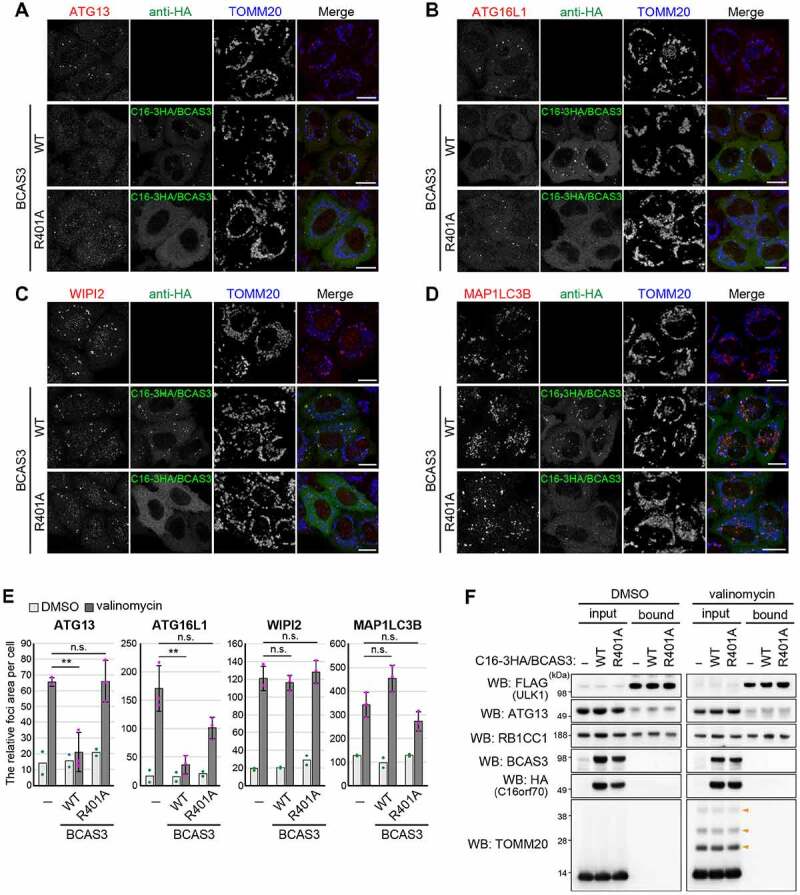
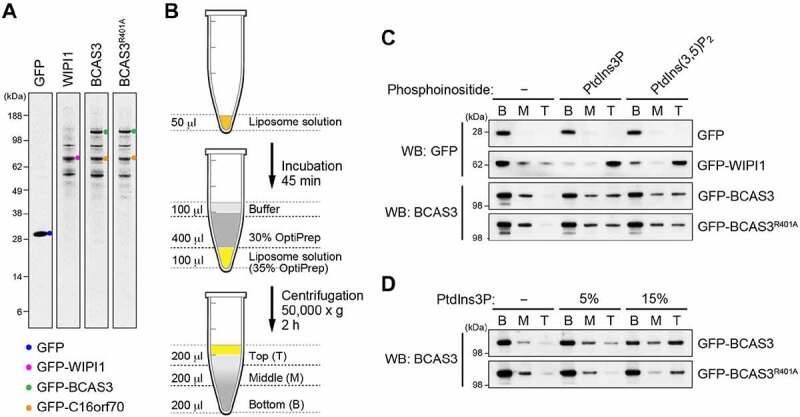
Macroautophagy/autophagy is an intracellular degradation process that delivers cytosolic materials and/or damaged organelles to lysosomes. De novo synthesis of the autophagosome membrane occurs within a phosphatidylinositol-3-phosphate-rich region of the endoplasmic reticulum, and subsequent expansion is critical for cargo encapsulation. This process is complex, especially in mammals, with many regulatory factors. In this study, by utilizing PRKN (parkin RBR E3 ubiquitin protein ligase)-mediated mitochondria autophagy (mitophagy)-inducing conditions in conjunction with chemical crosslinking and mass spectrometry, we identified human BCAS3 (BCAS3 microtubule associated cell migration factor) and C16orf70 (chromosome 16 open reading frame 70) as novel proteins that associate with the autophagosome formation site during both non-selective and selective autophagy. We demonstrate that BCAS3 and C16orf70 form a complex and that their association with the phagophore assembly site requires both proteins. In silico structural modeling, mutational analyses in cells and in vitro phosphoinositide-binding assays indicate that the WD40 repeat domain in human BCAS3 directly binds phosphatidylinositol-3-phosphate. Furthermore, overexpression of the BCAS3-C16orf70 complex affects the recruitment of several core autophagy proteins to the phagophore assembly site. This study demonstrates regulatory roles for human BCAS3 and C16orf70 in autophagic activity.Abbreviations: AO: antimycin A and oligomycin; Ash: assembly helper; ATG: autophagy-related; BCAS3: BCAS3 microtubule associated cell migration factor; C16orf70: chromosome 16 open reading frame 70; DAPI: 4',6-diamidino-2-phenylindole; DKO: double knockout; DMSO: dimethyl sulfoxide; ER: endoplasmic reticulum; fluoppi: fluorescent-based technology detecting protein-protein interactions; FIS1: fission, mitochondrial 1; FKBP: FKBP prolyl isomerase family member 1C; FRB: FKBP-rapamycin binding; hAG: humanized azami-green; IP: immunoprecipitation; IRES: internal ribosome entry site; KO: knockout; MAP1LC3B/LC3B: microtubule associated protein 1 light chain 3 beta; MFN2: mitofusin 2; MS: mass spectrometry; MT-CO2: mitochondrially encoded cytochrome c oxidase II; mtDNA: mitochondrial DNA; OPTN: optineurin; PFA: paraformaldehyde; PE: phosphatidylethanolamine; PtdIns3K: phosphatidylinositol 3-kinase; PtdIns3P: phosphatidylinositol-3-phosphate; PtdIns(3,5)P2: phosphatidylinositol-3,5-bisphosphate; PINK1: PTEN induced kinase 1; PRKN/Parkin: parkin RBR E3 ubiquitin protein ligase; PROPPIN: β-propellers that bind polyphosphoinositides; RB1CC1/FIP200: RB1 inducible coiled-coil 1; TOMM20: translocase of outer mitochondrial membrane 20; ULK1: unc-51 like autophagy activating kinase 1; WDR45B/WIPI3: WD repeat domain 45B; WDR45/WIPI4: WD repeat domain 45; WIPI: WD repeat domain, phosphoinositide interacting; WT: wild type; ZFYVE1/DFCP1: zinc finger FYVE-type containing 1.

Keywords: Mitophagy; parkin; phagophore; pink1; starvation; wd40.


Conflict of interest statement

No competing interests declared

Figures

Figure 1.
Figure 1.
Co-IP followed by MS analysis of WIPI1-associated proteins during mitophagy identified human BCAS3 and C16orf70. (A) HeLa cells stably expressing YFP-PRKN and 3FLAG-ZFYVE1 or 3FLAG-WIPI1 were treated with dimethyl sulfoxide (DMSO; control) or valinomycin for 3 h and then immunostained. Bars: 20 µm. (B) After treatment with DMSO or valinomycin, the cells in (A) were treated with 0.1% PFA, solubilized, and co-immunoprecipitated with an anti-FLAG/DDDDK antibody and then analyzed by MS. The volcano plots (ZFYVE1-IP – upper panel; WIPI1-IP – lower panel) show the abundance ratios (valinomycin versus control) plotted against the p-value in a – log10 scale for three independent experiments. Yellow dots indicate autophagy-related proteins listed in (C) and red dots indicate BCAS3 and C16orf70. (C) Co-IP proteins in (B) were ranked according to the Proteome Discoverer software-based quantification abundance ratio (valinomycin versus control). Protein designations are based on the UniProt database. Mitochondrial and autophagy-related proteins are highlighted in green and yellow, respectively
Figure 2.
Figure 2.
BCAS3 and C16orf70 are recruited to the phagophore assembly site upon mitophagy in a PRKN-PINK1 dependent manner. (A and B) HeLa cells stably expressing 3FLAG-BCAS3 or C16orf70-3FLAG with (A) or without YFP-PRKN (B) were treated with DMSO or valinomycin for 3 h and then immunostained. Bars: 20 µm. (A) Magnified images are shown in the rightmost panels. (C) HCT116 cells stably expressing GST-PRKN were treated with DMSO or valinomycin for 3 h and then immunostained. Endogenous BCAS3 was detected with an anti-BCAS3 antibody. Bars: 10 µm. (D) Total cell lysates in (A) were analyzed by western blotting. Glyceraldehyde-3-phosphate dehydrogenase (GAPDH) was used as a loading control. Orange arrowheads denote ubiquitinated TOMM20
Figure 3.
Figure 3.
BCAS3 and C16orf70 interact with each other. (A) 3HA-BCAS3, C16orf70-3FLAG and GST-PRKN were stably expressed in HeLa cells. Cells were treated with DMSO or valinomycin for 3 h and then immunostained. Magnified images are shown in the rightmost panels. Bars: 20 µm. (B) hAG-BCAS3 was expressed with either an HA-Ash vector or HA-Ash-C16orf70 in HeLa cells. Cells were immunostained 24 h post-transfection. Nuclei were stained with DAPI. Bars: 20 µm. (C) The indicated proteins were co-expressed with FRB-FIS1TM in HeLa cells. Cells were treated with ethanol (EtOH, control) or rapalog for 3 h and then immunostained. Bars: 20 µm. (D and E) 3HA-tagged C16orf70, BCAS3, ZFYVE1, or WIPI1 were transiently expressed in HeLa cells stably expressing 3FLAG-BCAS3 or C16orf70-3FLAG. After 24 h of transfection, cells were immunoprecipitated with an anti-FLAG antibody. The input (30% against the bound fraction) and the bound fractions were analyzed by western blotting. TOMM20 was used as a negative control. (F) Summary of results from fluoppi assays using the BCAS3 constructs. Truncated or deleted regions in BCAS3 are shown in gray. hAG-tagged WT BCAS3 and associated mutants were transiently expressed with HA-Ash-C16orf70 in HeLa cells and immunostained (Fig. S4B). Graphs show the percentage (%) of cells with the indicated fluoppi foci (none, weak, or strong). Error bars represent mean ± s.d. with > 100 cells counted in each of three independent experiments. (G) HEK293 cells expressing 3FLAG-C16orf70 and the indicated 3HA-BCAS3 truncated mutants were immunoprecipitated using an anti-FLAG antibody. The input (30% against the bound fraction) and the bound fractions were analyzed by western blotting. TOMM20 was used as a negative control
Figure 4.
Figure 4.
BCAS3 and C16orf70 are mutually dependent for accumulating around damaged mitochondria. (A and B) GST-PRKN and the indicated proteins were stably expressed in WT, C16orf70-/-, and BCAS3-/- HCT116 cells. Cells were treated with or without valinomycin for 3 h and then immunostained. 3HA-BCAS3, C16orf70-3FLAG and GST-PRKN were detected with anti-HA, anti-FLAG/DDDDK, and anti-PRKN antibodies, respectively. Bars: 10 µm. (C) The degree of mitophagy-dependent mitochondrial recruitment of 3HA-BCAS3 in (A) and C16orf70-3FLAG in (B) was quantified. Each dot represents the mean value determined from >100 cells and error bars represent mean ± s.d. in three independent experiments. Statistical differences were determined by student’s t-test (n.s.: not significant; ***P < 0.001)
Figure 5.
Figure 5.
BCAS3 colocalizes with autophagy proteins in response to mitophagy. (A-H) HeLa cells stably expressing 3FLAG-BCAS3 and HA-PRKN (A), 3HA-BCAS3, GFP-ULK1 and GST-PRKN (B), 3HA-BCAS3, GFP-ZFYVE1 and GST-PRKN (C), 3HA-BCAS3, GFP-WIPI1 and GST-PRKN (D), 3HA-BCAS3 and GST-PRKN (E and G), 3HA-BCAS3, 3FLAG-ATG2AC and GST-PRKN (F), and HCT116 cells stably expressing 3FLAG-BCAS3 and HA-PRKN (H) were treated with DMSO or valinomycin for 3 h and then immunostained. Magnified images are shown in the rightmost panels. Bars: 20 µm. (I and J) HeLa cells stably expressing untagged PRKN and the C16orf70-3HA-BCAS3 complex (C16-3HA/BCAS3) using an IRES system were treated with valinomycin for 3 h and then immunostained. The z-stack images were taken with an SP8 confocal microscope and processed for deconvolution and maximum projection. Magnified images are shown to the right. Bars: 10 µm
Figure 6.
Figure 6.
BCAS3 and C16orf70 colocalize with MAP1LC3 during starvation-induced autophagy. (A and B) HCT116 cells stably expressing BCAS3 and C16orf70-3HA from an IRES system (A) or 3HA-BCAS3 (B) were incubated in normal media (control) or amino-acid free media (starvation) for 1 h before immunostaining. Images are displayed as z-stacked confocal slices. Magnified images are shown in the rightmost panels. Bars: 10 µm. (C) HeLa cells stably expressing GFP-ULK1 were incubated as in (A). Bars: 20 µm. (D) WT, ATG13-/- and ATG5-/- HCT116 cells were incubated in normal media (control), amino-acid free media (starvation), or with wortmannin for 1 h prior to immunostaining. Endogenous BCAS3 was detected using an anti-BCAS3 antibody. Images are displayed as z-stacked confocal slices. Bars: 10 µm. (E) The number (left panel) and relative area (right panel) of BCAS3 foci in (D) were quantified. Each dot represents the mean value determined from >120 cells and error bars represent mean ± s.d. in three independent experiments. Statistical differences were determined by student’s t-test (n.s.: not significant; *P < 0.05; **P < 0.01)
Figure 7.
Figure 7.
Two phospholipid-binding sites are predicted in the BCAS3 WD40 repeat domain. (A) Predicted secondary structure for human BCAS3. The secondary structure in the WD40 repeat domain was assigned based on the model shown in (B) and secondary structure features in the N- and C-terminal regions were determined using PSIPRED [76]. Disordered regions were predicted using DISOPRED3 [77]. Lines, arrows, and dotted lines indicate helix, strand and disordered region, respectively. The two inserts in blades 4 and 6 are colored orange. (B) Predicted 3D structure of the human BCAS3 WD40 repeat domain. The two inserts in WD40 (i.e. residues 254–312 and 437–560) are deleted. Sites 1 and 2 (the predicted phospholipid-binding pockets) are colored magenta and blue, respectively. (C) Detailed sulfate binding depicted for sites 1 and 2. Side chains of the indicated residues in site 1 (magenta) and site 2 (blue) are depicted in ball-and-stick mode, whereas the sulfate ions are depicted as van der Waals spheres. (D) Alignment of the amino acid sequence around sites 1 and 2 of human BCAS3 and various Atg18 family proteins. Residues critical for phospholipid binding in K. lactis Hsv2 [63] are colored in red. Amino acid residues in sites 1 and 2 that were functionally examined in Figure 8 are highlighted in magenta and blue, respectively
Figure 8.
Figure 8.
Predicted BCAS3 phospholipid-binding sites and the two insert regions are essential for associating with the phagophore assembly site. (A) BCAS3-/- HCT116 cells transiently expressing the indicated 3HA-BCAS3 construct with GST-PRKN were treated with valinomycin for 3 h and then immunostained. Bars: 10 µm. (B) The degree of BCAS3 mitochondrial recruitment in (A) was quantified. Each dot represents the mean value determined from >100 cells and error bars represent mean ± s.d. in three independent experiments
Figure 9.
Figure 9.
Loss of the BCAS3-C16orf70 complex does not affect overall mitochondrial degradation in response to mitophagy. (A) WT and BCAS3-/-C16orf70-/- DKO clones #1-1-7 and #1-1-17 HCT116 cells stably expressing YFP-PRKN and mt-Keima were treated with DMSO or antimycin A and oligomycin (AO) for 9 h and then analyzed by FACS. Representative FACS data with the percentage of cells exhibiting lysosomal mt-Keima signals are shown. (B) Quantification of the FACS-based mitophagy in (A). Each dot represents the mean value and error bars represent mean ± s.d. in three independent experiments. Statistical differences were determined by student’s t-test (n.s.: not significant)
Figure 10.
Figure 10.
Overexpression of the BCAS3-C16orf70 complex affects recruitment of core autophagy proteins to the phagophore assembly site. (A-D) HeLa cells stably expressing PRKN alone (upper panel) or with IRES-based overexpression of C16orf70-3HA/BCAS3 (C16-3HA/BCAS3), WT (middle panel), or R401A (lower panel) were treated with valinomycin for 3 h and then immunostained with the indicated antibodies. Images are displayed as z-stacked confocal slices. Bars: 20 µm. (E) The relative foci areas for endogenous ATG13, WIPI2, ATG16L1 and MAP1LC3B in cells shown in (A-D) were quantified. Each dot represents the mean value determined from >100 cells and error bars represent mean ± s.d. in two (for DMSO) and three (for valinomycin) independent experiments. Statistical differences were determined by student’s t-test (n.s.: not significant; **P < 0.01). (F) HeLa cells stably expressing PRKN and 3FLAG-ULK1 with or without IRES-based overexpression of C16orf70-3HA/BCAS3 (C16-3HA/BCAS3), WT, or R401A were treated with DMSO or valinomycin for 3 h. The cell lysates were co-immunoprecipitated with an anti-FLAG antibody and 30% of the input and bound fractions were analyzed by western blotting. Orange arrowheads denote ubiquitinated TOMM20
Figure 11.
Figure 11.
The BCAS3-C16orf70 complex binds to PtdIns3P in vitro. (A) CBB staining of purified GFP-His, GFP-WIPI1-His, GFP-BCAS3-His/GFP-C16orf70-His and GFP-BCAS3R401A-His/GFP-C16orf70-His. (B) Schematic diagram of the liposome flotation assay. After incubating the liposome solution with purified proteins, OptiPrep was added to a final concentration of 35% and then 30% OptiPrep and buffer were sequentially layered on top. After centrifugation, the Bottom (B), Middle (M) and Top (T) fractions are collected and analyzed by western blotting. (C) Flotation assays using the purified proteins and liposomes containing the indicated phosphoinositides were performed. GFP-His and GFP-WIPI1-His were detected with an anti-GFP antibody, and GFP-BCAS3-His was detected with an anti-BCAS3 antibody. (D) Flotation assays using liposomes with various concentrations of PtdIns3P were performed. GFP-BCAS3-His was detected with an anti-BCAS3 antibody

Similar articles

Cited by

References

    1. Galluzzi L, E H B, Ballabio A.. Molecular definitions of autophagy and related processes. Embo J. 2017;36(13):1811–1836. - PMC - PubMed
    1. Mizushima N, Komatsu M. Autophagy: renovation of cells and tissues. Cell. 2011;147(4):728–741. - PubMed
    1. Feng Y, He D, Yao Z. The machinery of macroautophagy. Cell Res. 2014;24(1):24–41. - PMC - PubMed
    1. Wang B, Kundu M. Canonical and noncanonical functions of ULK/Atg1. Curr Opin Cell Biol. 2017;45:47–54. - PMC - PubMed
    1. Noda NN, Fujioka Y. Atg1 family kinases in autophagy initiation. Cell Mol Life Sci. 2015;72(16):3083–3096. - PMC - PubMed

Publication types