

Exploiting the GTEx resources to decipher the mechanisms at GWAS loci
- PMID: 33499903
- PMCID: PMC7836161
- DOI: 10.1186/s13059-020-02252-4
Exploiting the GTEx resources to decipher the mechanisms at GWAS loci
Abstract
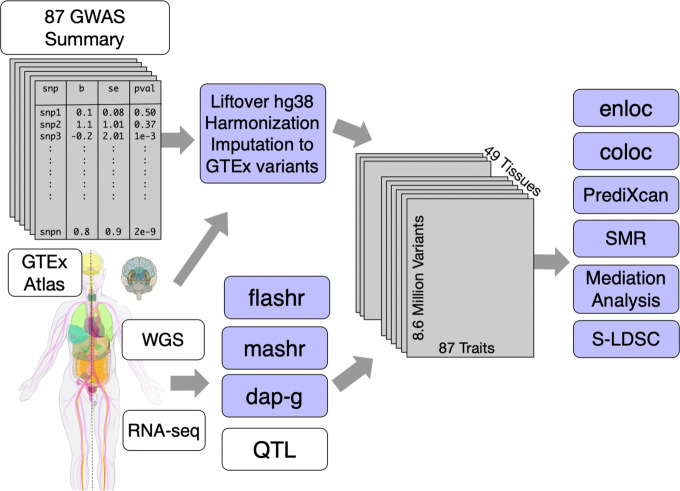
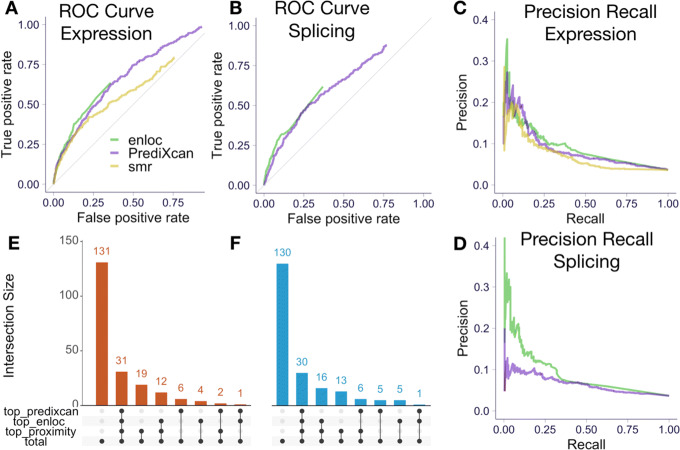
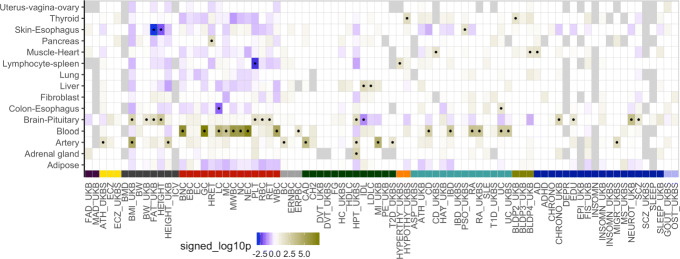
The resources generated by the GTEx consortium offer unprecedented opportunities to advance our understanding of the biology of human diseases. Here, we present an in-depth examination of the phenotypic consequences of transcriptome regulation and a blueprint for the functional interpretation of genome-wide association study-discovered loci. Across a broad set of complex traits and diseases, we demonstrate widespread dose-dependent effects of RNA expression and splicing. We develop a data-driven framework to benchmark methods that prioritize causal genes and find no single approach outperforms the combination of multiple approaches. Using colocalization and association approaches that take into account the observed allelic heterogeneity of gene expression, we propose potential target genes for 47% (2519 out of 5385) of the GWAS loci examined.
Conflict of interest statement
F.A. is an inventor on a patent application related to TensorQTL; S.E.C. is a co-founder, chief technology officer, and stock owner at Variant Bio; E.R.G. is on the Editorial Board of Circulation Research, and does consulting for the City of Hope/Beckman Research Institute; E.T.D. is chairman and member of the board of Hybridstat LTD.; B.E.E. is on the scientific advisory boards of Celsius Therapeutics and Freenome; G.G. receives research funds from IBM and Pharmacyclics, and is an inventor on patent applications related to MuTect, ABSOLUTE, MutSig, MSMuTect, MSMutSig, POLYSOLVER, and TensorQTL. G.G. is a founder, consultant and holds privately held equity in Scorpion Therapeutics; S.B.M. is on the scientific advisory board of MyOme; D.G.M. is a co-founder with equity in Goldfinch Bio, and has received research support from AbbVie, Astellas, Biogen, BioMarin, Eisai, Merck, Pfizer, and Sanofi-Genzyme; H.K.I. has received speaker honoraria from GSK and AbbVie; T.L. is a scientific advisory board member of Variant Bio with equity and Goldfinch Bio. P.F. is a member of the scientific advisory boards of Fabric Genomics, Inc., and Eagle Genomes, Ltd. P.G.F. is a partner of Bioinf2Bio.
Figures
References
-
- Guo H, Fortune MD, Burren OS, Schofield E, Todd JA, Wallace C. Integration of disease association and eQTL data using a Bayesian colocalisation approach highlights six candidate causal genes in immune-mediated diseases. Hum Mol Genet. 2015; 24(12):3305–13. 10.1093/hmg/ddv077. https://doi.org/http://oup.prod.sis.lan/hmg/article-pdf/24/12/3305/17203.... - DOI - PMC - PubMed
-
- Wu L, Shi W, Long J, Guo X, Michailidou K, Beesley J, Bolla MK, Shu X-O, Lu Y, Cai Q, Al-Ejeh F, Rozali E, Wang Q, Dennis J, Li B, Zeng C, Feng H, Gusev A, Barfield RT, Andrulis IL, Anton-Culver H, Arndt V, Aronson KJ, Auer PL, Barrdahl M, Baynes C, Beckmann MW, Benitez J, Bermisheva M, Blomqvist C, Bogdanova NV, Bojesen SE, Brauch H, Brenner H, Brinton L, Broberg P, Brucker SY, Burwinkel B, Caldes T, Canzian F, Carter BD, Castelao JE, Chang-Claude J, Chen X, Cheng T-YD, Christiansen H, Clarke CL, Collee M, Cornelissen S, Couch FJ, Cox D, Cox A, Cross SS, Cunningham JM, Czene K, Daly MB, Devilee P, Doheny KF, Dork T, Dos-Santos-Silva I, Dumont M, Dwek M, Eccles DM, Eilber U, Eliassen AH, Engel C, Eriksson M, Fachal L, Fasching PA, Figueroa J, Flesch-Janys D, Fletcher O, Flyger H, Fritschi L, Gabrielson M, Gago-Dominguez M, Gapstur SM, Garcia-Closas M, Gaudet MM, Ghoussaini M, Giles GG, Goldberg MS, Goldgar DE, Gonzalez-Neira A, Guenel P, Hahnen E, Haiman CA, Hakansson N, Hall P, Hallberg E, Hamann U, Harrington P, Hein A, Hicks B, Hillemanns P, Hollestelle A, Hoover RN, Hopper JL, Huang G, Humphreys K, Hunter DJ, Jakubowska A, Janni W, John EM, Johnson N, Jones K, Jones ME, Jung A, Kaaks R, Kerin MJ, Khusnutdinova E, Kosma V-M, Kristensen VN, Lambrechts D, Le Marchand L, Li J, Lindstrom S, Lissowska J, Lo W-Y, Loibl S, Lubinski J, Luccarini C, Lux MP, MacInnis RJ, Maishman T, Kostovska IM, Mannermaa A, Manson JE, Margolin S, Mavroudis D, Meijers-Heijboer H, Meindl A, Menon U, Meyer J, Mulligan AM, Neuhausen SL, Nevanlinna H, Neven P, Nielsen SF, Nordestgaard BG, Olopade OI, Olson JE, Olsson H, Peterlongo P, Peto J, Plaseska-Karanfilska D, Prentice R, Presneau N, Pylkas K, Rack B, Radice P, Rahman N, Rennert G, Rennert HS, Rhenius V, Romero A, Romm J, Rudolph A, Saloustros E, Sandler DP, Sawyer EJ, Schmidt MK, Schmutzler RK, Schneeweiss A, Scott RJ, Scott CG, Seal S, Shah M, Shrubsole MJ, Smeets A, Southey MC, Spinelli JJ, Stone J, Surowy H, Swerdlow AJ, Tamimi RM, Tapper W, Taylor JA, Terry MB, Tessier DC, Thomas A, Thone K, Tollenaar RAEM, Torres D, Truong T, Untch M, Vachon C, Van Den Berg D, Vincent D, Waisfisz Q, Weinberg CR, Wendt C, Whittemore AS, Wildiers H, Willett WC, Winqvist R, Wolk A, Xia L, Yang XR, Ziogas A, Ziv E, Dunning AM, Pharoah PDP, Simard J, Milne RL, Edwards SL, Kraft P, Easton DF, Chenevix-Trench G, Zheng W. A transcriptome-wide association study of 229,000 women identifies new candidate susceptibility genes for breast cancer. Nat Genet. 2018;50(7):968–78. - PMC - PubMed
-
- Pashos EE, Park Y, Wang X, Raghavan A, Yang W, Abbey D, Peters DT, Arbelaez J, Hernandez M, Kuperwasser N, Li W, Lian Z, Liu Y, Lv W, Lytle-Gabbin SL, Marchadier DH, Rogov P, Shi J, Slovik KJ, Stylianou IM, Wang L, Yan R, Zhang X, Kathiresan S, Duncan SA, Mikkelsen TS, Morrisey EE, Rader DJ, Brown CD, Musunuru K. Large, diverse population cohorts of hiPSCs and derived hepatocyte-like cells reveal functional genetic variation at blood lipid-associated loci. Cell Stem Cell. 2017;20(4):558–70. - PMC - PubMed
Publication types
MeSH terms
Grants and funding
- R01 MH101814/MH/NIMH NIH HHS/United States
- P30DK20595/National Institute of Diabetes and Digestive and Kidney Diseases (US)
- U01 HG007598/HG/NHGRI NIH HHS/United States
- T32 HL007824/HL/NHLBI NIH HHS/United States
- R35 GM138121/GM/NIGMS NIH HHS/United States
- R01 MH101822/MH/NIMH NIH HHS/United States
- R01 HL133218/HL/NHLBI NIH HHS/United States
- U41 HG009494/HG/NHGRI NIH HHS/United States
- R01MH107666/National Institute of Health
- R01 HG011138/HG/NHGRI NIH HHS/United States
- U01 HG007593/HG/NHGRI NIH HHS/United States
- UL1 TR000430/TR/NCATS NIH HHS/United States
- R01 MH107666/MH/NIMH NIH HHS/United States
- R35 GM124836/GM/NIGMS NIH HHS/United States
- R01 HL139865/HL/NHLBI NIH HHS/United States
- RF1 AG055477/AG/NIA NIH HHS/United States
- HHSN268201000029C/HL/NHLBI NIH HHS/United States
- R01 HL133559/HL/NHLBI NIH HHS/United States
- R01 EY031424/EY/NEI NIH HHS/United States
- R35 HG010718/HG/NHGRI NIH HHS/United States
- P30 DK020595/DK/NIDDK NIH HHS/United States
LinkOut - more resources
Full Text Sources
Other Literature Sources
