. 2020 Feb 12;2(1):6.
doi: 10.1186/s42523-020-0023-1.

Multi-kingdom characterization of the core equine fecal microbiota based on multiple equine (sub)species

Affiliations

Multi-kingdom characterization of the core equine fecal microbiota based on multiple equine (sub)species

J E Edwards et al. Anim Microbiome. .

Abstract

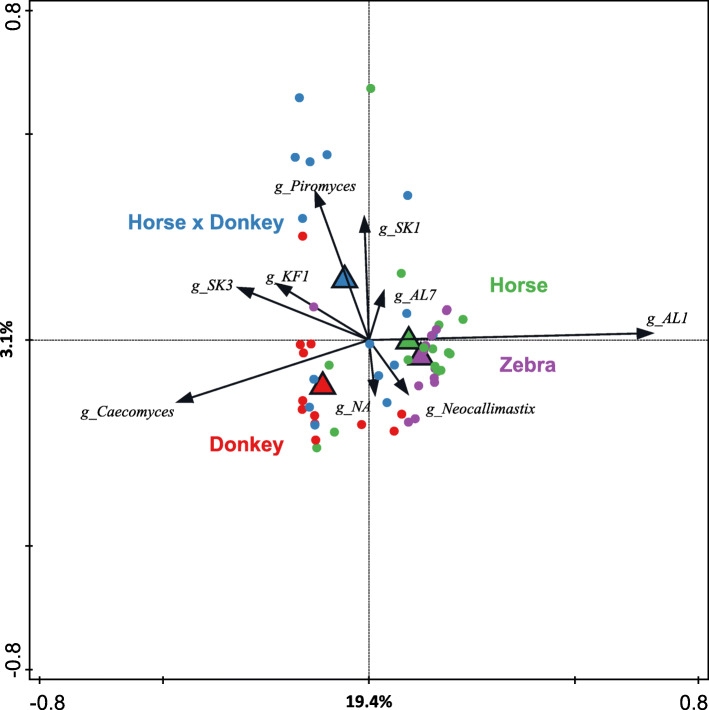
Background: Equine gut microbiology studies to date have primarily focused on horses and ponies, which represent only one of the eight extant equine species. This is despite asses and mules comprising almost half of the world's domesticated equines, and donkeys being superior to horses/ponies in their ability to degrade dietary fiber. Limited attention has also been given to commensal anaerobic fungi and archaea even though anaerobic fungi are potent fiber degrading organisms, the activity of which is enhanced by methanogenic archaea. Therefore, the objective of this study was to broaden the current knowledge of bacterial, anaerobic fungal and archaeal diversity of the equine fecal microbiota to multiple species of equines. Core taxa shared by all the equine fecal samples (n = 70) were determined and an overview given of the microbiota across different equine types (horse, donkey, horse × donkey and zebra).

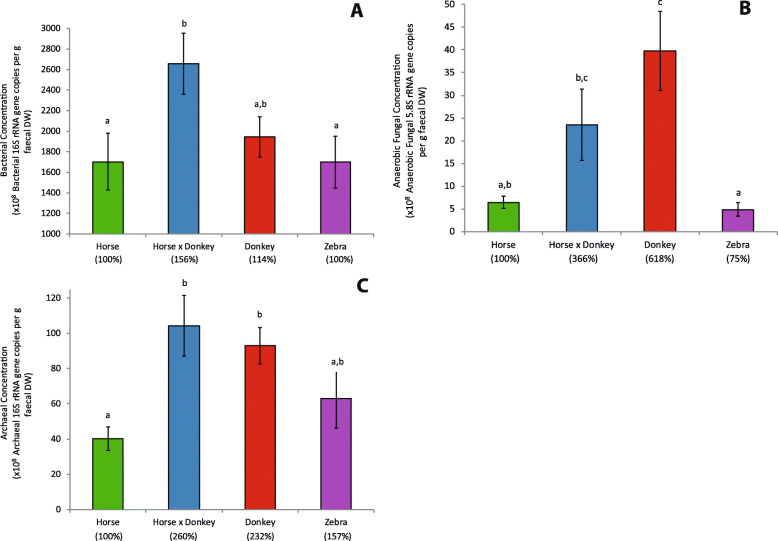
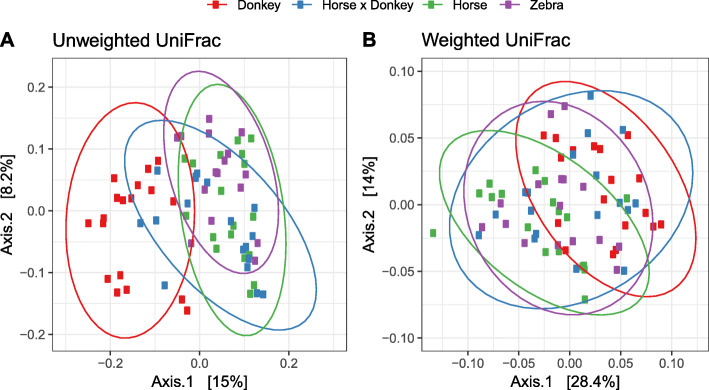
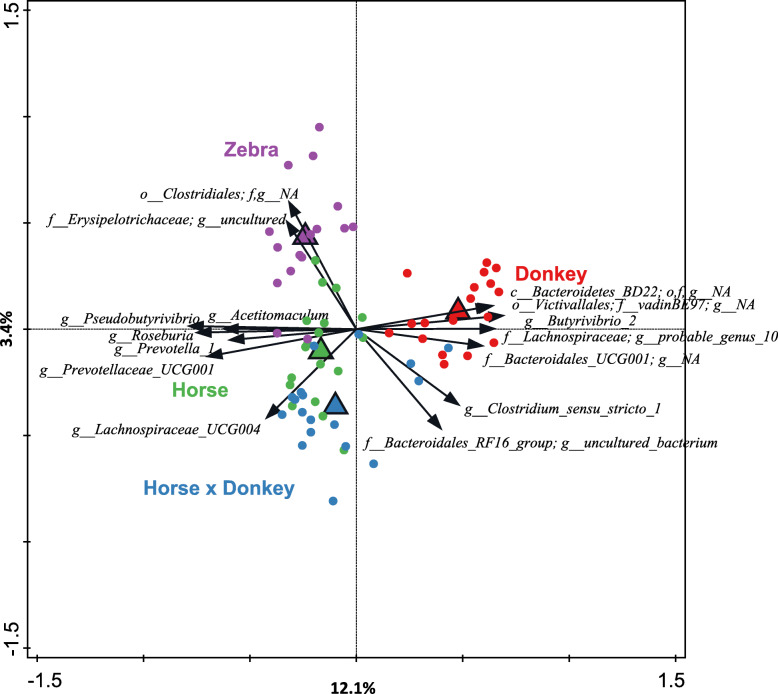
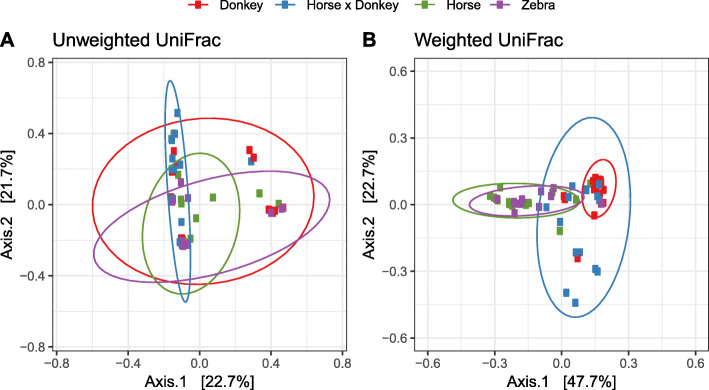
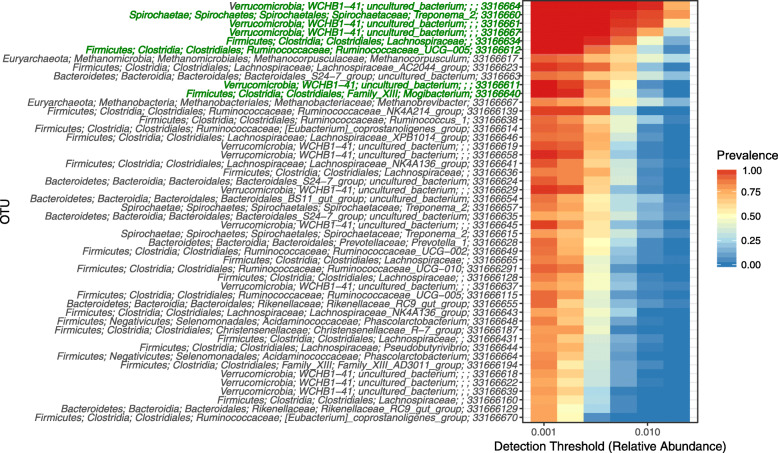
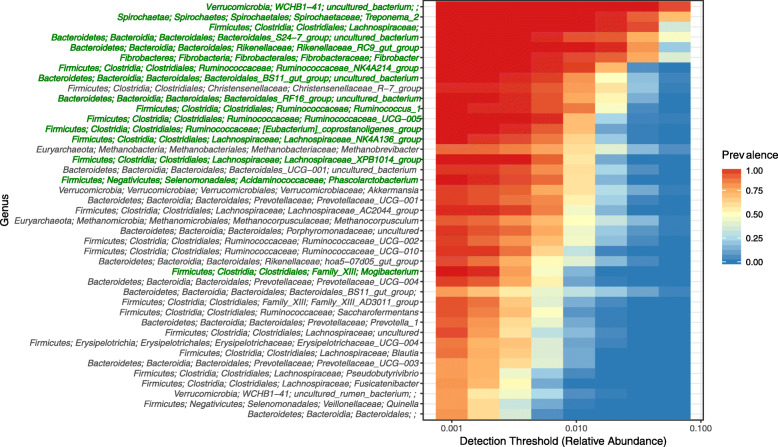
Results: Equine type was associated with differences in both fecal microbial concentrations and community composition. Donkey was generally most distinct from the other equine types, with horse and zebra not differing. Despite this, a common bacterial core of eight OTUs (out of 2070) and 16 genus level groupings (out of 231) was found in all the fecal samples. This bacterial core represented a much larger proportion of the equine fecal microbiota than previously reported, primarily due to the detection of predominant core taxa belonging to the phyla Kiritimatiellaeota (formerly Verrucomicrobia subdivision 5) and Spirochaetes. The majority of the core bacterial taxa lack cultured representation. Archaea and anaerobic fungi were present in all animals, however, no core taxon was detected for either despite several taxa being prevalent and predominant.

Conclusions: Whilst differences were observed between equine types, a core fecal microbiota existed across all the equines. This core was composed primarily of a few predominant bacterial taxa, the majority of which are novel and lack cultured representation. The lack of microbial cultures representing the predominant taxa needs to be addressed, as their availability is essential to gain fundamental knowledge of the microbial functions that underpin the equine hindgut ecosystem.

Keywords: Anaerobic fungi; Archaea; Bacteria; Barcoded amplicon sequencing; Donkey; Feces; Hinny; Horse; Mule; Zebra.


Conflict of interest statement

The authors declare that they have no competing interests.

Figures

Fig. 1
Fig. 1
Effect of equine type on the fecal bacterial (a), anaerobic fungal (b) and archaeal (c) concentrations on a dry weight basis. Columns represent the mean (n = 18, except for zebra where n = 16) and error bars the SEM. Letters above the bars within each plot indicate significant differences (P < 0.05). Percentages stated on the x-axis in brackets indicate how the mean of each equine type compared to that of the horse.
Fig. 2
Fig. 2
Unweighted (a) and weighted (b) UniFrac based principal co-ordinates analysis of the fecal prokaryotic community composition of the different equine types at the OTU level. Analysis used Log10 transformed data with ellipses representing 95% confidence intervals, and the percentages values labelled on each axis indicating the amount of total variation represented.
Fig. 3
Fig. 3
Redundancy analysis triplot showing the relationship between the top fifteen prokaryotic genus-level phylogenetic groupings of the OTUs for which the variation is best explained by the constrained axes. Arrow length indicates the variance that can be explained by equine type, with the perpendicular distance of the equine types to the arrow indicating the relative abundance of the genus-level phylogenetic grouping. Arrow labels indicate the taxonomic affiliation of genus-level phylogenetic groups, with the level (i.e. class (c), order (o), family (f) or genus (g)) and taxon (as defined by the Silva 16S rRNA database) that the groups could be reliably assigned to. For example ‘g_Prevotella_1’ represents an OTU reliably assigned to the Prevotella_1 genus, whereas “c_Bacteroidetes_BD2–2; o,f,g_NA” was reliably assigned to the class Bacteroidetes_BD2–2 but the order, family and genus could not be annotated (NA). Triangular symbols indicate the equine type means and circle symbols the individual samples color coded by equine type. Equine type explained 18.3% of the total variation in the dataset, and the plot axis are labelled with the amount of this they represent.
Fig. 4
Fig. 4
Unweighted (a) and weighted (b) UniFrac based principal co-ordinates analysis of the fecal anaerobic fungal community composition of the different equine types at the OTU level. Analysis used Log10 transformed data with ellipses representing 95% confidence intervals, and the percentages values labelled on each axis indicating the amount of total variation represented.
Fig. 5
Fig. 5
Redundancy analysis triplot showing the relationship between the anaerobic fungal genus-level phylogenetic groupings of the OTUs for which the variation is best explained by the constrained axes. Arrow length indicates the variance that can be explained by equine type, with the perpendicular distance of the equine types to the arrow indicating the relative abundance of the genus-level phylogenetic grouping. Arrow labels indicate the taxonomic affiliation that the genera could be reliably assigned to. For example ‘g_AL1’ represents a grouping reliably assigned to the AL1 genus, whereas ‘g_NA’ indicates that it was reliably assigned to the family Neocallimastigaceae but the genus could not be annotated (NA). Triangular symbols indicate the equine type means and circle symbols the individual samples color coded by equine type. Equine type explained 23.6% of the total variation in the dataset, and the plot axis are labelled with the amount of this they represent.
Fig. 6
Fig. 6
Heat map showing the relative abundance (> 0.001 cut-off) and prevalence (75% cut-off) of the prokaryotic OTUs in the 70 equine fecal samples analyzed. Different detection thresholds are used, providing information regarding the relative abundance of the OTUs relative to their prevalence. Taxonomic assignments of the OTUs are given to five taxonomic ranks (phylum, class, order, family and genus) where possible, followed by the OTU ID number. Where this was not possible, the non-annotated ranks were left empty (e.g. Verrucomicrobia; WCHB1–41; uncultured_bacterium;;; 3316664 has no information for the family and genus ranks). OTUs present in all animals (i.e. core) have their taxonomic assignments written in green.
Fig. 7
Fig. 7
Heat map showing the relative abundance (> 0.001 cut-off) and prevalence (75% cut-off) of the prokaryotic genus level OTU groups in the 70 equine fecal samples analyzed. Different detection thresholds are used, providing information regarding the relative abundance of the genus level OTU groups relative to their prevalence. Taxonomic assignments of the genera are given to five taxonomic ranks (phylum, class, order, family and genus) where possible. Where this was not possible, the non-annotated ranks were left empty (e.g. Verrucomicrobia; WCHB1–41; uncultured_bacterium;;; has no information for the family and genus ranks). Genus level groups present in all animals have their taxonomic assignments written in green.

References

    1. Steelman SM, Chowdhary BP, Dowd S, Suchodolski J, Janečka JE. Pyrosequencing of 16S rRNA genes in fecal samples reveals high diversity of hindgut microflora in horses and potential links to chronic laminitis. BMC Vet Res. 2012;8:231. doi: 10.1186/1746-6148-8-231. - DOI - PMC - PubMed
    1. Shepherd ML, Swecker WS, Jensen RV, Ponder MA. Characterization of the fecal bacteria communities of forage-fed horses by pyrosequencing of 16S rRNA V4 gene amplicons. FEMS Microbiol Lett. 2012;326:62–68. doi: 10.1111/j.1574-6968.2011.02434.x. - DOI - PubMed
    1. Costa MC, Arroyo LG, Allen-Vercoe E, Stämpfli HR, Kim PT, Sturgeon A, et al. Comparison of the fecal microbiota of healthy horses and horses with colitis by high throughput sequencing of the V3-V5 region of the 16S rRNA gene. PLoS One. 2012;7:e41484. doi: 10.1371/journal.pone.0041484. - DOI - PMC - PubMed
    1. Costa MC, Stämpfli HR, Arroyo LG, Allen-Vercoe E, Gomes RG, Weese J. Changes in the equine fecal microbiota associated with the use of systemic antimicrobial drugs. BMC Vet Res. 2015;11:19. doi: 10.1186/s12917-015-0335-7. - DOI - PMC - PubMed
    1. Rodriguez C, Taminiau B, Brévers B, Avesani V, Van Broeck J, Leroux A, et al. Faecal microbiota characterisation of horses using 16 rdna barcoded pyrosequencing, and carriage rate of Clostridium difficile at hospital admission. BMC Microbiol. 2015;15:181. doi: 10.1186/s12866-015-0514-5. - DOI - PMC - PubMed

LinkOut - more resources