. 2021 Jan 5;3(1):3.
doi: 10.1186/s42523-020-00063-3.

The yellow perch (Perca flavescens) microbiome revealed resistance to colonisation mostly associated with neutralism driven by rare taxa under cadmium disturbance

Affiliations

The yellow perch (Perca flavescens) microbiome revealed resistance to colonisation mostly associated with neutralism driven by rare taxa under cadmium disturbance

Bachar Cheaib et al. Anim Microbiome. .

Abstract

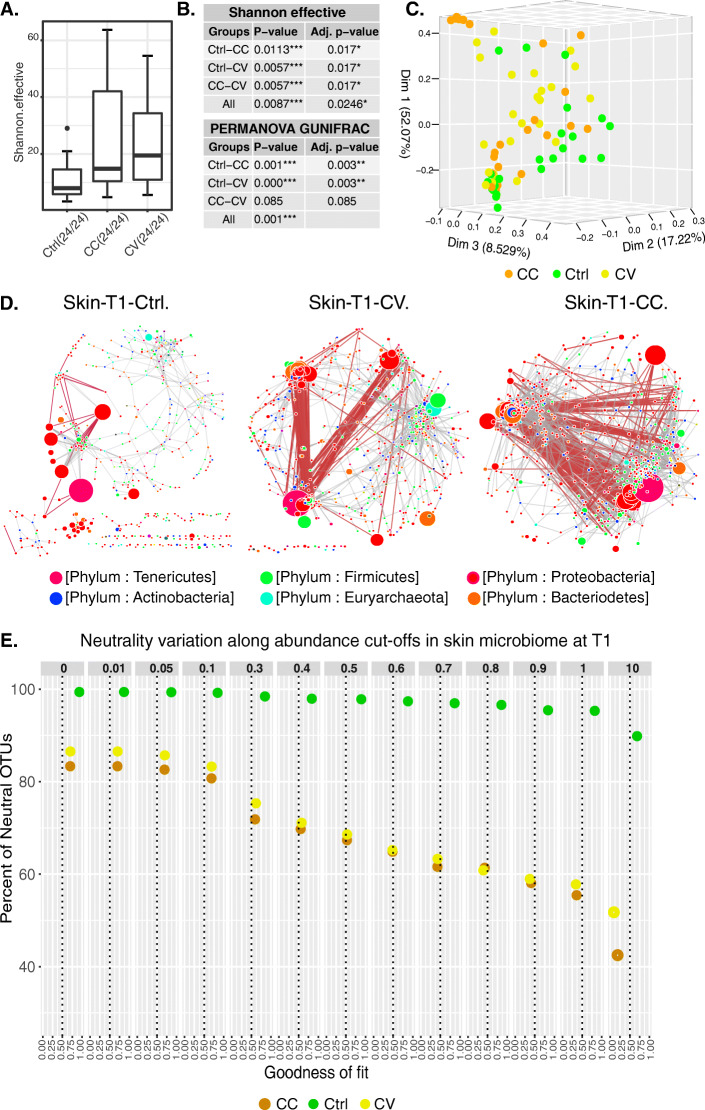
Background: Disentangling the dynamics of microbial interactions within communities improves our comprehension of metacommunity assembly of microbiota during host development and under perturbations. To assess the impact of stochastic variation of neutral processes on microbiota structure and composition under disturbance, two types of microbial habitats, free-living (water), and host-associated (skin and gut) were experimentally exposed to either a constant or gradual selection regime exerted by two sublethal cadmium chloride dosages (CdCl2). Yellow Perch (Perca flavescens) was used as a piscivorous ecotoxicological model. Using 16S rDNA gene based metataxonomics, quantitative diversity metrics of water, skin and gut microbial communities were characterized along with development and across experimental conditions.

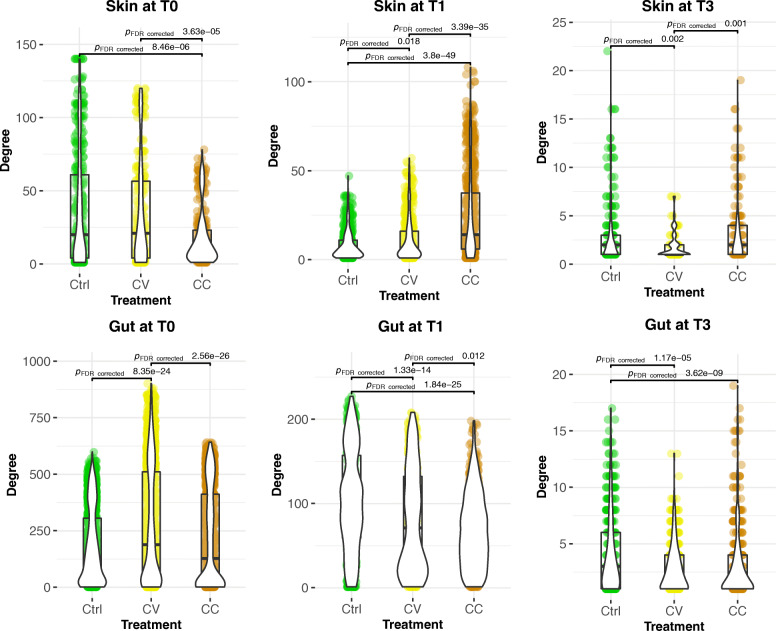
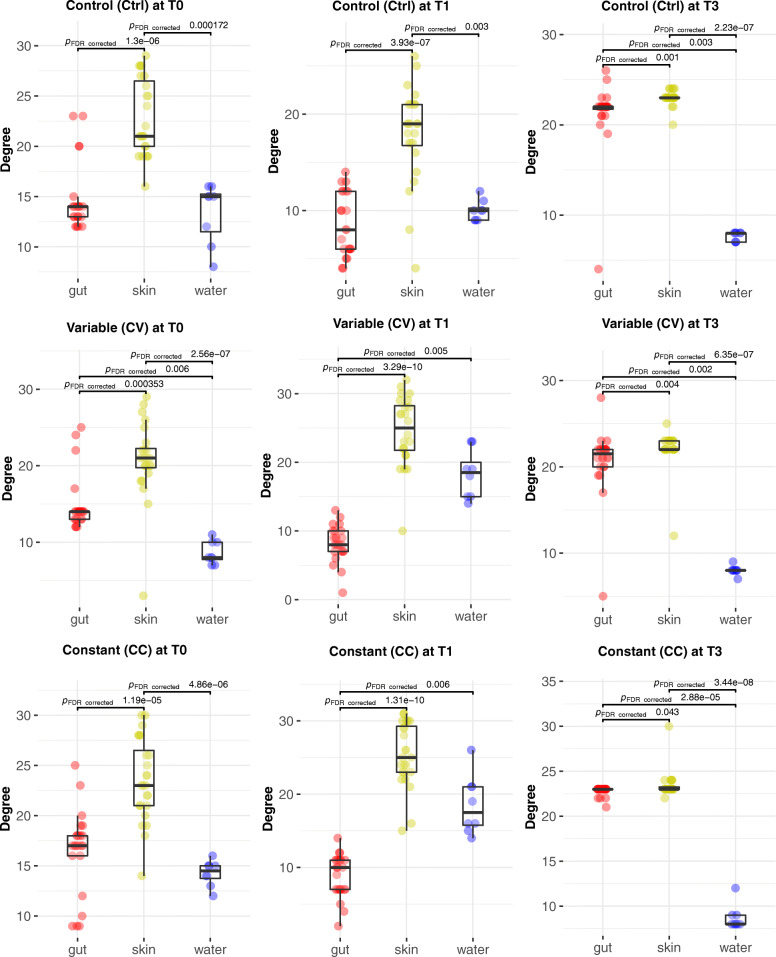
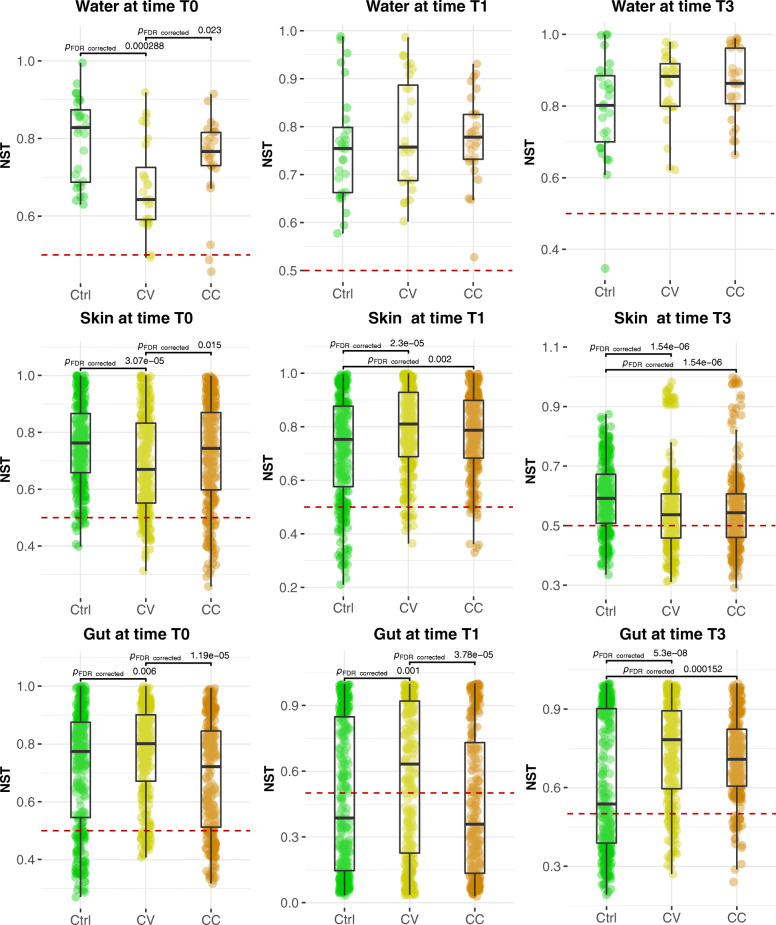
Results: After 30 days, constant and gradual selection regimes drove a significant alpha diversity increase for both skin and gut microbiota. In the skin, pervasive negative correlations between taxa in both selection regimes in addition to the taxonomic convergence with the environmental bacterial community, suggest a loss of colonisation resistance resulting in the dysbiosis of yellow perch microbiota. Furthermore, the network connectivity in gut microbiome was exclusively maintained by rare (low abundance) OTUs, while most abundant OTUs were mainly composed of opportunistic invaders such as Mycoplasma and other genera related to fish pathogens such as Flavobacterium. Finally, the mathematical modelling of community assembly using both non-linear least squares models (NLS) based estimates of migration rates and normalized stochasticity ratios (NST) based beta-diversity distances suggested neutral processes drove by taxonomic drift in host and water communities for almost all treatments. The NLS models predicted higher demographic stochasticity in the cadmium-free host and water microbiomes, however, NST models suggested higher ecological stochasticity under perturbations.

Conclusions: Neutral models agree that water and host-microbiota assembly promoted by rare taxa have evolved predominantly under neutral processes with potential involvement of deterministic forces sourced from host filtering and cadmium selection. The early signals of perturbations in the skin microbiome revealed antagonistic interactions by a preponderance of negative correlations in the co-abundance networks. Our findings enhance our understanding of community assembly host-associated and free-living under anthropogenic selective pressure.


Conflict of interest statement

The authors declare that they have no competing interests.

Figures

Fig. 1
Fig. 1
Diversity, structure, and assembly of the skin microbiome. a highlights the negative correlations in the co-abundance networks of skin microbial community. Each node size in the network is proportional to the average of the OTUs relative abundance in all samples. These networks are based on significant Spearman coefficients and were constructed using R scripts and Cytoscape software. b shows the boxplots of the significant difference in alpha-diversity (Shannon effective). c summarises the statistical tests of alpha-diversity and beta-diversity (Gunifrac distance). d represents the PCOA 3D plot of the microbial skin communities of all treatment groups based on the significant difference of generalized Unifrac distances tested with PERMANOVA, MRPP and multiple correction test (See Supplementary Table 3) e reports the distribution of neutrality versus abundance cut-off and goodness of fit. The plot shows the variation of neutral OTUs percentage (Y-axis) along with the goodness of fit predicted by NLS models using 12 cut-offs of relative abundance averages (facet panels) in the skin metacommunity at T1 and T3
Fig. 2
Fig. 2
Diversity, structure, and assembly of the gut microbiome. a highlights the peripheral location of the most abundant OTUs in the correlation networks of the gut microbial community. Each node size in the network is proportional to the average of the OTUs relative abundance in all samples. These networks are based on significant Spearman coefficients and were constructed using R scripts and Cytoscape software. b shows the boxplots of the significant difference in alpha-diversity (Shannon effective). c summarizes the statistical tests of alpha-diversity and beta-diversity (Gunifrac distance). d represents the PCOA 3D plot of the microbial skin communities of all treatment groups based on the significant difference of generalized Unifrac distances tested with PERMANOVA, MRPP and multiple correction test (See Materials and Methods and Supplementary Table 3) (e) reports the distribution of neutrality versus abundance cut-off and goodness of fit. The plot shows the variation of neutral OTUs percentage (Y-axis) along with the goodness of fit predicted by NLS models using 12 cut-offs of relative abundance percentages (facet panels) in the gut metacommunity at T1 and T3
Fig. 3
Fig. 3
The average degree of host-microbiome networks over time and between treatments. The connectivity represented with violin plots are significantly higher in average for the control groups in the gut and the skin at time T3, whilst at T1, they were significantly higher for cadmium-treated groups only in the skin. The average of nodes’ degree computed with Network Analyzer was compared using the Kruskal-Wallis test followed by Benjamini-Hochberg test. The value of 0.05 is the threshold of B-H p-value significance. Only the significant Dunn test p-values for pairwise comparisons are displayed on this figure, however in order to improve visibility, the significant p-values of Kruskal-wallis test for multiple groups comparisons were not plotted
Fig. 4
Fig. 4
Correlational co-abundance networks of water microbial community. Water microbial community networks displayed fragmented interactions, over time and between treatments — the topology of water microbial encompassed sub-networks disconnected in small independent hubs. The number of independent hubs was the highest in Control network at T0 and T3, at T3 in CC, and it was always intermediate in CV network (see the Supplementary Table 3). These networks are based on significant Spearman coefficients and were constructed using R scripts and Cytoscape software
Fig. 5
Fig. 5
The average degree of water microbial networks over time and between treatments. The connectivity represented with violin plots is significantly higher on average for the control groups in the gut and the skin at times T3 and T1. The average of nodes’ degree computed with Network Analyzer was compared using the Kruskal-Wallis test followed by Benjamini-Hochberg test. The value of 0.05 is the threshold of B-H p-value significance. Only the significant Dunn test p-values for pairwise comparisons are displayed on this figure, however in order to improve visibility, the significant p-values of Kruskal-wallis test for multiple groups comparisons were not plotted
Fig. 6
Fig. 6
Statistical analysis of the node degree in the water and host-microbiome networks. The comparison of connectivity assessed with nodes degrees and represented with violin plots indicate that the average of connections is significantly higher in the skin compared to the water and gut microbiomes in all treatments and at all time points. However, at T1 the connectivity converged (which means not significantly different) between the water and skin microbiome for cadmium-treated groups. The average of nodes’ degree computed with Network Analyzer was compared using the Kruskal-Wallis test followed by Benjamini-Hochberg test. The value of 0.05 is the threshold of B-H p-value significance. Only the significant Dunn test p-values for pairwise comparisons are displayed on this figure, however in order to improve visibility, the significant p-values of Kruskal-wallis test for multiple groups comparisons were not plotted
Fig. 7
Fig. 7
Comparative analysis of stochasticity ratios averages between treatments. The NST values were computed using the NST model available in the R package. With this model the” Proportional fixed” null-model, Jaccard similarity coefficient (also known then as Ruzicka similarity) and n = 1000 for random permutations were used to compute the normalized stochasticity ratios. The NST in each group represented in violin plots were compared for their average using Kruskal-Wallis test followed by Benjamini-Hochberg as a multiple correction test. Only the significant Dunn test p-values for pairwise comparisons are displayed on this figure, however in order to improve visibility, the significant p-values of Kruskal-wallis test for multiple groups comparisons were not plotted

References

    1. Johnson KV-A, Foster KR. Why does the microbiome affect behaviour? Nat Rev Microbiol. 2018;16:647–655. doi: 10.1038/s41579-018-0014-3. - DOI - PubMed
    1. Stephens WZ, Burns AR, Stagaman K, Wong S, Rawls JF, Guillemin K, et al. The composition of the zebrafish intestinal microbial community varies across development. ISME J. 2016;10:644–654. doi: 10.1038/ismej.2015.140. - DOI - PMC - PubMed
    1. Sylvain F-É, Derome N. Vertically and horizontally transmitted microbial symbionts shape the gut microbiota ontogenesis of a skin-mucus feeding discus fish progeny. Sci Rep. 2017;7:5263. doi: 10.1038/s41598-017-05662-w. - DOI - PMC - PubMed
    1. Sherrill-Mix S, McCormick K, Lauder A, Bailey A, Zimmerman L, Li Y, et al. Allometry and ecology of the bilaterian gut microbiome. mBio. 2018;9:e00319–e00318. doi: 10.1128/mBio.00319-18. - DOI - PMC - PubMed
    1. Theis KR, Dheilly NM, Klassen JL, Brucker RM, Baines JF, Bosch TCG, et al. Getting the hologenome concept right: an eco-evolutionary framework for hosts and their microbiomes. mSystems. 2016;1-2:e00028-16. - PMC - PubMed

LinkOut - more resources