. 2021 Jan 26;11(1):e042945.
doi: 10.1136/bmjopen-2020-042945.

Hospital bed capacity and usage across secondary healthcare providers in England during the first wave of the COVID-19 pandemic: a descriptive analysis

Affiliations

Hospital bed capacity and usage across secondary healthcare providers in England during the first wave of the COVID-19 pandemic: a descriptive analysis

Bilal Akhter Mateen et al. BMJ Open. .

Abstract

Objective: In this study, we describe the pattern of bed occupancy across England during the peak of the first wave of the COVID-19 pandemic.

Design: Descriptive survey.

Setting: All non-specialist secondary care providers in England from 27 March27to 5 June 2020.

Participants: Acute (non-specialist) trusts with a type 1 (ie, 24 hours/day, consultant-led) accident and emergency department (n=125), Nightingale (field) hospitals (n=7) and independent sector secondary care providers (n=195).

Main outcome measures: Two thresholds for 'safe occupancy' were used: 85% as per the Royal College of Emergency Medicine and 92% as per NHS Improvement.

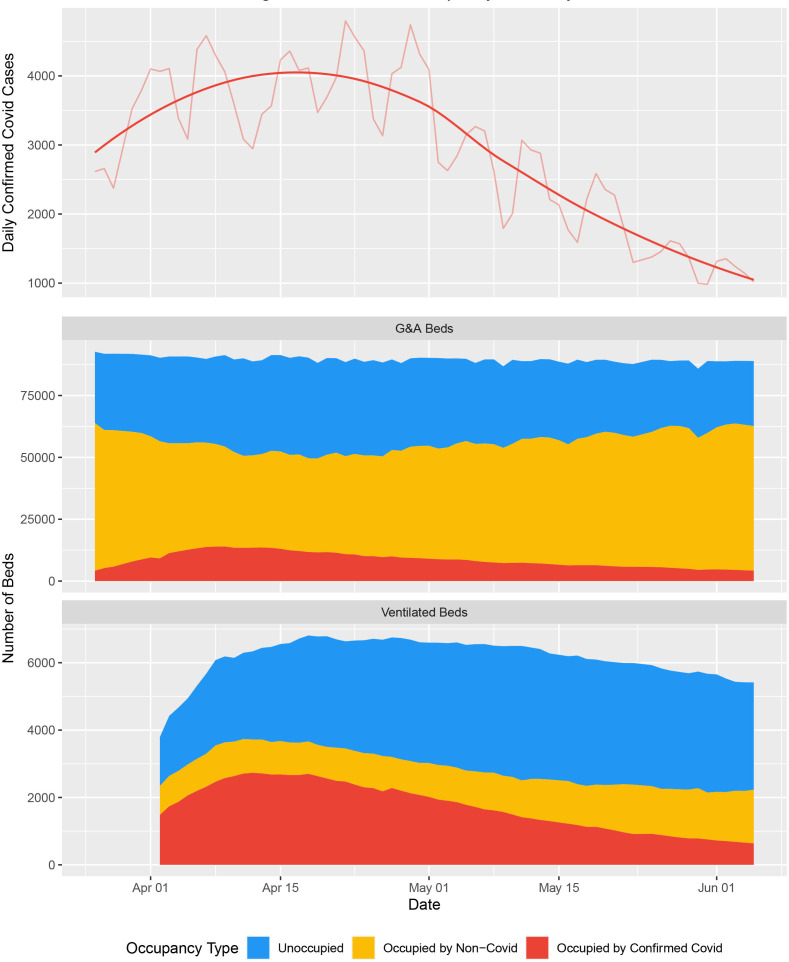
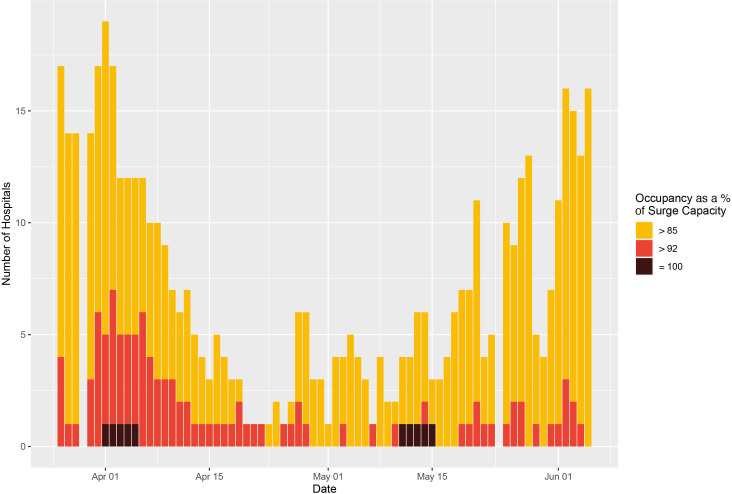
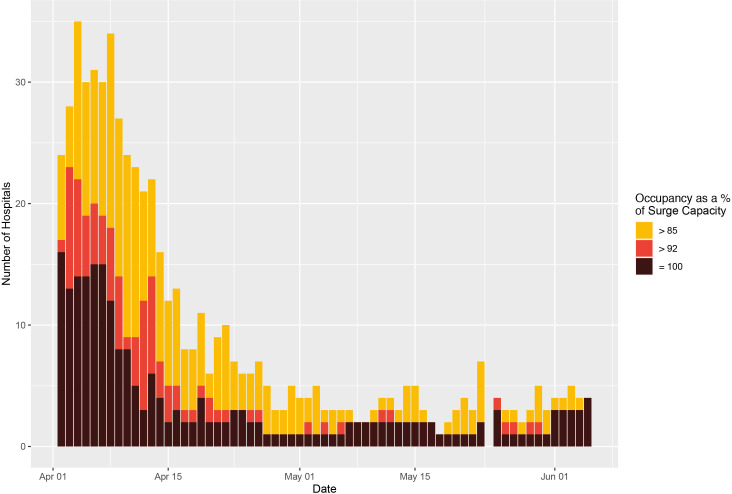
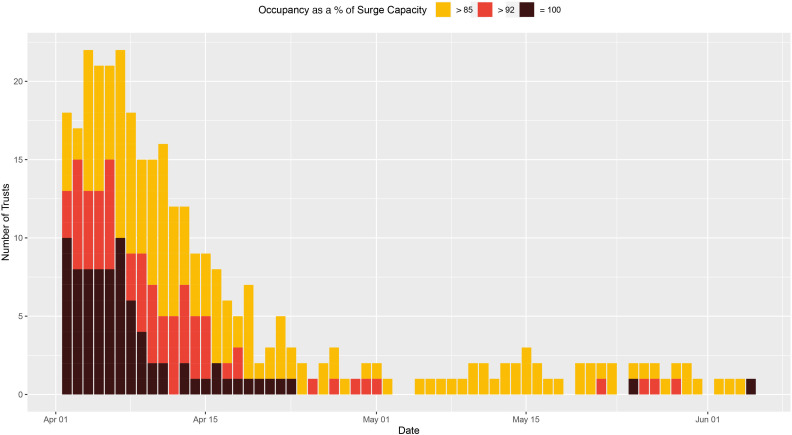
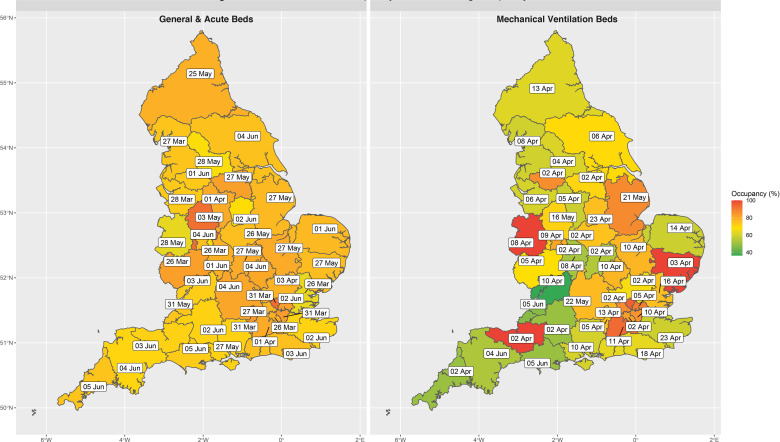
Results: At peak availability, there were 2711 additional beds compatible with mechanical ventilation across England, reflecting a 53% increase in capacity, and occupancy never exceeded 62%. A consequence of the repurposing of beds meant that at the trough there were 8.7% (8508) fewer general and acute beds across England, but occupancy never exceeded 72%. The closest to full occupancy of general and acute bed (surge) capacity that any trust in England reached was 99.8% . For beds compatible with mechanical ventilation there were 326 trust-days (3.7%) spent above 85% of surge capacity and 154 trust-days (1.8%) spent above 92%. 23 trusts spent a cumulative 81 days at 100% saturation of their surge ventilator bed capacity (median number of days per trust=1, range: 1-17). However, only three sustainability and transformation partnerships (aggregates of geographically co-located trusts) reached 100% saturation of their mechanical ventilation beds.

Conclusions: Throughout the first wave of the pandemic, an adequate supply of all bed types existed at a national level. However, due to an unequal distribution of bed utilisation, many trusts spent a significant period operating above 'safe-occupancy' thresholds despite substantial capacity in geographically co-located trusts, a key operational issue to address in preparing for future waves.

Keywords: COVID-19; health policy; intensive & critical care; public health.


Conflict of interest statement

Competing interests: AM declares previous research funding from Eli Lilly and Company, Pfizer and AstraZeneca. SV declares funding from IQVIA. All other authors declare no competing interests.

Figures

Figure 1
Figure 1
National and regional bed occupancy. (Top) An epidemic curve showing the number of confirmed cases of COVID-19 across England based on the date that the specimen was taken; raw data are available at https://coronavirus.data.gov.uk/details/cases?areaType=nation&areaName=England. The superimposed highly saturated solid line represents a smoothened function of the raw data, whereas the less saturated solid line represents the underlying raw values. The former is based on the ggplot loess fit for trend lines, using local polyregression curve fitting. (Middle) Total capacity and occupancy status for general and acute (G&A) beds at the national level over the course of the first wave. (Bottom) Total capacity and occupancy status for beds compatible with mechanical ventilation at the national level.
Figure 2
Figure 2
Total bed occupancy in each of the seven regions of England. (Top) COVID-19-specific occupancy in each of the seven regions across England for both general and acute (G&A; left) beds and beds compatible with mechanical ventilation (right). (Bottom) Total occupancy (COVID-19 positive and negative) in each of the seven regions across England for both G&A (left) beds and beds compatible with mechanical ventilation (right). The highly saturated solid line represents a smoothened function of the raw data, whereas the less saturated solid line represents the underlying raw values. The former is based on the ggplot loess fit for trend lines, using local polyregression curve fitting.
Figure 3
Figure 3
Hospital-level general and acute bed occupancy (based on surge capacities) across England. The number of hospitals with general and acute bed occupancy in excess of the thresholds for ‘safe and effective’ functioning, that is, 85% as defined by the Royal College of Emergency Medicine, and 92% as defined by NHS Improvement and NHS England (yellow and red, respectively), across England, from 26 March to 5 June. All data were missing for 29 March and 24 May. NHS, National Health Service.
Figure 4
Figure 4
Hospital-level ventilator bed occupancy (based on baseline capacities) across England. The number of hospitals with occupancy of mechanical ventilation beds in excess of the thresholds for ‘safe and effective’ functioning, that is, 85% as defined by the Royal College of Emergency Medicine, and 92% as defined by NHS Improvement and NHS England (yellow and red, respectively), across England, from 1 April to 5 June. All data were missing for 24 May. NHS, National Health Service.
Figure 5
Figure 5
Trust-level ventilator bed occupancy (based on surge capacities) across England. The number of trusts with occupancy of mechanical ventilation beds in excess of the thresholds for ‘safe and effective’ functioning, that is, 85% as defined by the Royal College of Emergency Medicine, and 92% as defined by NHS Improvement and NHS England (yellow and red, respectively), across England, from 26 March to 5 June. All data were missing for 29 March and 24 May. Several hospitals reported values consistent with 100% occupancy (black). NHS, National Health Service.
Figure 6
Figure 6
Peak STP bed occupancy across England. The date on which general and acute bed occupancy (left) and mechanical ventilator beds (right) peaked, based on surge capacities at the STP level across England. The geotemporal pattern of peak occupancy clearly demonstrates that there was always residual general and acute bed capacity at the STP level and that all regions across England experienced similar levels of saturation. However, saturation of mechanical ventilator beds differed substantially by location. STP, sustainability and transformation partnership.

References

    1. The King’s Fund NHS Hospital bed numbers, 2020. Available: https://www.kingsfund.org.uk/publications/nhs-hospital-bed-numbers [Accessed 21 June 2020].
    1. Appleby J. The hospital bed: on its way out? BMJ 2013;346:f1563. 10.1136/bmj.f1563 - DOI - PubMed
    1. The Health Foundation The NHS this winter: looking beneath the National view | the health Foundation. Available: https://www.health.org.uk/news-and-comment/blogs/the-nhs-this-winter-loo... [Accessed 21 Jun 2020].
    1. British Medical Association Bed occupancy in the NHS - Pressures - BMA. The British Medical Association is the trade union and professional body for doctors in the UK, 2020. Available: https://www.bma.org.uk/advice-and-support/nhs-delivery-and-workforce/pre... [Accessed 21 Jun 2020].
    1. Bagust A, Place M, Posnett JW. Dynamics of bed use in accommodating emergency admissions: stochastic simulation model. BMJ 1999;319:155–8. 10.1136/bmj.319.7203.155 - DOI - PMC - PubMed

Publication types

LinkOut - more resources