. 2021 Apr 16;8(2):ENEURO.0499-20.2021.
doi: 10.1523/ENEURO.0499-20.2021. Print 2021 Mar-Apr.

Aberrant Axo-Axonic Synaptic Reorganization in the Phosphorylated L1-CAM/Calcium Channel Subunit α2δ-1-Containing Central Terminals of Injured c-Fibers in the Spinal Cord of a Neuropathic Pain Model

Affiliations

Aberrant Axo-Axonic Synaptic Reorganization in the Phosphorylated L1-CAM/Calcium Channel Subunit α2δ-1-Containing Central Terminals of Injured c-Fibers in the Spinal Cord of a Neuropathic Pain Model

Hiroki Yamanaka et al. eNeuro. .

Abstract

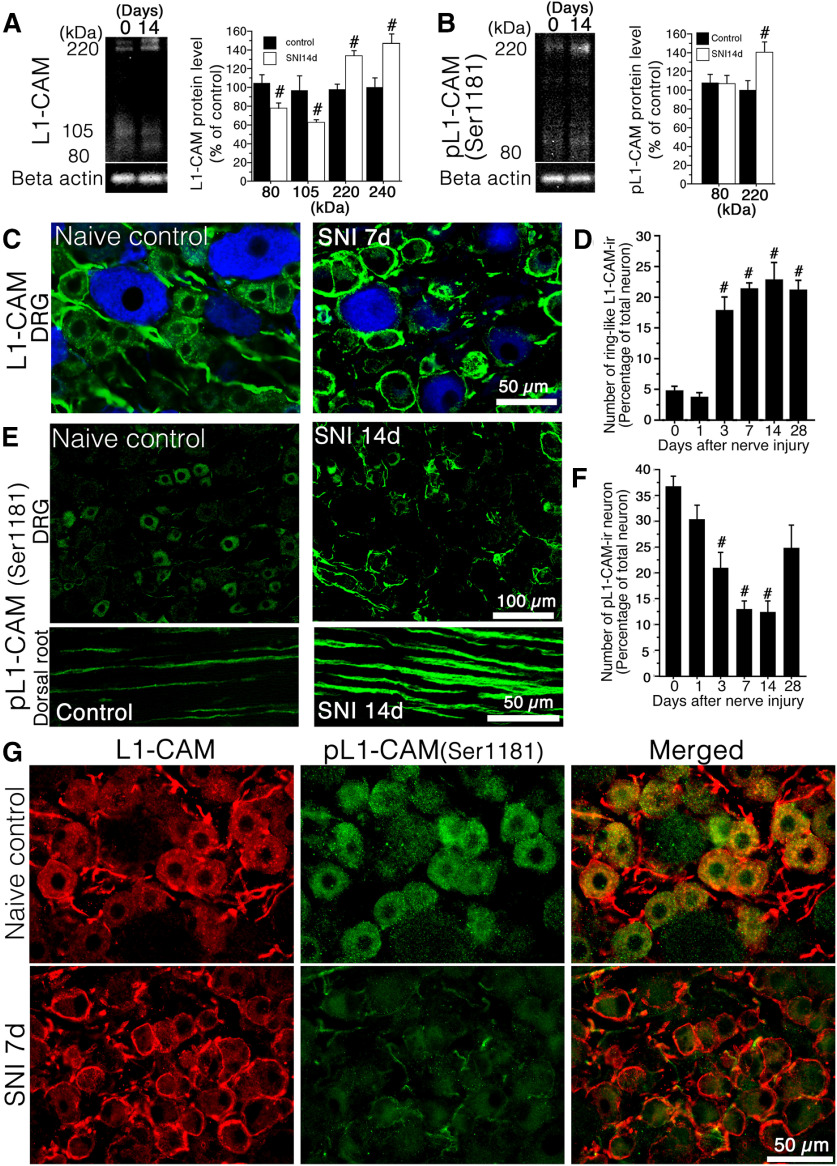
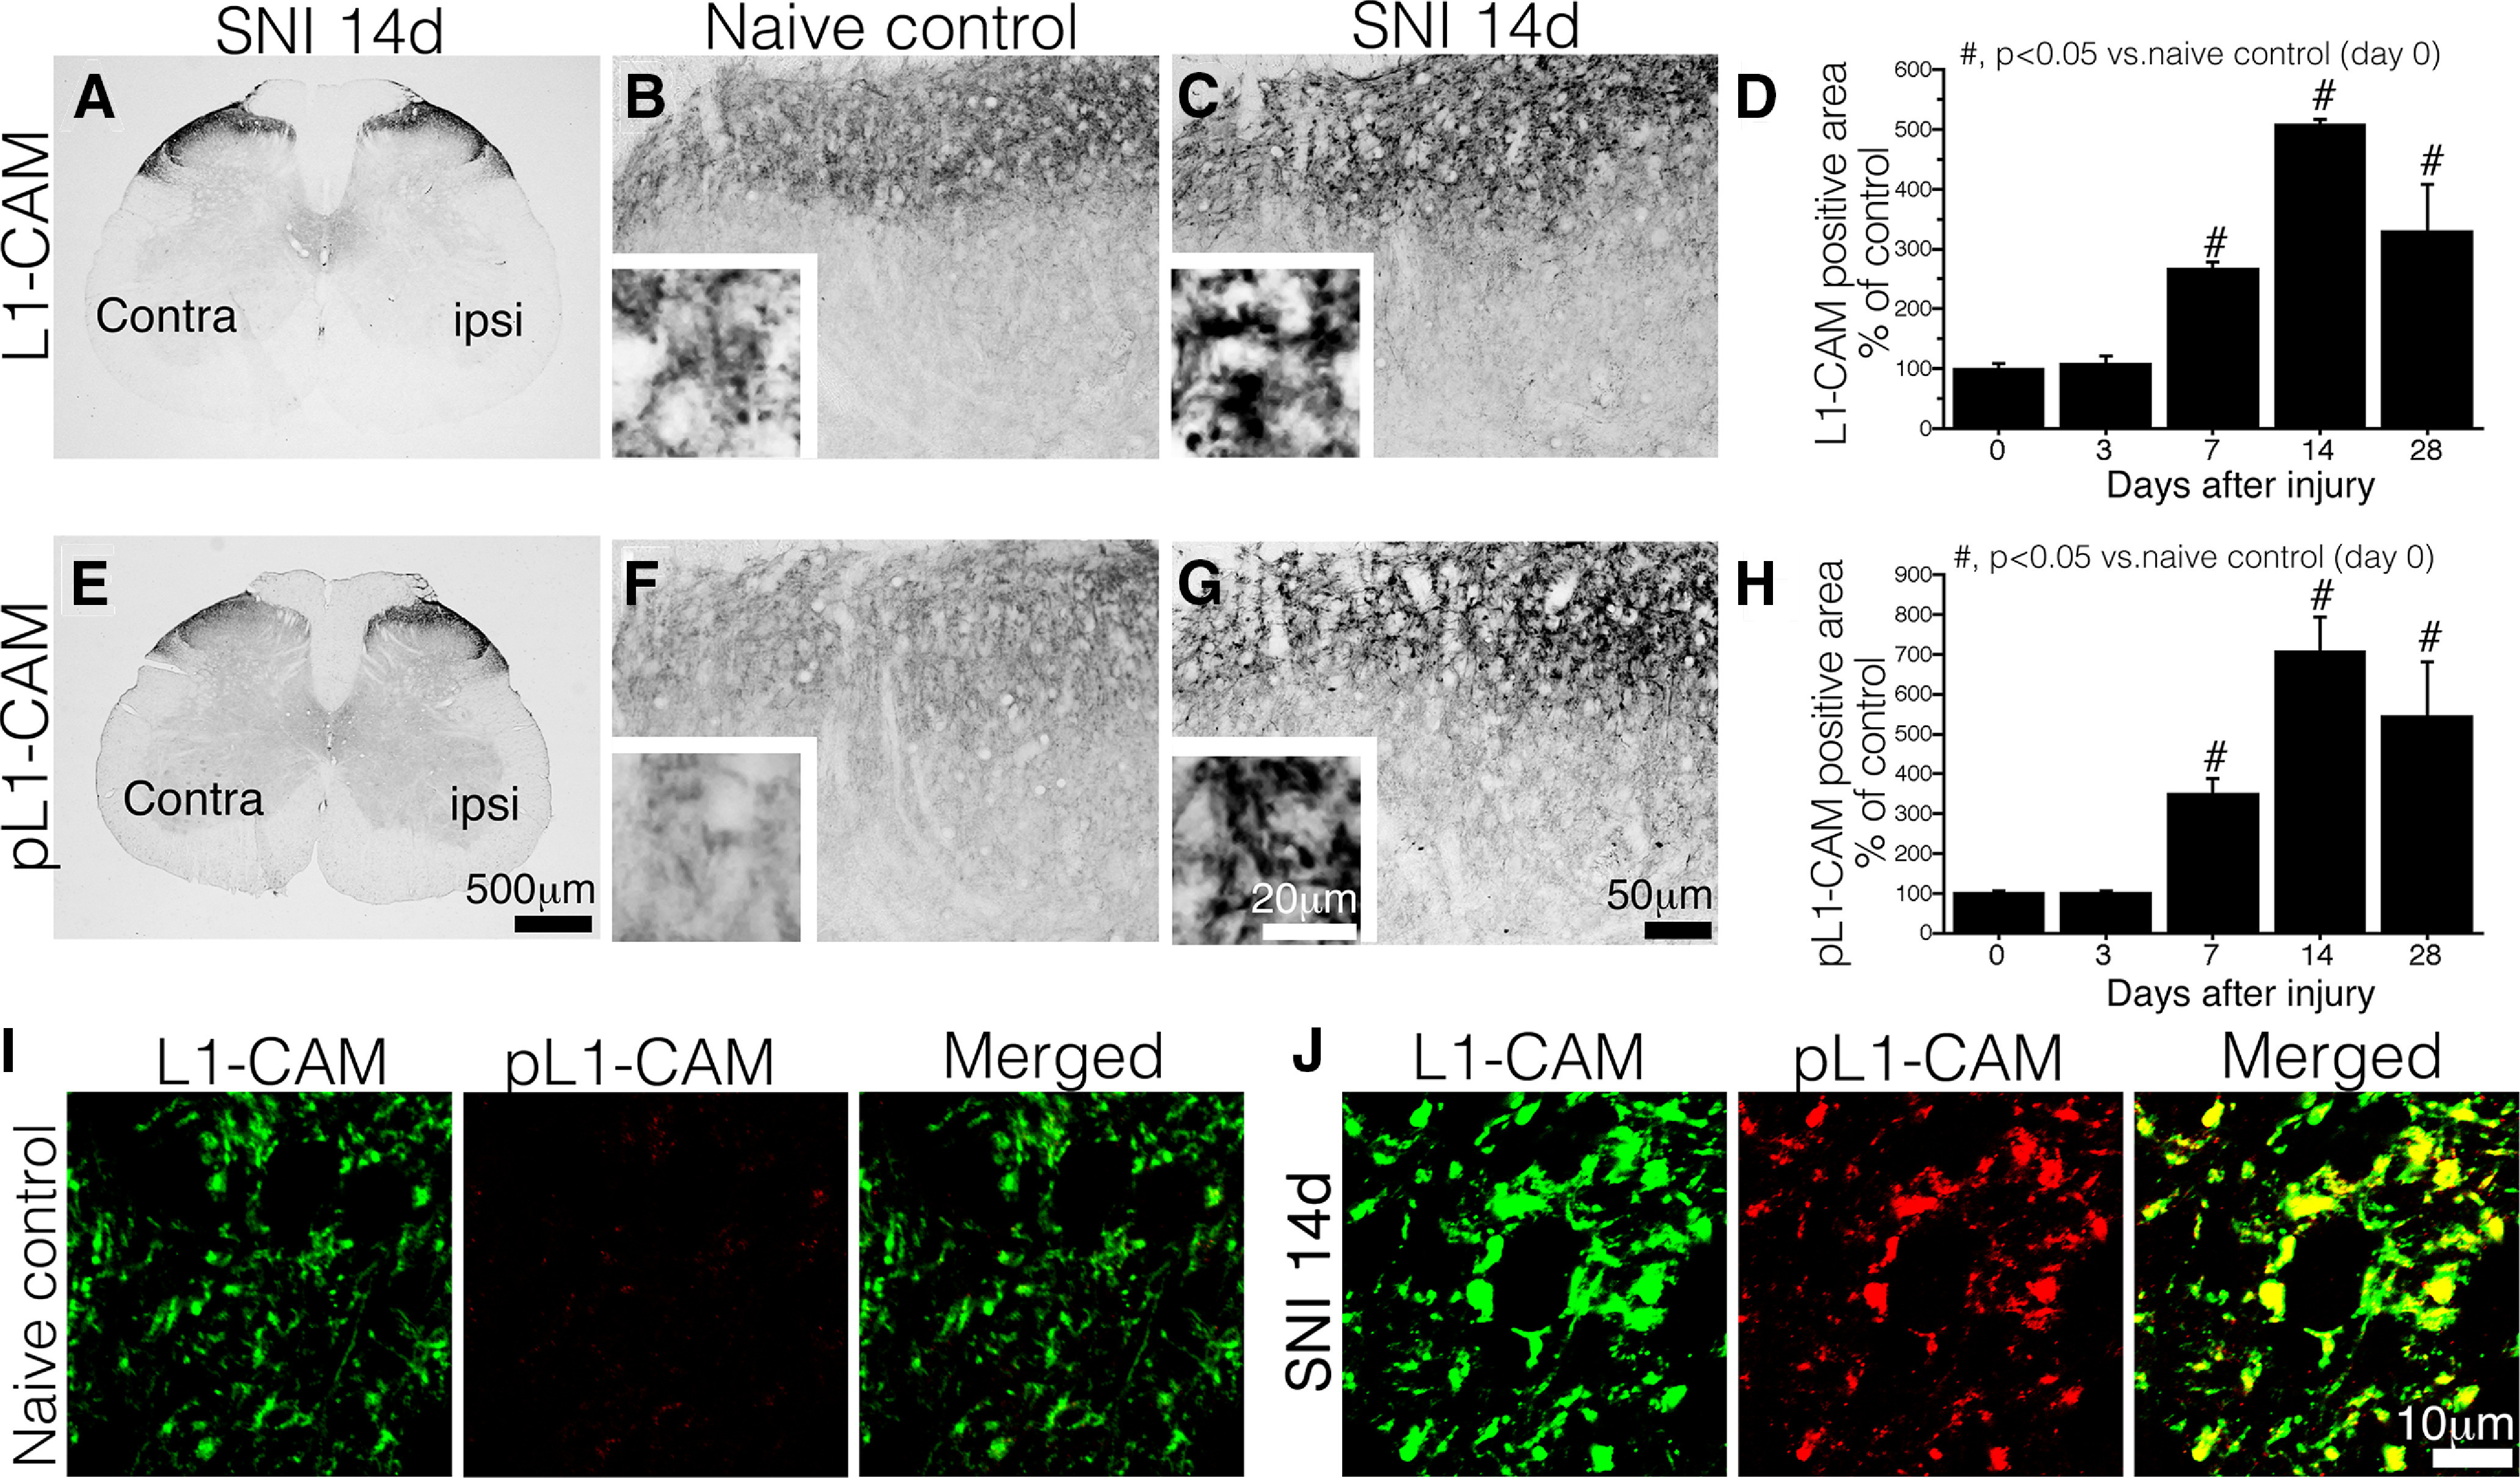
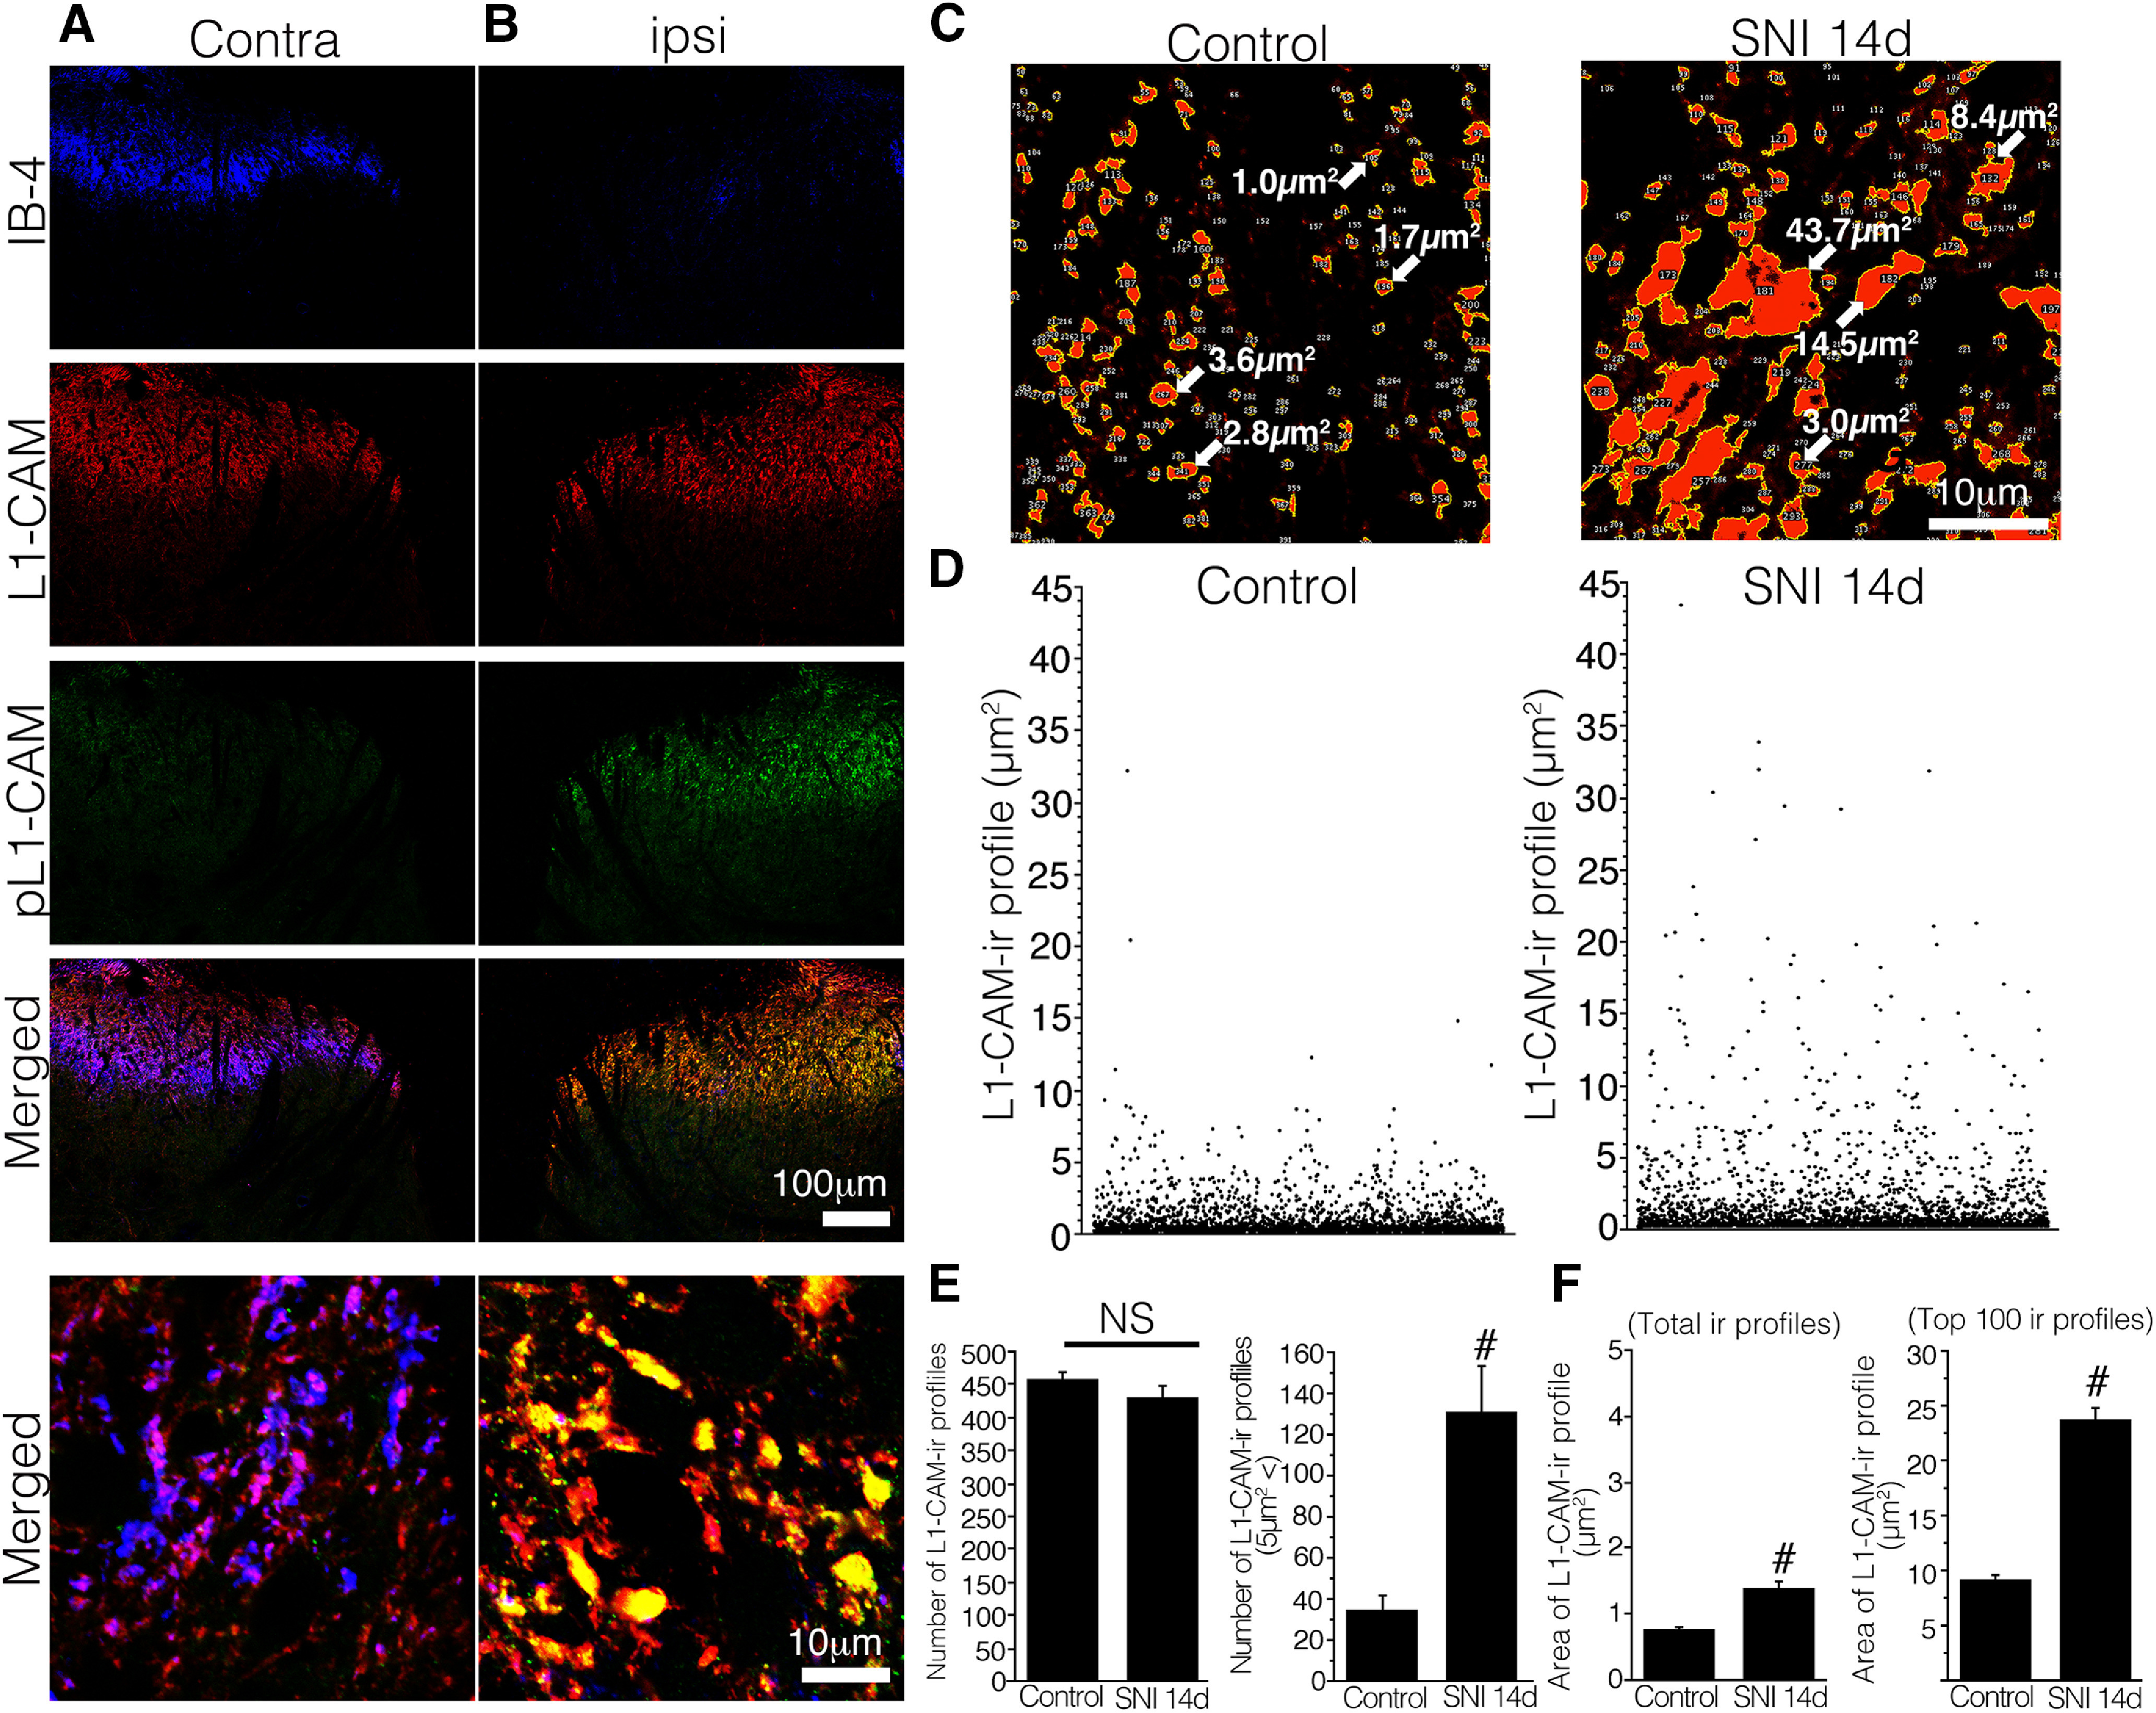
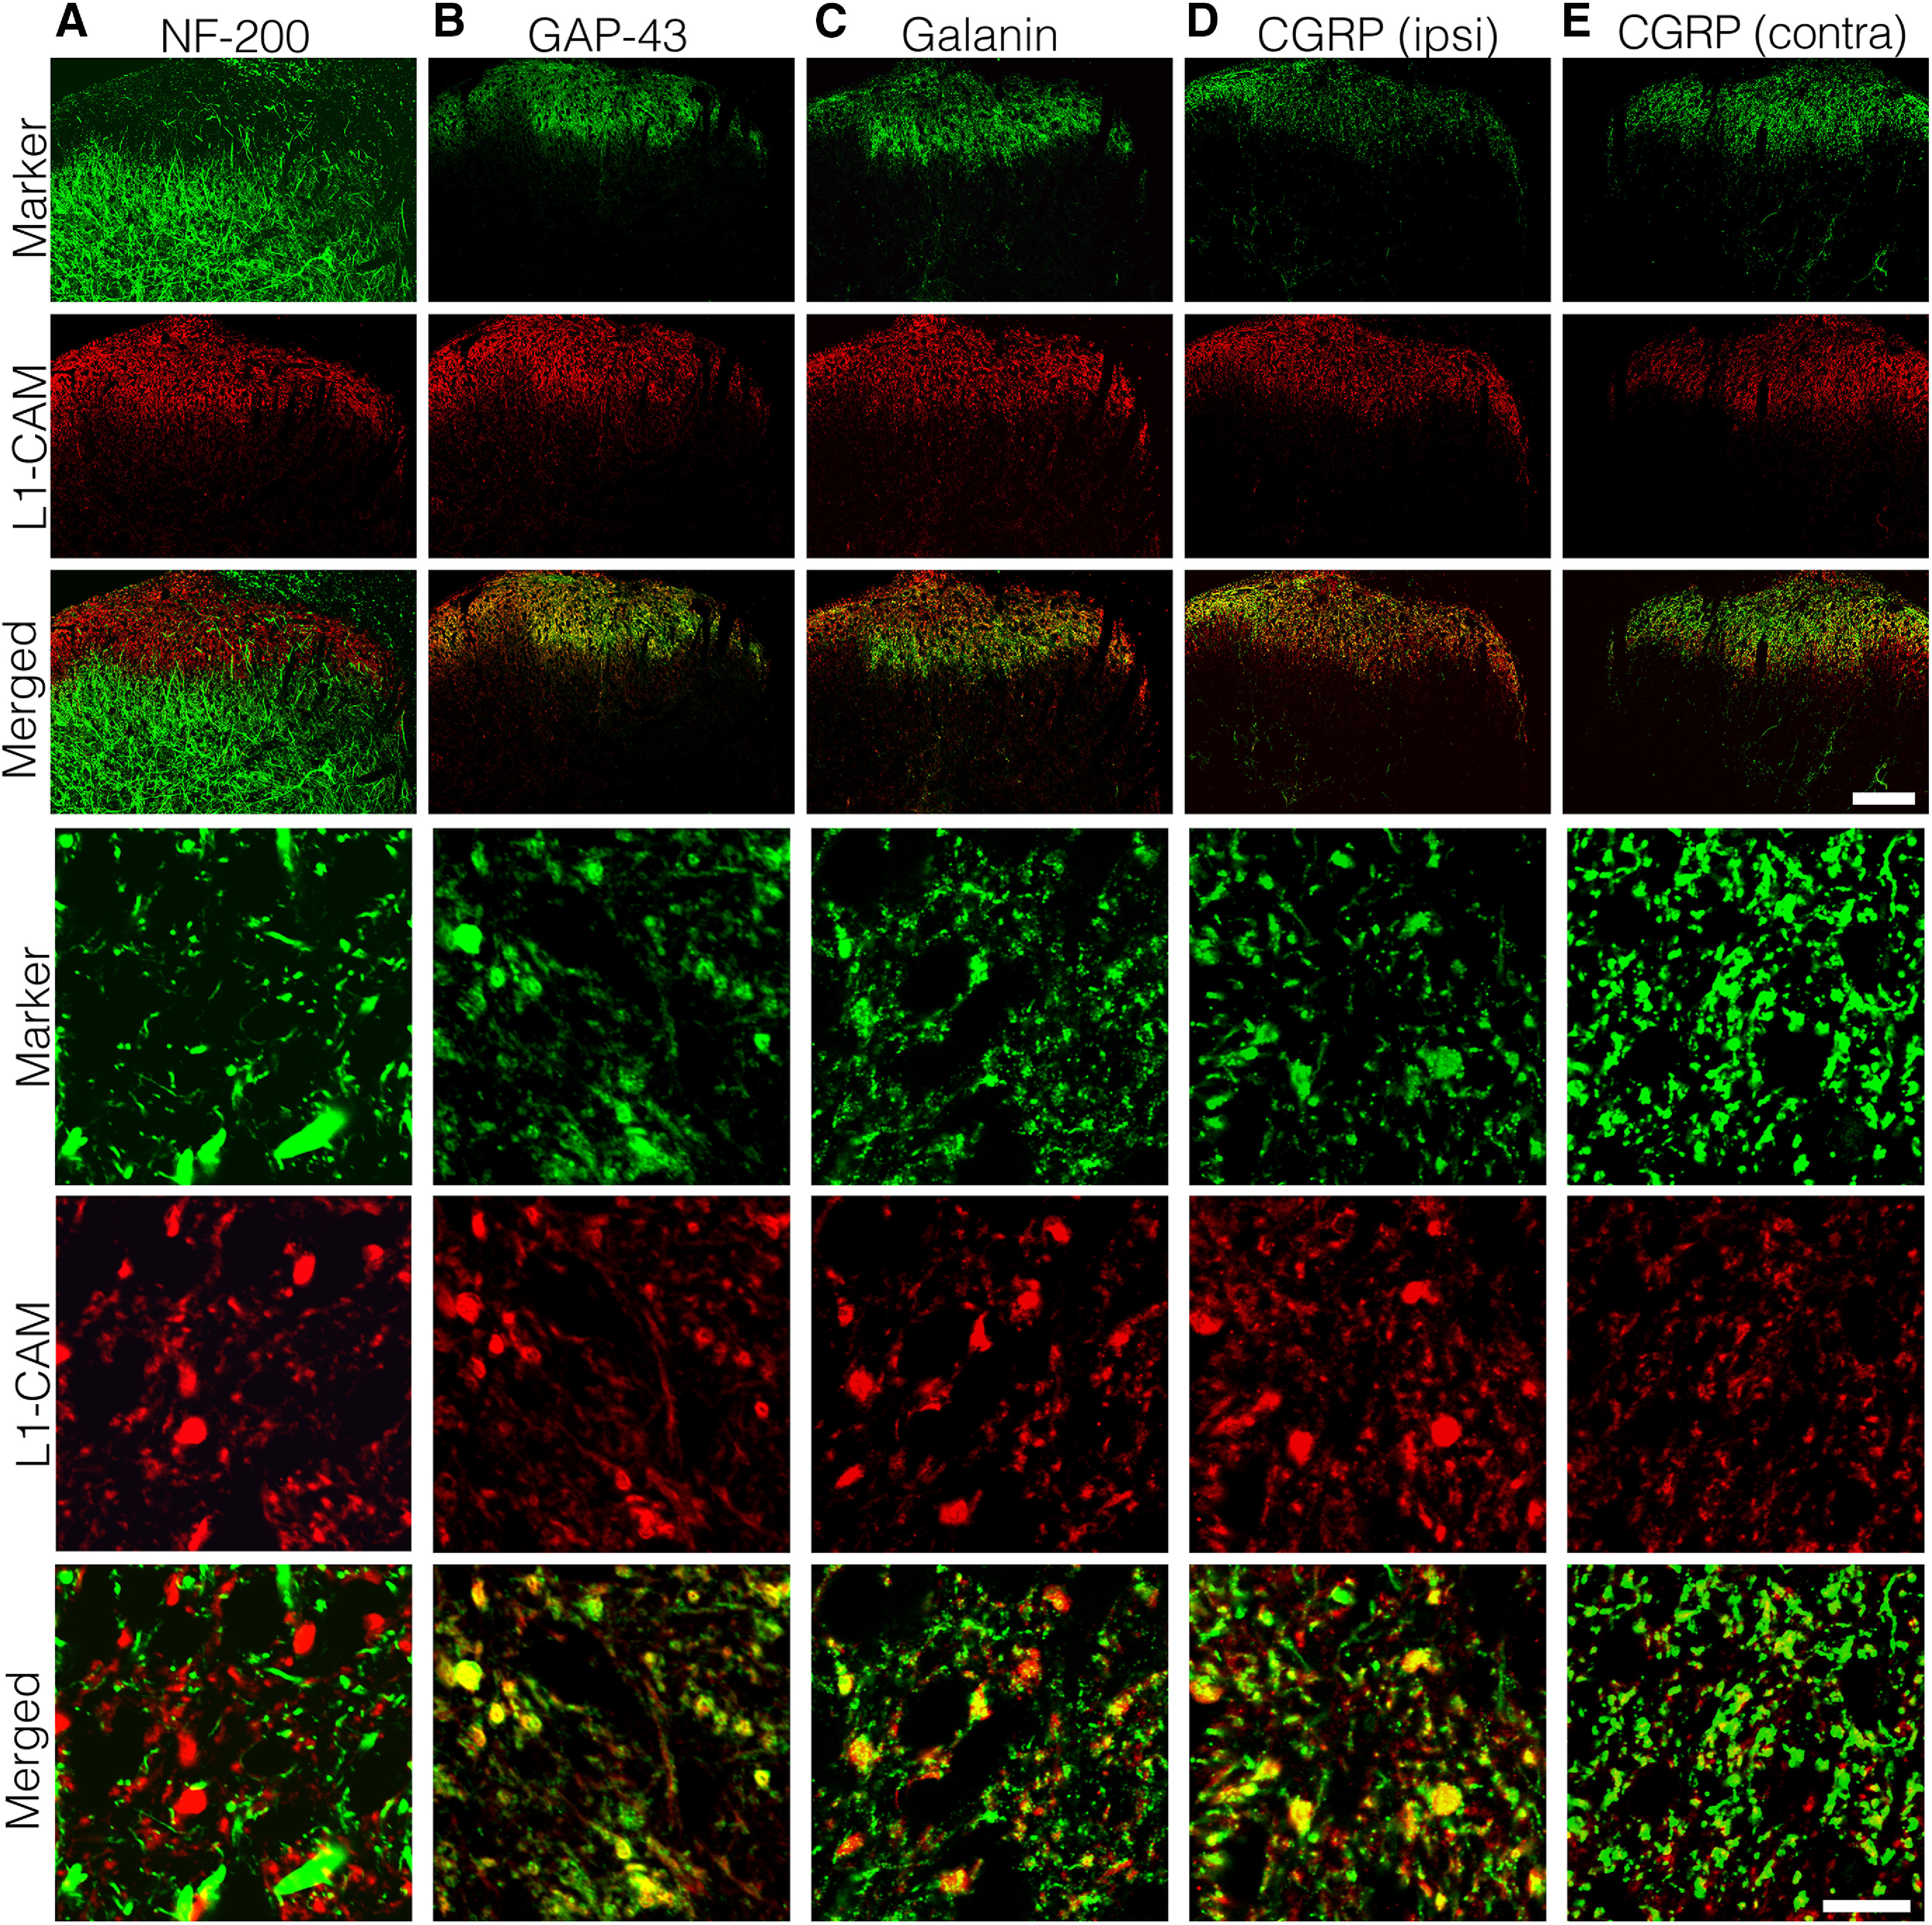
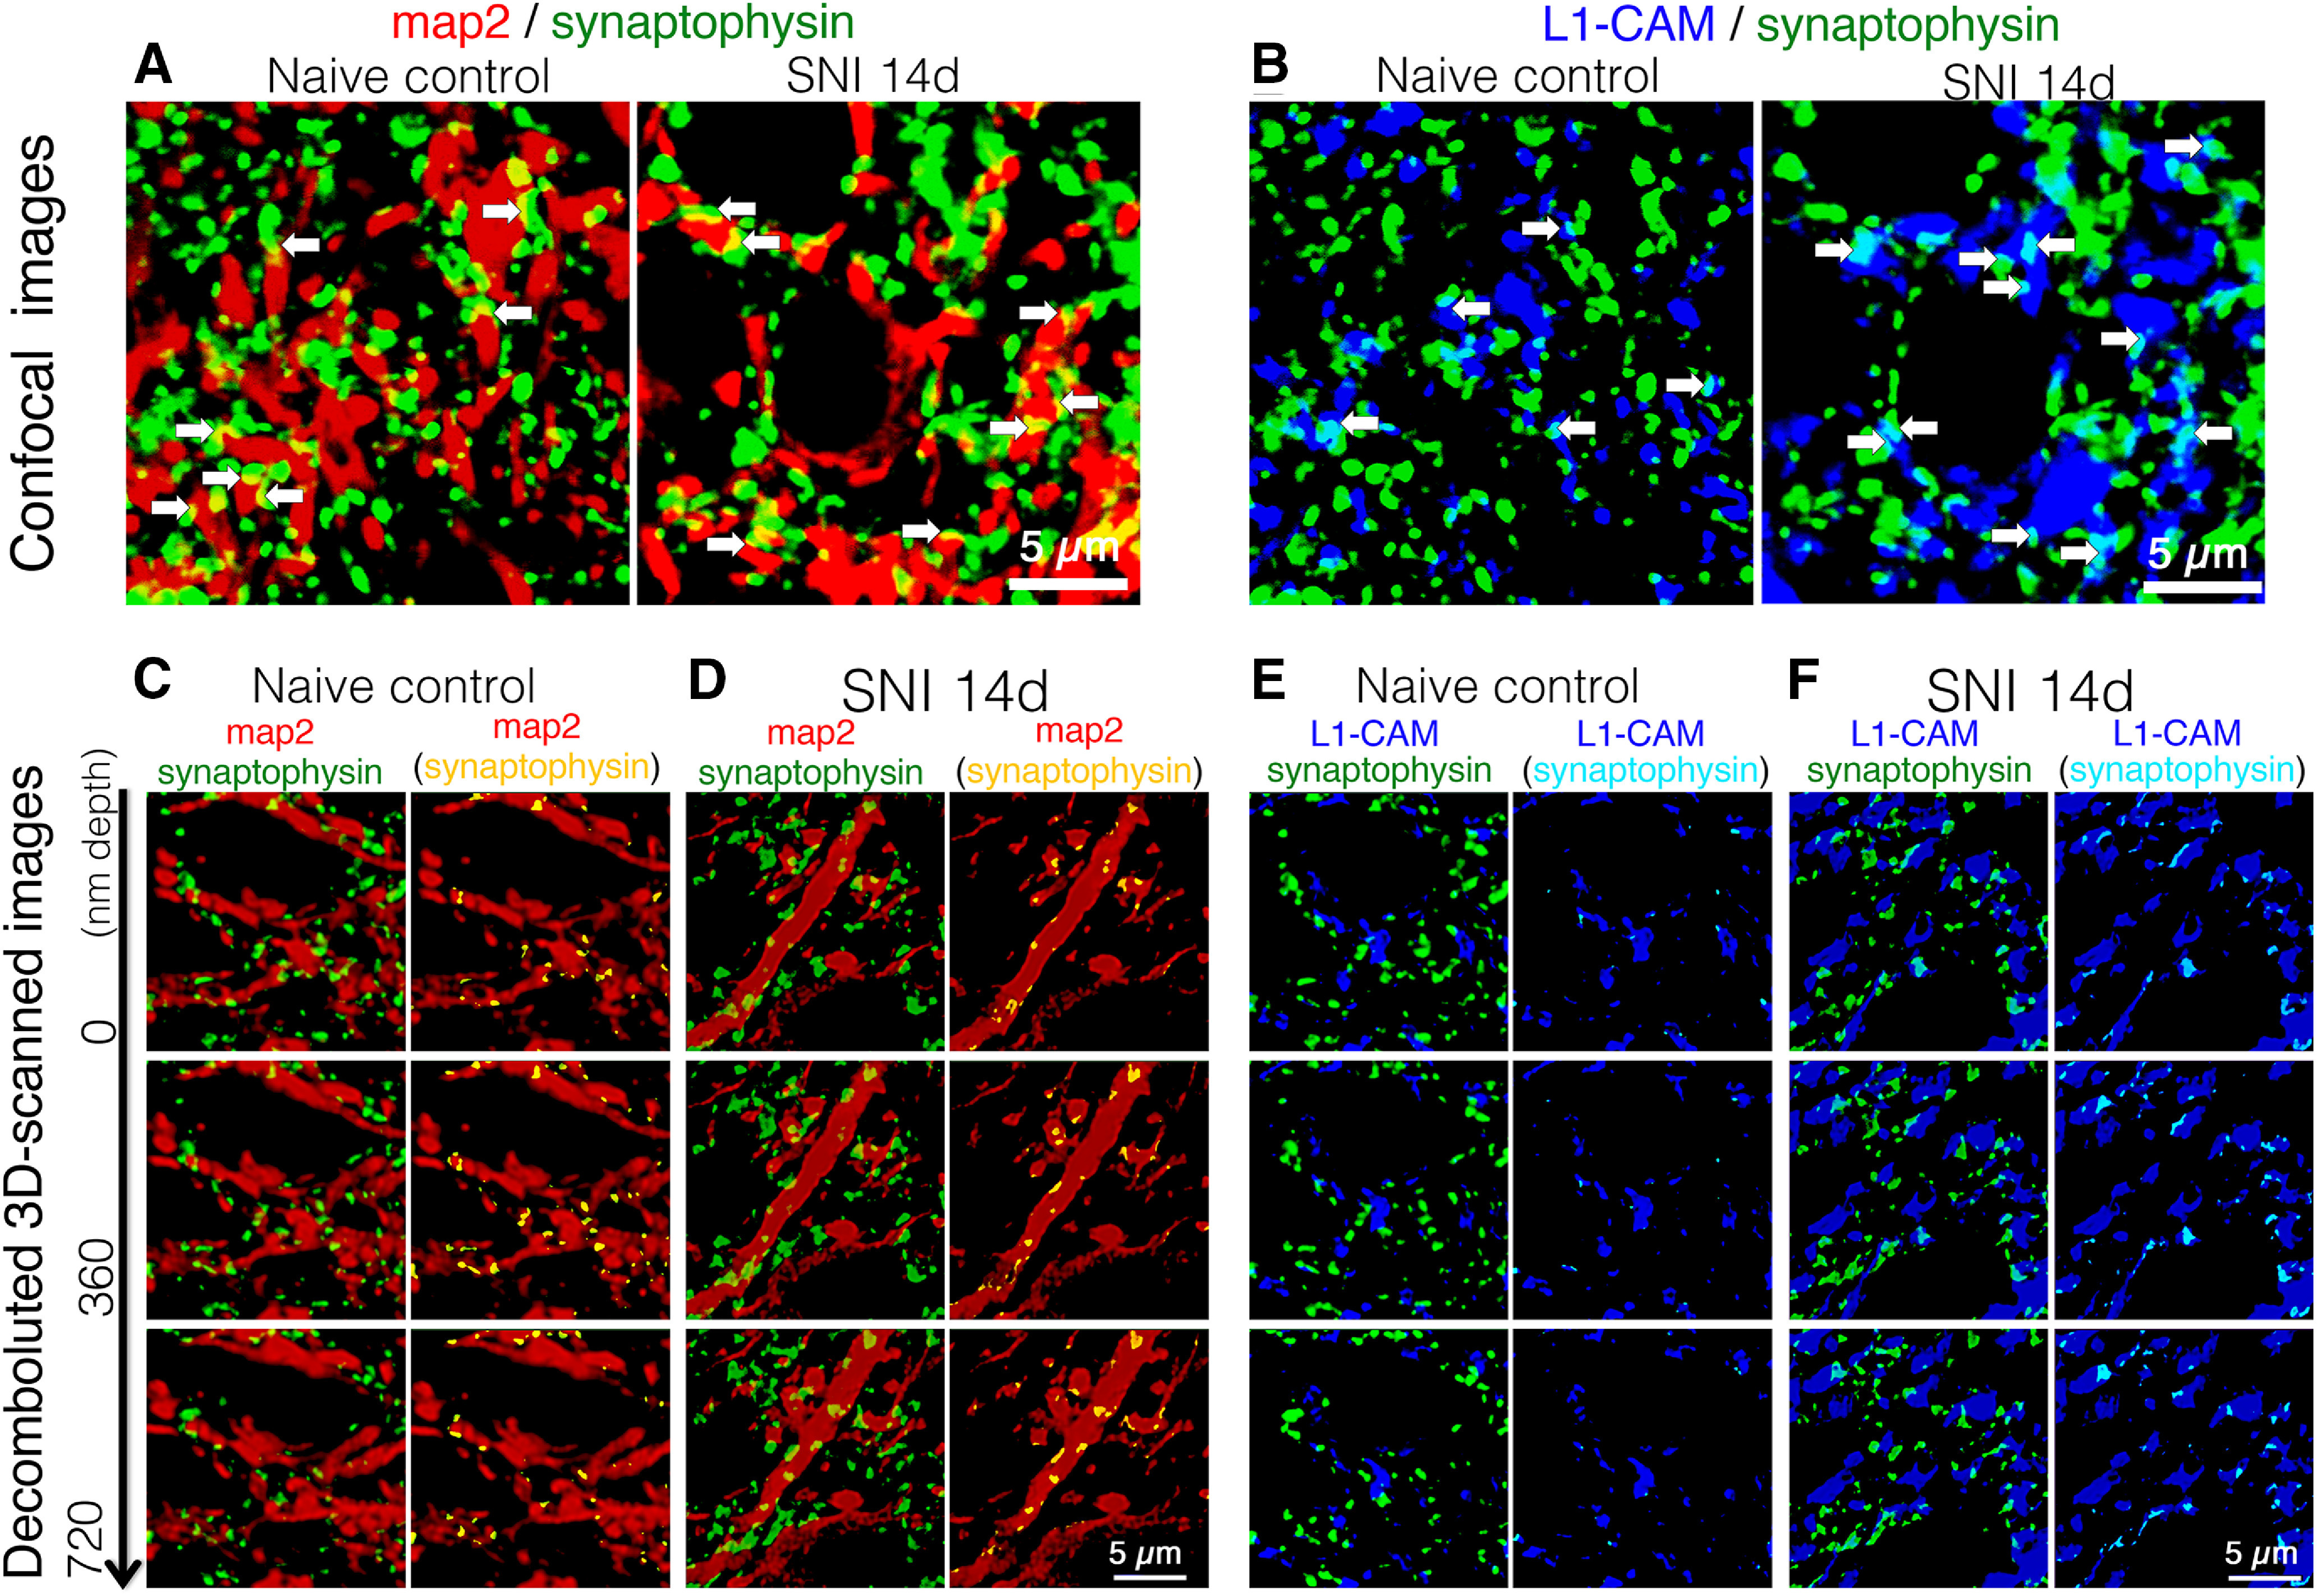
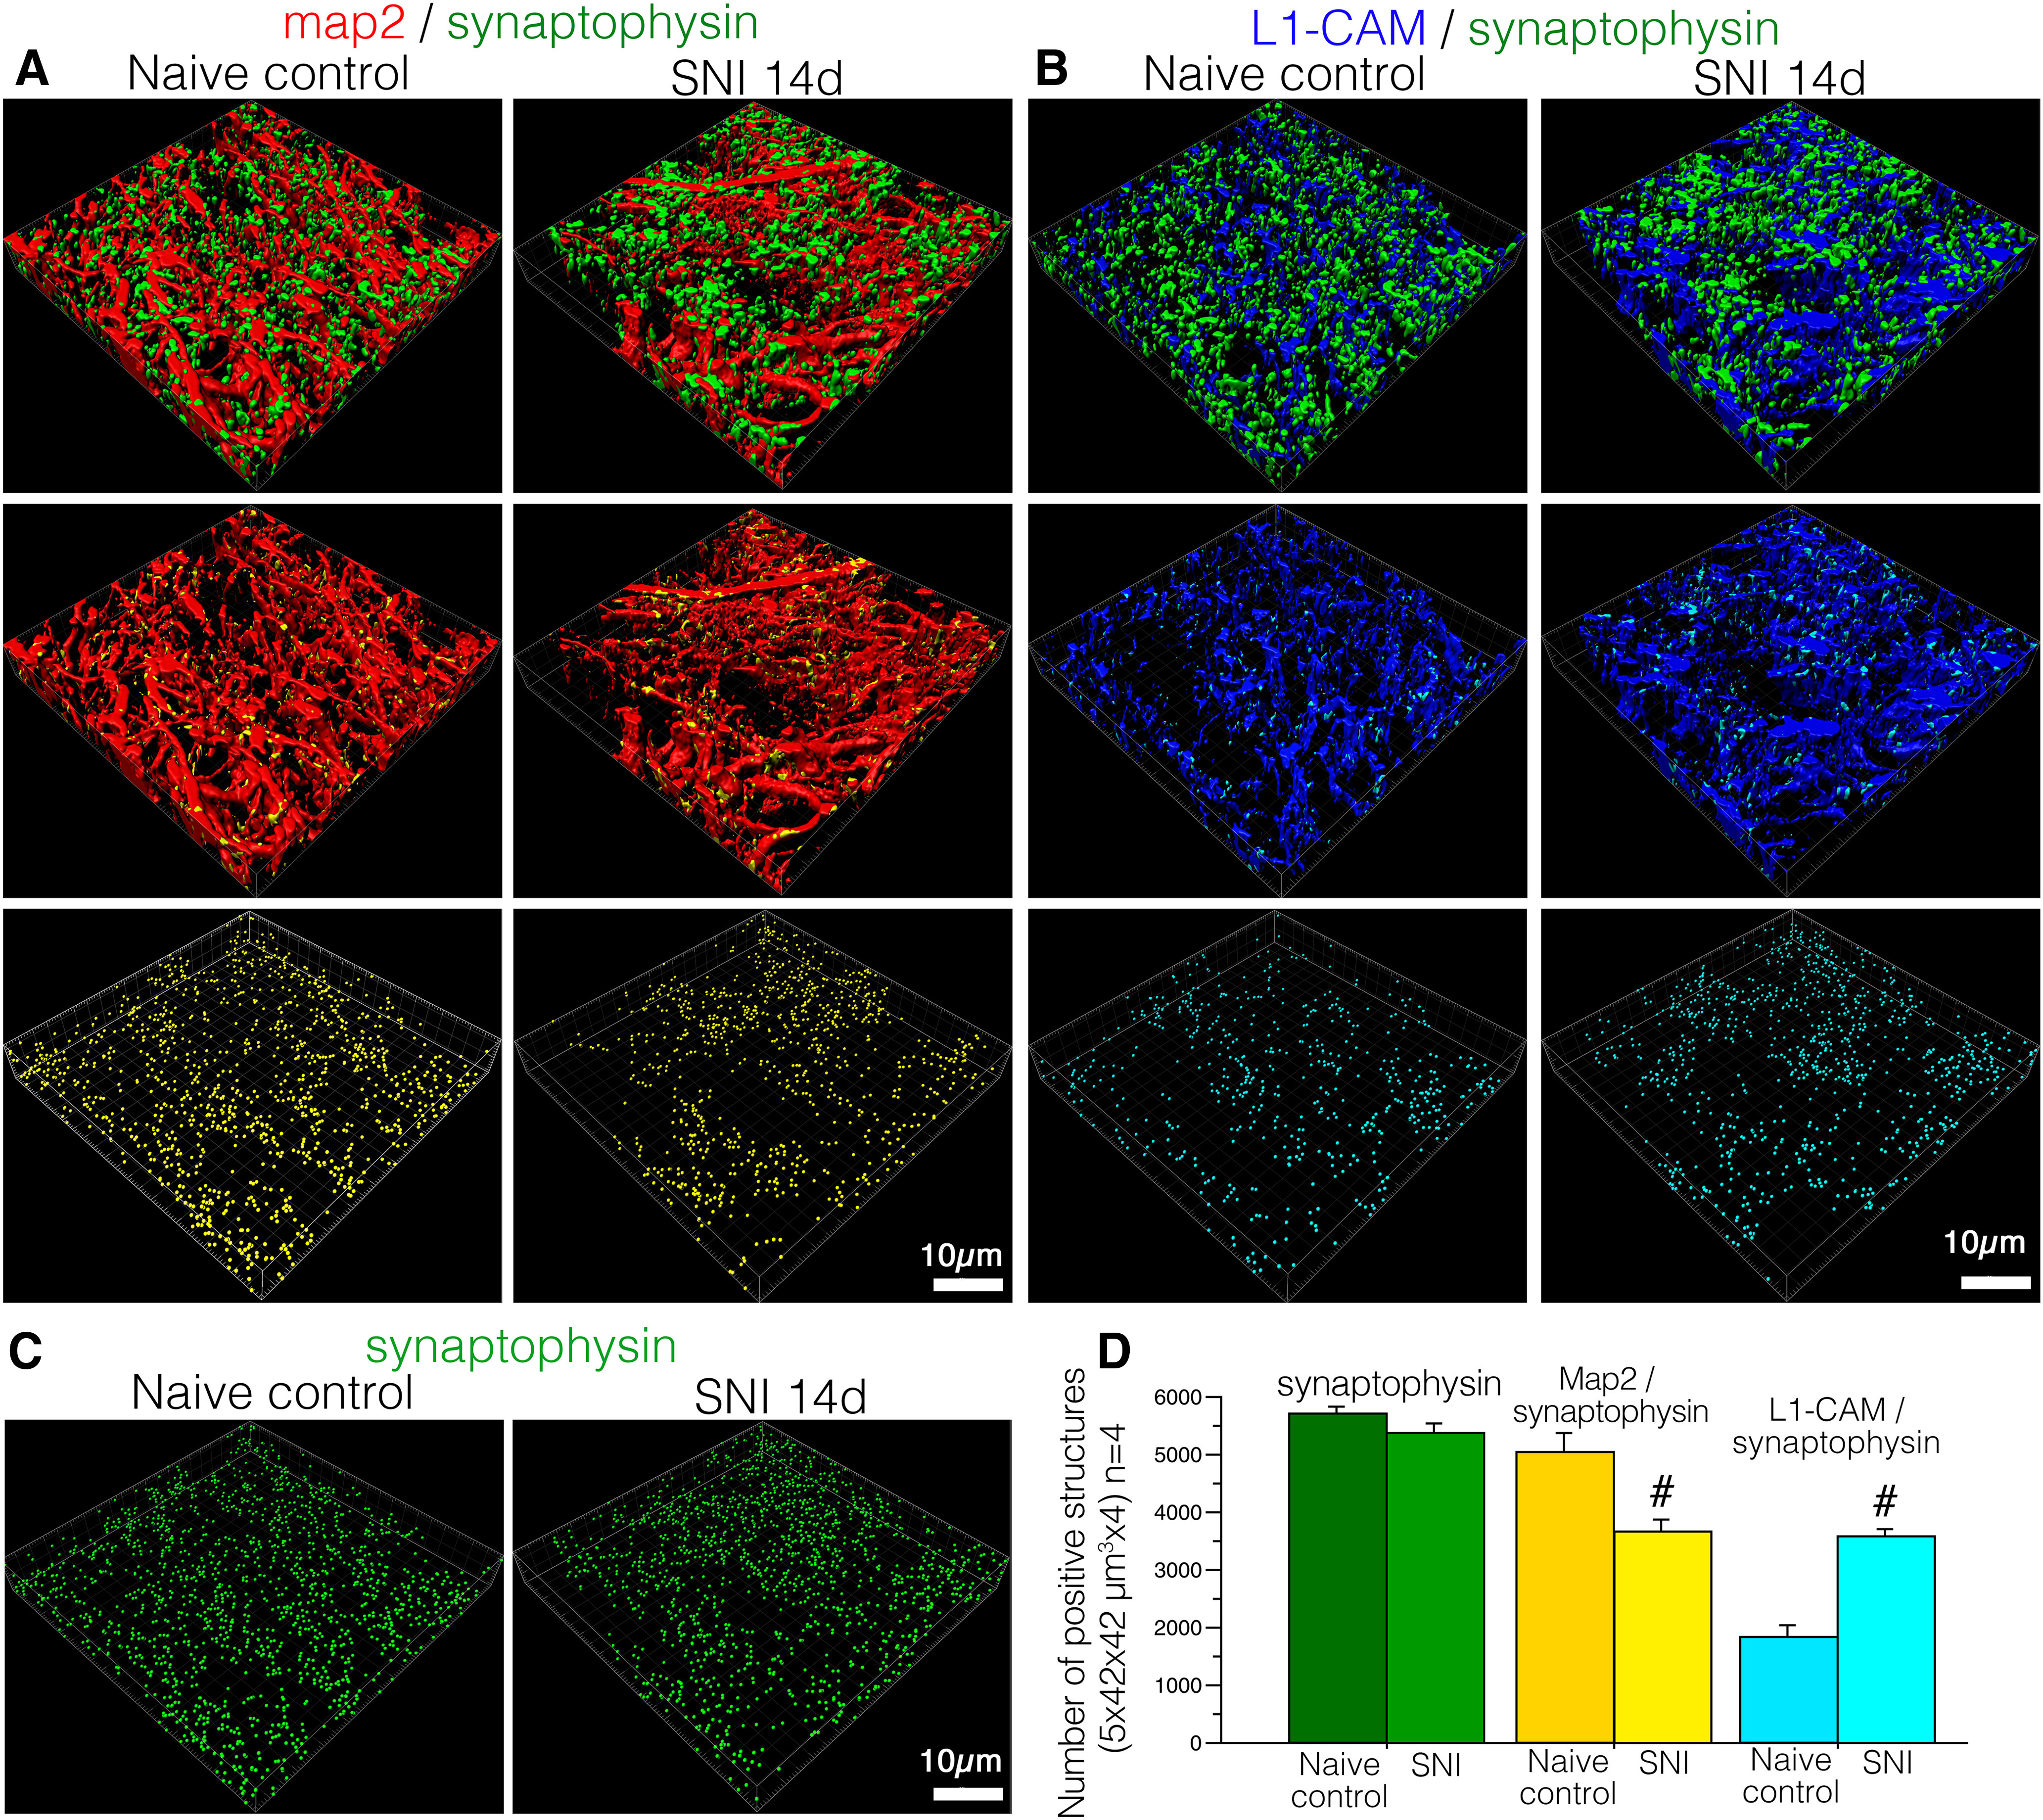
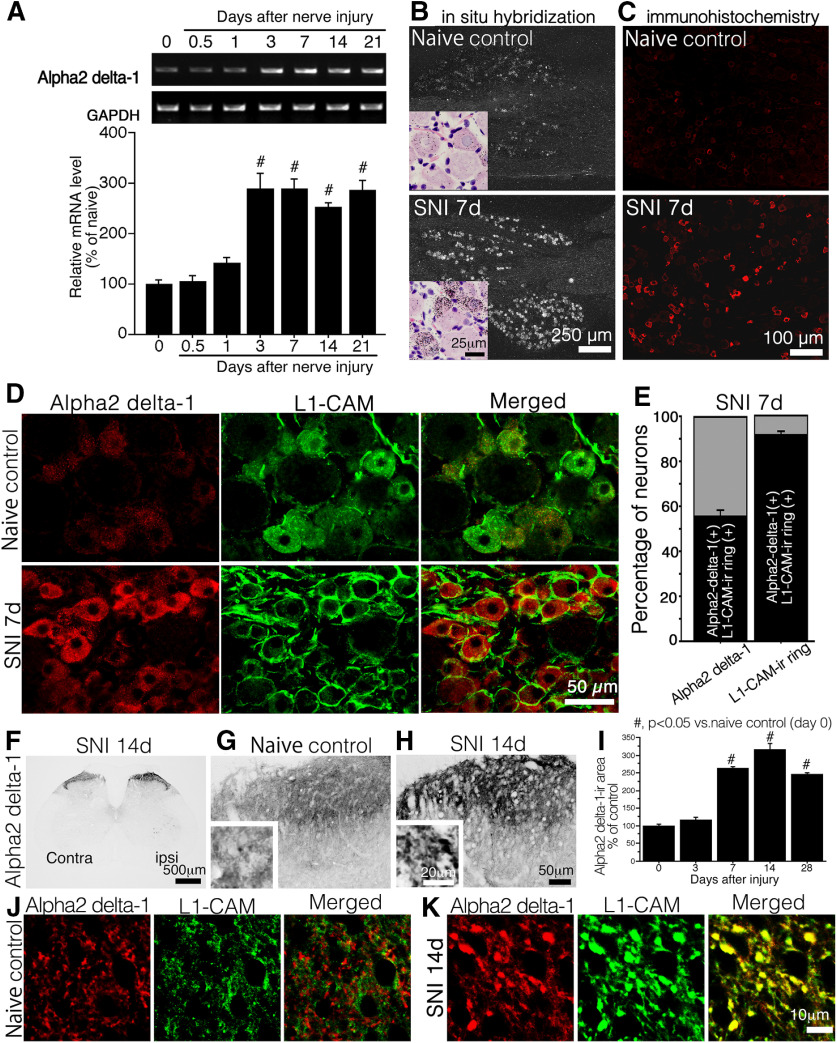
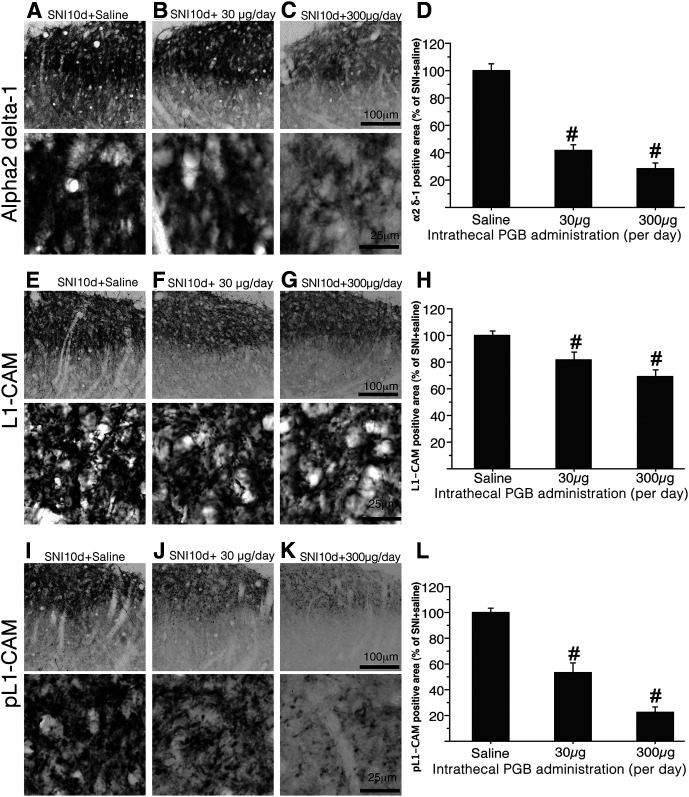
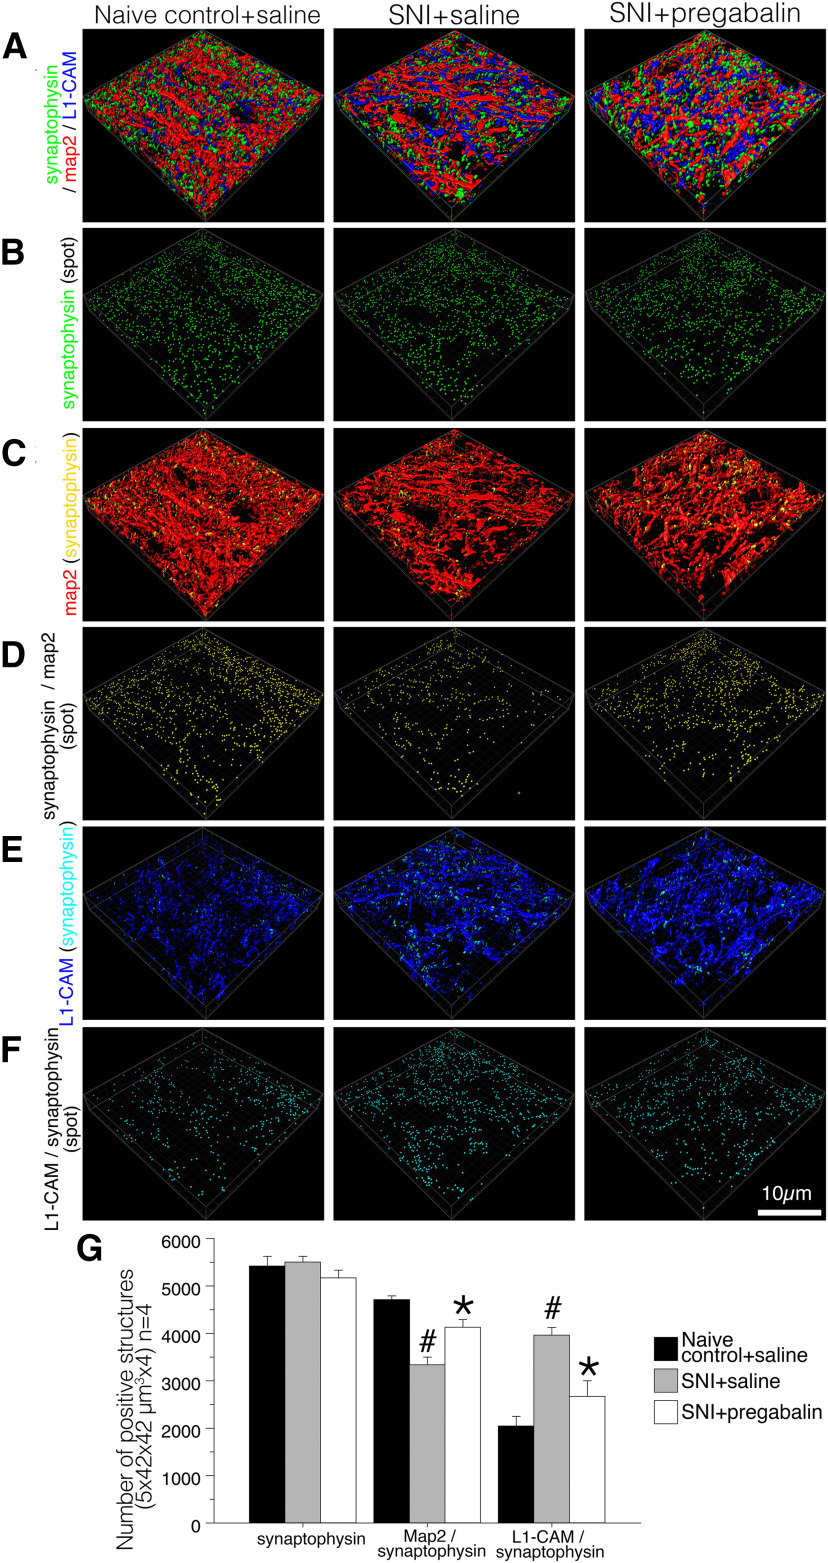
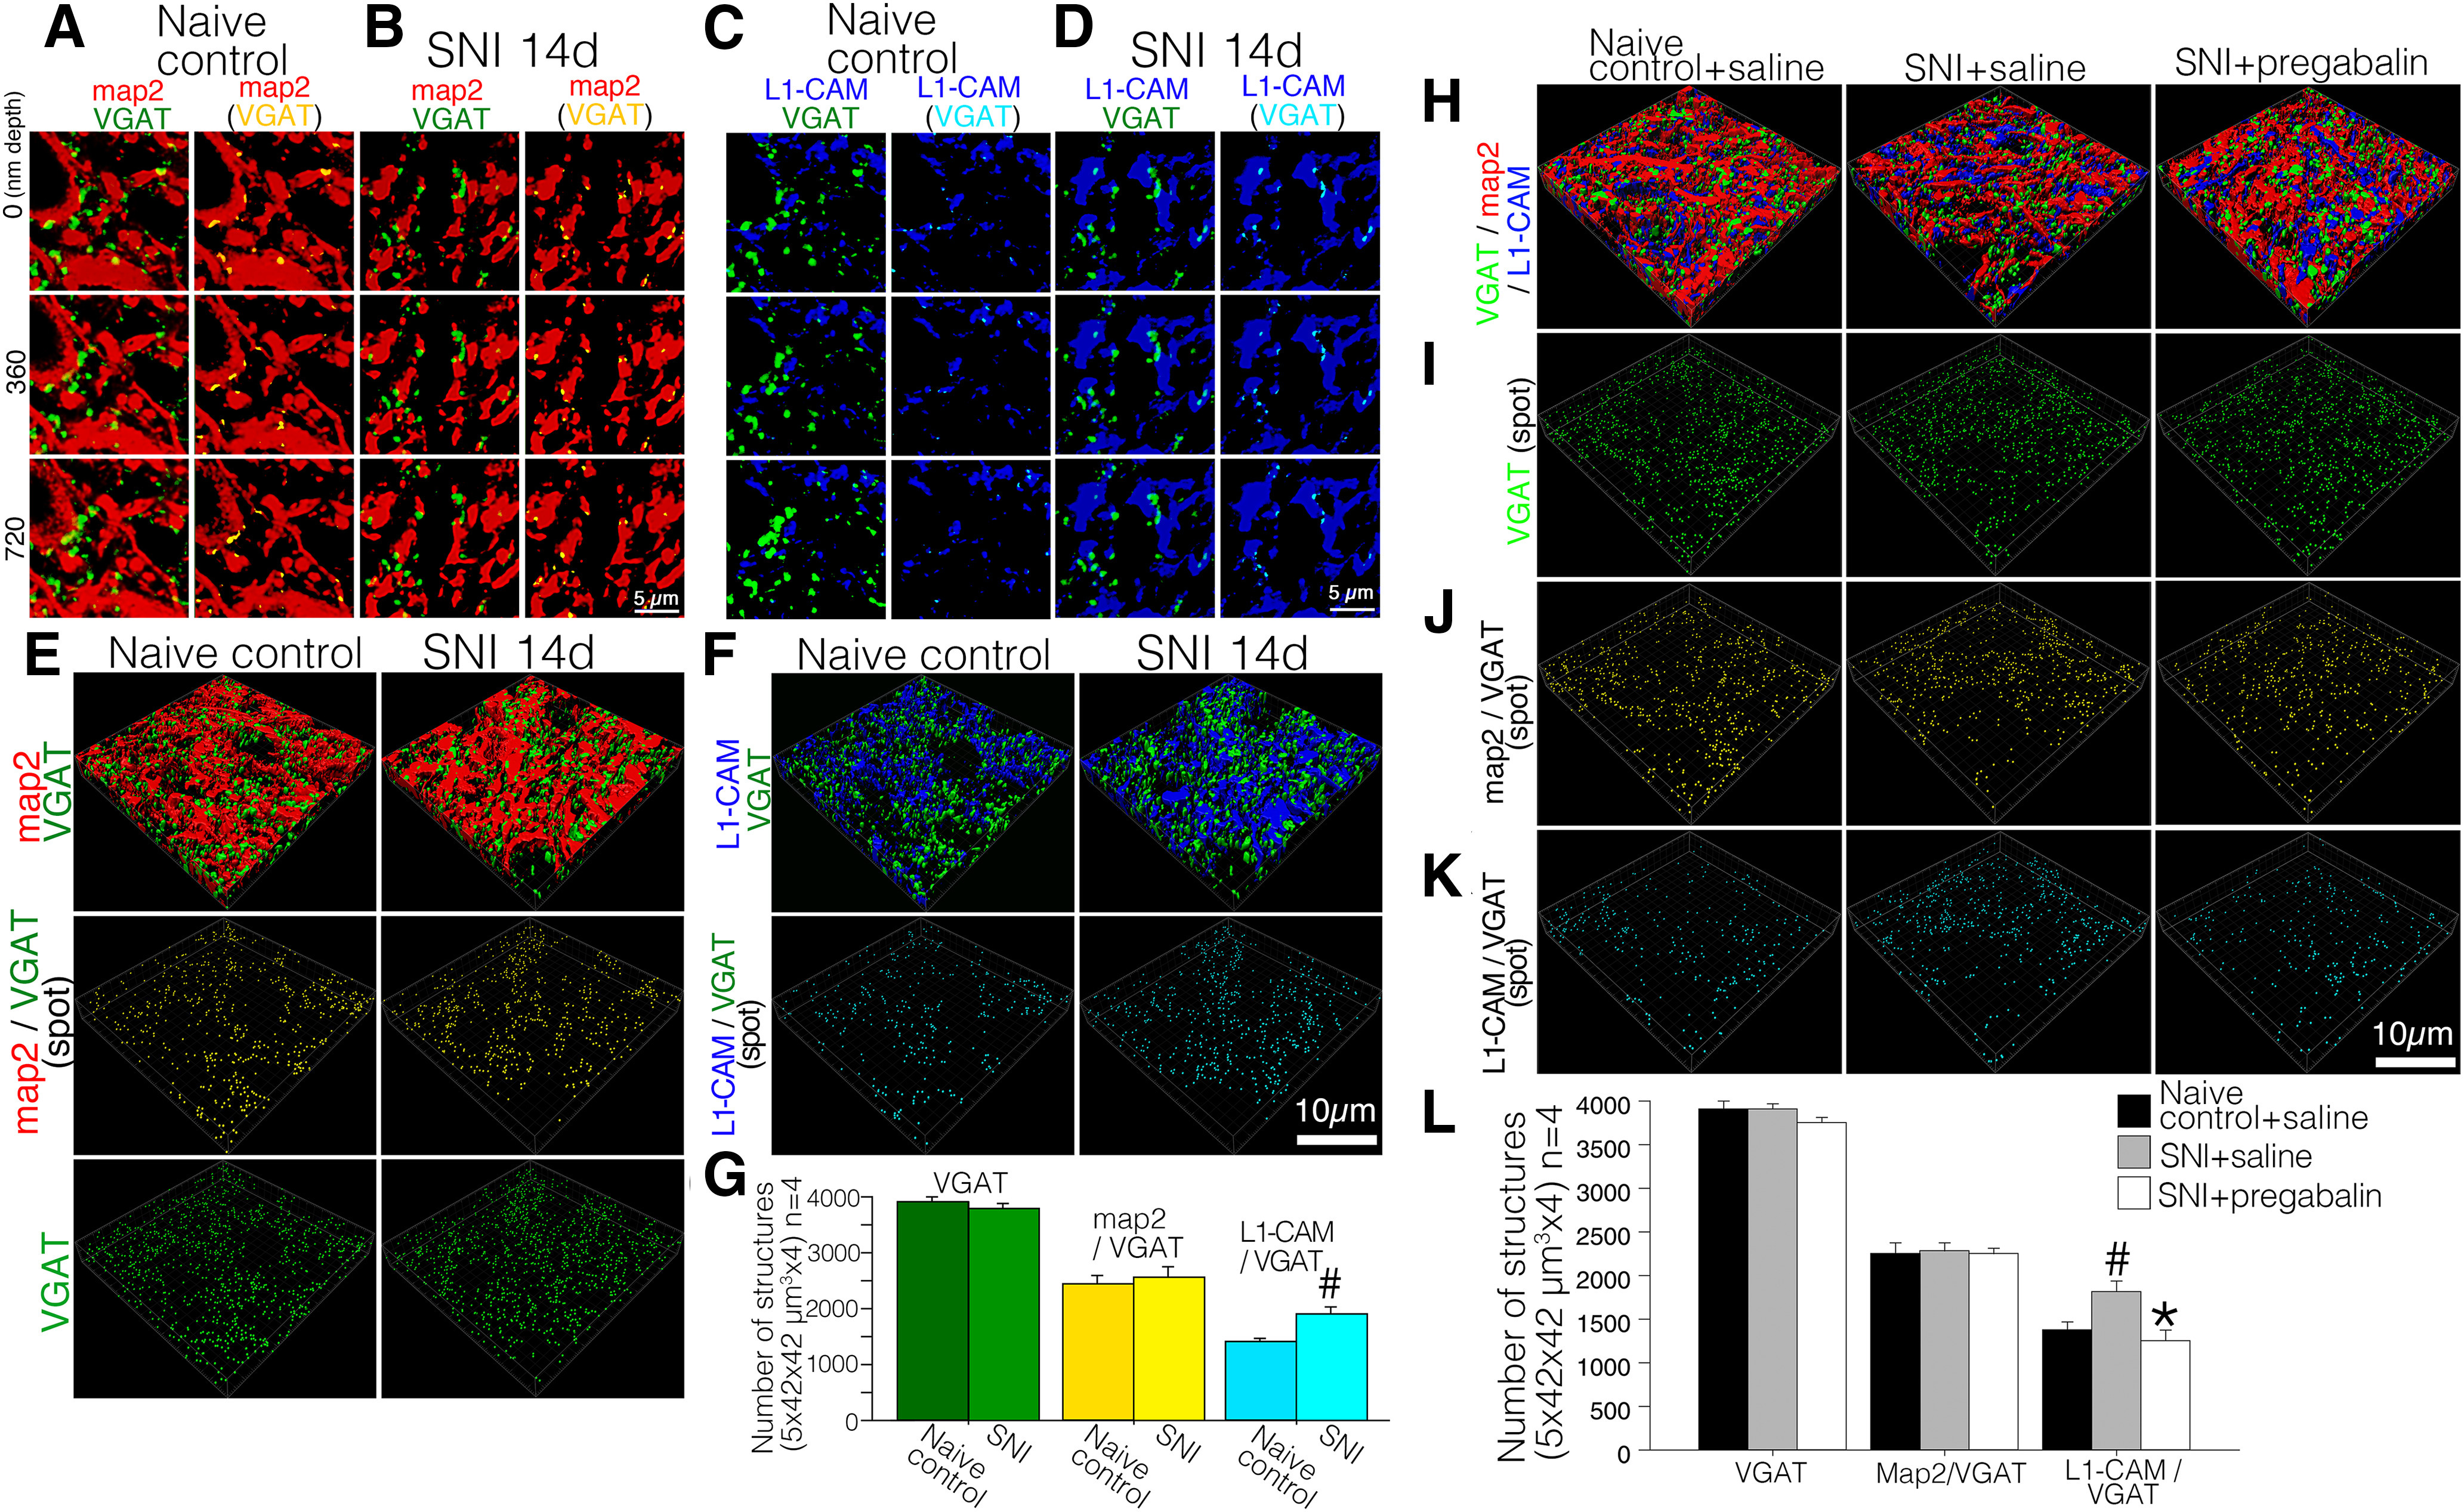
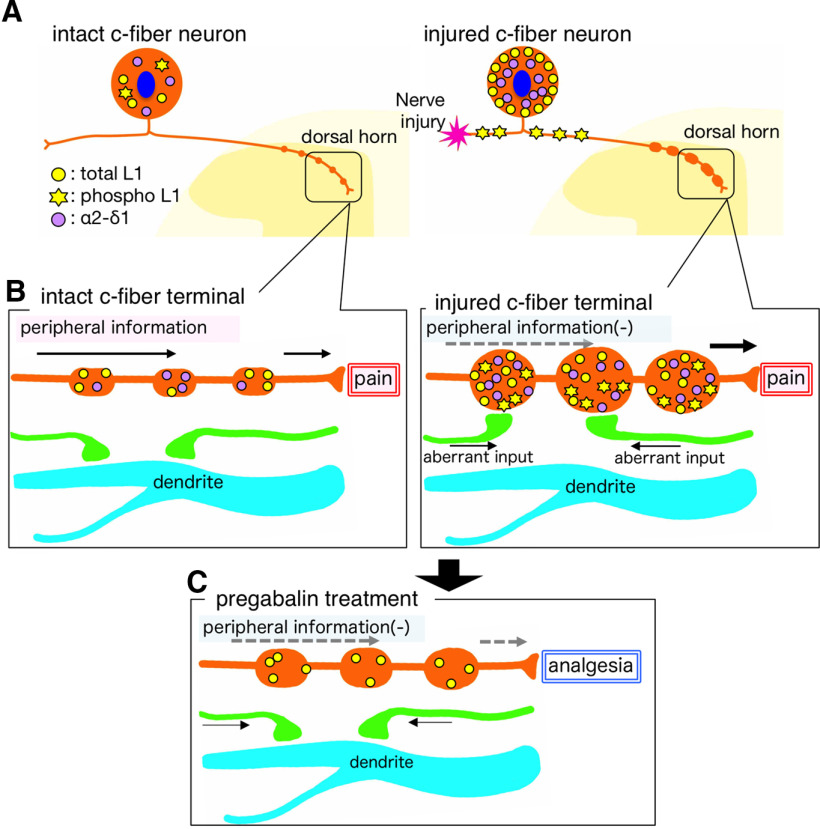
In the dorsal horn of the spinal cord, peripheral nerve injury induces structural and neurochemical alterations through which aberrant synaptic signals contribute to the formation of neuropathic pain. However, the role of injured primary afferent terminals in such plastic changes remain unclear. In this study, we investigated the effect of nerve injury on the morphology of cell adhesion molecule L1-CAM [total L1-CAM (tL1-CAM)]-positive primary afferent terminals and on the synaptic contact pattern in the dorsal horn. In the confocal images, the tL1-CAM-positive terminals showed morphologic changes leading to the formation of hypertrophic varicosities in the c-fiber terminal. These hypertrophic varicosities in the dorsal horn were co-labeled with phosphorylated (Ser1181) L1-CAM (pL1-CAM) and shown to store neurotransmitter peptides, but not when co-labeled with the presynaptic marker, synaptophysin. Quantitative analyses based on 3D-reconstructed confocal images revealed that peripheral nerve injury reduced dendritic synaptic contacts but promoted aberrant axo-axonic contacts on the tL1-CAM-positive hypertrophic varicosities. These tL1-CAM-positive varicosities co-expressed the injury-induced α2δ-1 subunit of the calcium channel in the dorsal horn. Administration of the anti-allodynic drug, pregabalin, inhibited accumulation of α2δ-1 and pL1-CAM associated with a reduction in hypertrophic changes of tL1-CAM-positive varicosities, and normalized injury-induced alterations in synaptic contacts in the dorsal horn. Our findings highlight the formation of aberrant spinal circuits that mediate the convergence of local neuronal signals onto injured c-fibers, suggesting that these hypertrophic varicosities may be important contributors to the pathologic mechanisms underlying neuropathic pain.

Keywords: axon terminal; cell adhesion; dorsal horn circuit; growth cone like structure; neuropathic pain; synaptic plasticity.


Figures

Figure 1.
Figure 1.
Effect of peripheral nerve injury on the expression of tL1-CAM and pL1-CAM. A, B, Western blotting (WB) analysis of tL1-CAM (A) and pL1-CAM (B) protein using the total protein extracted from the L4/5 DRG taken at 0 and 14 d after surgery. Graphs show the protein levels of tL1-CAM and pL1-CAM expressed as percentages of the protein level in the normal control (mean ± SEM; each time point n = 4). C, Double fluorescence images of tL1-CAM (green) and NF-200 (blue) in the DRG of control animals (left) and 7 d after nerve injury (right). D, Quantification of ring-like tL1-CAM-ir-positive neurons in DRG following nerve injury (n = 4, each time point). E, Immunofluorescence images of pL1-CAM in the DRG (upper panel) and dorsal root (lower panel) of control animals (left) and 7 d after nerve injury (right). F, Quantification of pL1-CAM-ir-neurons in the DRG following nerve injury (n = 4, each time point). G, Double-labeled images of tL1-CAM (red) and pL1-CAM (green) in the L5 DRG of control naive (upper panels) and SNI models (lower panels). Scale bars: 50 μm (C), 100 μm (E, upper panels), 50 μm (E, lower panels), and 50 μm (G). A, B, #p <0.05 (Student’s t test) compared with naive control (day 0). D, F, #p < 0.05 versus control (ANOVA).
Figure 2.
Figure 2.
Expression of tL1-CAM and pL1-CAM in the dorsal horn of the spinal cord. A–C, IHC of tL1-CAM. A, Low-magnification image of the SNI model, 14 d after injury. B, C, tL1-CAM-ir in Laminae I–II of naive control animals (B) and 14 d after injury in SNI model animals (C). Insets, High-magnification images in B, C. D, Quantification of tL1-CAM-ir in the dorsal horn of SNI model rats (n = 4 each time points). E–G, IHC of pL1-CAM. E, Low-magnification images of SNI model animals, 14 d after injury. F, G, pL1-CAM-ir in Laminae I–II of control animals (F) and 14 d after injury in SNI model animals (G). Insets, Magnified images of F, G. H, Quantification of pL1-CAM-ir in the dorsal horn of SNI model rats. I, J, High-magnification confocal double-labeled images of L1-CAM-ir/pL1-CAM in the dorsal horn of control animals (I) and SNI model animals (J). Scale bars: 500 μm (A, E), 50 μm (B, C, F, G), 20 μm (B, C, F, G, insets), and 10 μm (I, J); #p < 0.05 versus naive control animal.
Figure 3.
Figure 3.
A, B, Triple-labeled images of IB-4 (blue), tL1-CAM (red), and pL1-CAM (green) in the L4/5 dorsal horn of SNI model rats, 14 d after injury. C–F, Quantification of tL1-CAM-ir profiles in the dorsal horn of the control (IB-4-positive area) and SNI models (IB-4-negative area). C, Binary images of tL1-CAM-ir in the dorsal horn of the control (left) and SNI models (right). Arrows indicate the area of each immunoreactive profile. D, Representative scatter plotting results of tL1-CAM-ir profiles of the control (left) and SNI models (right). Each dot represents a tL1-CAM-ir profile; y-axis represents the immunoreactive area. E, F, Quantification of tL1-CAM-ir profile numbers (E) and area (F). E, Average number of tL1-CAM-ir in the dorsal horn (4984 μm2 per animal, n = 4 total; 2049 and 1979 ir profiles from the control naive and SNI models, respectively). F, Average size of the total tL1-CAM-ir (E) and top 100 large-sized tL1-CAM-ir varicosities in the dorsal horn of the control and SNI models, 14 d after injury. Scale bars: 100 μm (A, B, low-magnification images) and 10 μm (AC, high-magnification images). NS indicates not significant versus control, #p,0.05 versus control.
Figure 4.
Figure 4.
Characterization of tL1-CAM-positive varicosities (n = 4, SNI model 14 d). Double-labeling analysis of tL1-CAM-ir with NF-200 (A), GAP-43 (B), galanin (C), and CGRP (D, E) in the dorsal horn ipsilateral (A–D) and contralateral (E) to the injury. Upper three rows, Staining pattern of the maker proteins and tL1-CAM in the dorsal horn. Panels in the three lowest rows, High-magnification confocal images of marker protein, tL1-CAM, and their merged images, respectively. Scale bars: 100 μm (upper three rows) and 10 μm (lower three rows).
Figure 5.
Figure 5.
Triple-labeled images of synaptophysin-ir (green), MAP-2-ir (red), and tL1-CAM-ir (blue) in the dorsal horn of control naive and SNI model rats (n = 4 each model). A, B, Confocal scanned merged images of synaptophysin/MAP-2 (A) and merged images of synaptophysin/tL1-CAM in the dorsal horn of control and SNI model animals. Arrows indicate contacts of synaptophysin-ir with MAP-2-ir or with tL1-CAM-ir in the same focal plane. C–F, Representative captured images of deconvoluted z-scanned slices of triple-labeled images. C, D, Merged images of synaptophysin-ir (green) and MAP-2-ir (red) in the dorsal horn of control naive (A) and SNI model rats (B). E, F, Merged images of synaptophysin-ir (green) and tL1-CAM-ir (blue) in the dorsal horn of control naive (E) and SNI model rats (F). C–F, right columns, Single-labeled synaptophysin-ir are removed and the contact spots of synaptophysin-ir with MAP-2-ir or with tL1-CAM-ir are represented as yellow or light blue, respectively. The depths of z-axial scanning steps are indicated on the left. Scale bars: 5 μm.
Figure 6.
Figure 6.
Reconstructed 3D images of deconvoluted z-scanned confocal images of immunoreactive structures for synaptophysin (green), MAP-2 (red), and tL1-CAM (blue) in the dorsal horn of control and SNI model rats. A, 3D images of synaptic terminals and dendrites (synaptophysin-ir and MAP-2-ir). Synaptophysin and MAP-2 contacts are represented as yellow spots on MAP-2-ir in the middle panels. The contacts in this space are represented as yellow particles in the panels in the lowest row. B, 3D images of synaptic terminals (synaptophysin-ir) and tL1-CAM-positive structures. Synaptophysin-ir and tL1-CAM-ir contacts are shown in light blue in tL1-CAM-ir, and these contacts are represented as particles in the lowest panels. C, Spots of synaptic terminals (synaptophysin-ir) in the dorsal horn of SNI and control rats are represented as green particles. D, Quantification of the total number of contact spots (synaptophysin/MAP-2, synaptophysin/tL1-CAM) and synaptophysin-ir structures in the dorsal horn (1764.0 μm2 × 5.0 μm in scope × depth, four positions per animal, each model n = 4); #p < 0.05 versus control. Scale bar: 10 μm.
Figure 7.
Figure 7.
Effect of peripheral nerve injury on the expression α2δ−1. A, Representative pattern of RT-PCR showing the expression of α2δ−1 mRNA in the DRG of SNI model rats. The graph shows the quantification of the amplified bands intensities in the time course after nerve injury (n = 6 at each time point). B, C, Expression of the α2δ−1 mRNA (B) and protein (C) in DRG sections of control naive animals and 7 d after nerve injury. B, insets, Bright field images of ISH sections. Sections were counter-stained with hematoxylin and eosin. D, Double fluorescence images of α2δ−1 (red) and tL1-CAM-ir (green) in the DRG of control naive model rats (upper panels) and SNI (7 d after injury) model rats (lower panels). E, Quantification of co-localization ratio of α2δ−1 and ring-like tL1-CAM-ir-positive neurons in L4/5 DRG neuron of SNI (7 d after injury) model rats (n = 4, total 901 neurons). F–H, Expression of α2δ−1 in the dorsal horn of spinal cord. F, Low-magnification images of SNI model animals (14 d after injury). G, H, α2δ−1-ir in Laminae I–II of control animals (G) and 14 d after injury in SNI model animals (H). Insets, Magnified images of G, H. I, Quantification of α2δ−1-ir in the dorsal horn of SNI model rats. J, K, High-magnification confocal double-labeled images of α2δ−1 (red) and tL1-CAM-ir (green) in the dorsal horn of control animals (J) and SNI model animals (K). Scale bars: 250 μm (B, dark field images), 25 μm (B, insets), 100 μm (C), 50 μm (D), 500 μm (F), 50 μm (G, H), 20 μm (G, H, insets), and 10 μm (J, K); #p < 0.05 versus control (0 d).
Figure 8.
Figure 8.
Effects of pregabalin on the expression of α2δ−1-ir, tL1-CAM-ir, and pL1-CAM-ir in the dorsal horn of SNI model rats. A–C, Representative staining patterns of α2δ−1-ir in the dorsal horn of SNI model rats (10 d after injury) treated with saline (A) and pregabalin (B, C). The doses of chronic intrathecal injection of pregabalin are shown in B (30 μg/d) and C (300 μg/d). A–C, bottom rows, High-magnification images showing the reduction in α2δ−1-ir by intrathecal injection of pregabalin. D, Quantification of α2δ−1-ir in the dorsal horn of SNI model rats treated with intrathecal pregabalin. E–G, Representative images showing the expression of tL1-CAM-ir in the dorsal horn of SNI model rats, 10 d after treatment with saline (E) and pregabalin (F, G). The doses of chronic intrathecal injection of pregabalin are shown in F (30 μg/d) and G (300 μg/d). E–G, bottom rows, High-magnification tL1-CAM-ir images of the dorsal horn of animals treated with intrathecal injection of pregabalin. Note that pregabalin treatment reduced the size of tL1-CAM-positive varicosities. H, Quantification of tL1-CAM-ir in the dorsal horn of SNI model rats treated with intrathecal pregabalin. I–L, Pregabalin treatment reduced the expression of pL1-CAM-ir in dorsal horn. I–K, Low-magnification images of pL1-CAM-ir in the rats treated by saline (I) and pregabalin (J, K). I–K, bottom rows, High-magnification pL1-CAM-ir images of the upper panels. The doses of chronic intrathecal injection of pregabalin are shown in J, K. L, Quantification of pL1-CAM-ir in the dorsal horn of SNI model rats treated with intrathecal pregabalin. Scale bars: 100 μm (A–C, E–G, I–K, upper row) and 25 μm (A–C, E–G, I–K, lower row); #p < 0.05 versus saline control.
Figure 9.
Figure 9.
Effect of pregabalin on the synaptic reorganization in the dorsal horn of SNI model rats, 10 d after injury. The animal model and treatments are listed on the top row of each column. A, Reconstructed 3D images of deconvoluted z-scanned confocal images of immunoreactive structures for synaptophysin (green), MAP-2 (red), and tL1-CAM (blue). B, Synaptophysin-ir is represented as green particles. C, Single-labeled structures with synaptophysin-ir and tL1-CAM-ir were removed. The contacts between synaptophysin (synaptic terminal) and MAP-2 (dendrite) are shown in yellow. D, The yellow spots in C are represented as particles. E, Single-labeled structures with synaptophysin-ir and MAP-2-ir are removed. The contacts between synaptophysin and tL1-CAM are shown as light blue spots in tL1-CAM-positive regions. F, The light blue spots in E are represented as particles. G, Quantitative analysis of the number of synaptic terminals (synaptophysin), synaptic contacts on dendrites (synaptophysin/MAP-2), and axo-axonic contacts on tL1-CAM-ir (synaptophysin/tL1-CAM) in the dorsal horn of control and SNI model rats treated with saline or pregabalin. Scale bar: 10 μm; #p < 0.05 versus control saline group; *p < 0.05 versus SNI + saline group.
Figure 10.
Figure 10.
Effect of nerve injury on the inhibitory synaptic organization in the Laminae I–II of the dorsal horn of SNI model rats. A–D, Representative captured images of deconvoluted z-scanned slices of double-labeled VGAT-ir (green) with MAP-2-ir (red; A, B) or with L1-CAM-ir (blue; C, D) in the dorsal horn of control naive (A, C) and SNI model rats (B, D). A–D, right columns, Single-labeled VGAT-ir spots were removed and the contact spots of VGAT-ir with MAP-2-ir or with L1-CAM-ir are represented as yellow or light blue spots, respectively. The depths of the z-axial scanning steps are indicated in left. E, F, Reconstructed 3D images of deconvoluted z-axial scanned confocal images of immunoreactive structures for VGAT (green), MAP-2 (red), and L1-CAM (blue) in the dorsal horn of control naive and SNI model rats. E, 3D images of inhibitory synaptic terminals and dendrites in control and SNI model rats (VGAT-ir and MAP-2-ir). VGAT and MAP-2 contacts are represented as yellow particles in the panel of the middle row. Inhibitory synaptic terminals (VGAT-ir) in the dorsal horn are represented as green particles (E, bottom row). F, 3D images of inhibitory synaptic terminals (VGAT-ir) and L1-CAM-positive structures of control and SNI model rats (F, upper panels). VGAT-ir and L1-CAM-ir contacts are shown as light blue particles in the bottom panels. G, Quantification of the total number of contact spots (VGAT/MAP-2, VGAT/L1-CAM) and VGAT-ir structures in the dorsal horn (1764.0 μm2 × 5.0 μm in scope × depth, four positions per animal, n = 4); #p < 0.05 versus control. H–L, Effect of pregabalin on the inhibitory synaptic reorganization in the dorsal horn of SNI model rats (10 d after injury). The animal model and treatments are listed on the top row of each column. H, Reconstructed 3D images of deconvoluted z-axial scanned confocal images of immunoreactive structures for VGAT (green), MAP-2 (red), and L1-CAM (blue). I, VGAT-ir are represented as green particles. J, The contacts between VGAT and dendrites are represented as yellow particles. K, The contacts between VGAT and L1-CAM are represented as light blue particles. L, Quantitative analysis of the number of inhibitory synaptic terminals (VGAT), inhibitory synaptic contacts on dendrites (VGAT/MAP-2) and inhibitory axo-axonic contacts on L1-CAM-ir (VGAT/L1-CAM) in the dorsal horn of control and SNI model rats treated with saline or pregabalin. Scale bar: 5 μm (A–D) and 10 μm (E–J); #p < 0.05 versus control group; *p < 0.05 versus SNI+saline group.
Figure 11.
Figure 11.
Schematic illustration of the concept of synaptic reorganization and the pharmacological effect of pregabalin on the injured primary afferent in the dorsal horn of neuropathic pain model animals. A, Peripheral nerve injury induced the following events in the DRG: (1) translocation of tL1-CAM in injured c-fiber neurons; (2) decrease of pL1-CAM in neuronal soma but an increase in the nerve fiber; and (3) increase of α2δ−1 expression in injured c-fiber neurons. B, Peripheral nerve injury-induced morphologic plasticity and expression of L1-CAM, pL1-CAM, and α2δ−1 in the dorsal horn. Peripheral nerve injury induced the following: (1) hypertrophy of L1-CAM-positive terminal varicosities; (2) accumulation of pL1-CAM/α2δ−1 in the hypertrophic varicosities; and (3) increase of axo-axonic contacts on the injured c-fibers but decreased axo-dendritic contacts on the dorsal horn neurons. C, Effect of pregabalin on the nerve injury-induced plastic changes in the dorsal horn of neuropathic pain model animals. Pregabalin treatment: (1) reduced the size of L1-CAM-positive hypertrophic varicosities; (2) suppressed pL1-CAM and α2δ−1 accumulation in the L1-CAM-ir varicosities; and (3) normalized the injury-induced synaptic alterations in axo-axonic and axo-dendritic contacts in the dorsal horn.

Similar articles

Cited by

References

    1. Akopians A, Runyan SA, Phelps PE (2003) Expression of L1 decreases during postnatal development of rat spinal cord. J Comp Neurol 467:375–388. 10.1002/cne.10956 - DOI - PubMed
    1. Averill S, Davis DR, Shortland PJ, Priestley JV, Hunt SP (2002) Dynamic pattern of reg-2 expression in rat sensory neurons after peripheral nerve injury. J Neurosci 22:7493–7501. - PMC - PubMed
    1. Bauer CS, Nieto-Rostro M, Rahman W, Tran-Van-Minh A, Ferron L, Douglas L, Kadurin I, Sri Ranjan Y, Fernandez-Alacid L, Millar NS, Dickenson AH, Lujan R, Dolphin AC (2009) The increased trafficking of the calcium channel subunit alpha2delta-1 to presynaptic terminals in neuropathic pain is inhibited by the alpha2delta ligand pregabalin. J Neurosci 29:4076–4088. 10.1523/JNEUROSCI.0356-09.2009 - DOI - PMC - PubMed
    1. Burden-Gulley SM, Pendergast M, Lemmon V (1997) The role of cell adhesion molecule L1 in axonal extension, growth cone motility, and signal transduction. Cell Tissue Res 290:415–422. 10.1007/s004410050948 - DOI - PubMed
    1. Cantí C, Nieto-Rostro M, Foucault I, Heblich F, Wratten J, Richards MW, Hendrich J, Douglas L, Page KM, Davies A, Dolphin AC (2005) The metal-ion-dependent adhesion site in the Von Willebrand factor-A domain of alpha2delta subunits is key to trafficking voltage-gated Ca2+ channels. Proc Natl Acad Sci USA 102:11230–11235. 10.1073/pnas.0504183102 - DOI - PMC - PubMed

Substances

LinkOut - more resources