. 2021 May;19(5):784-798.
doi: 10.1158/1541-7786.MCR-20-0532. Epub 2021 Jan 26.

Functional Hierarchy and Cooperation of EMT Master Transcription Factors in Breast Cancer Metastasis

Affiliations

Functional Hierarchy and Cooperation of EMT Master Transcription Factors in Breast Cancer Metastasis

Joseph B Addison et al. Mol Cancer Res. 2021 May.

Abstract

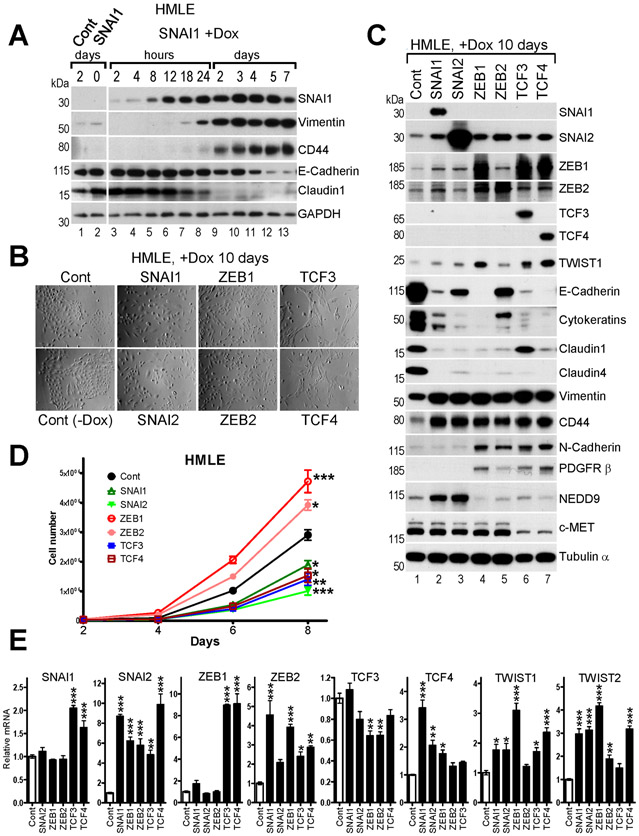
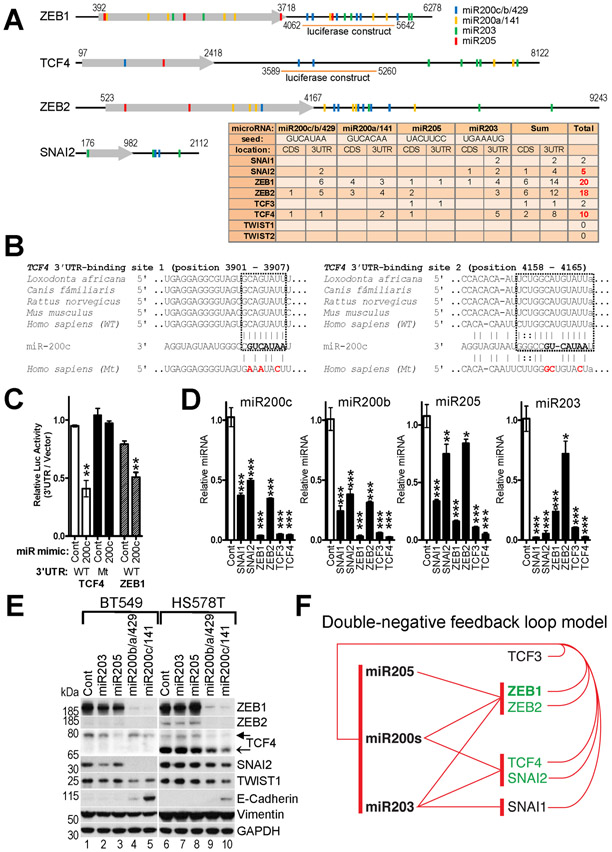
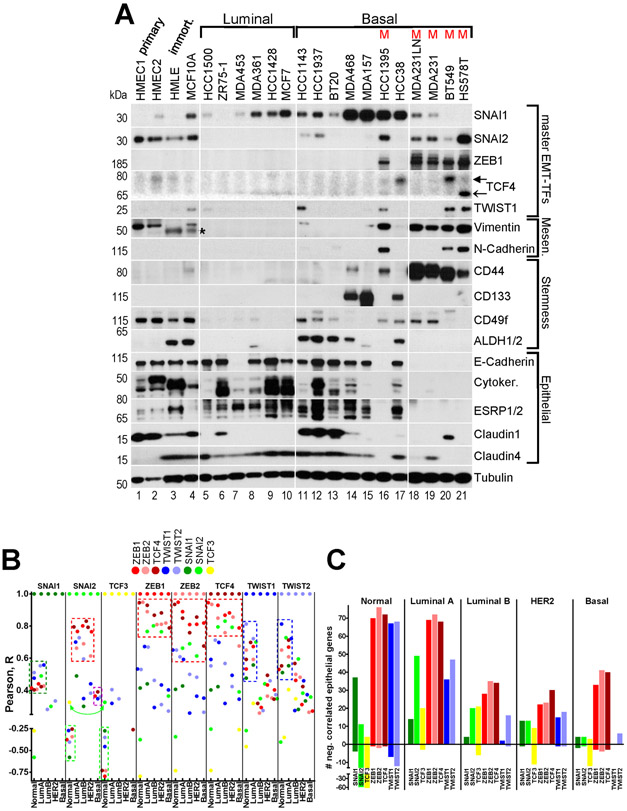
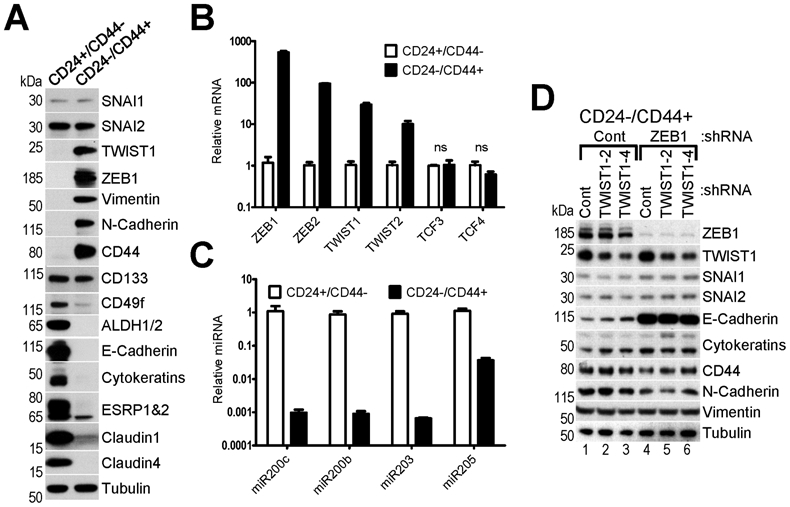
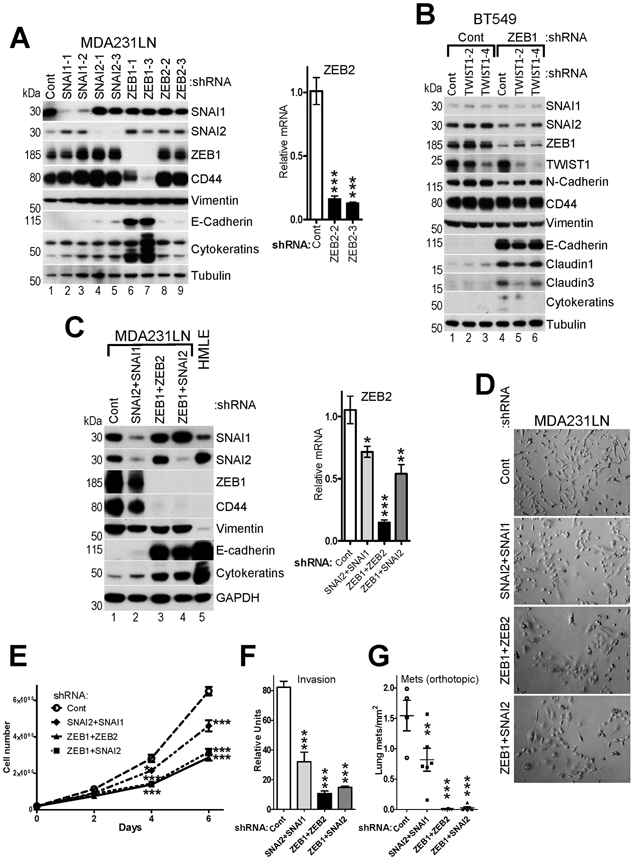
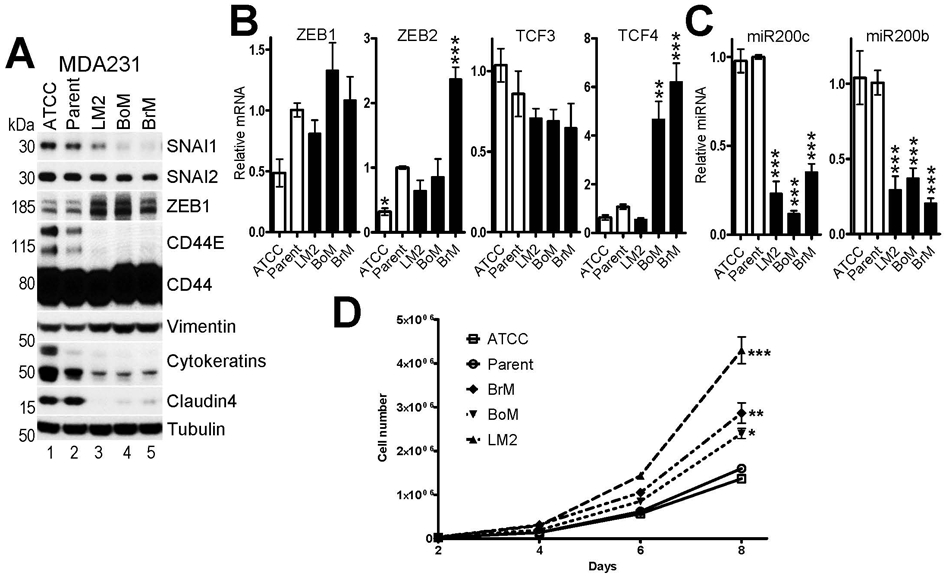
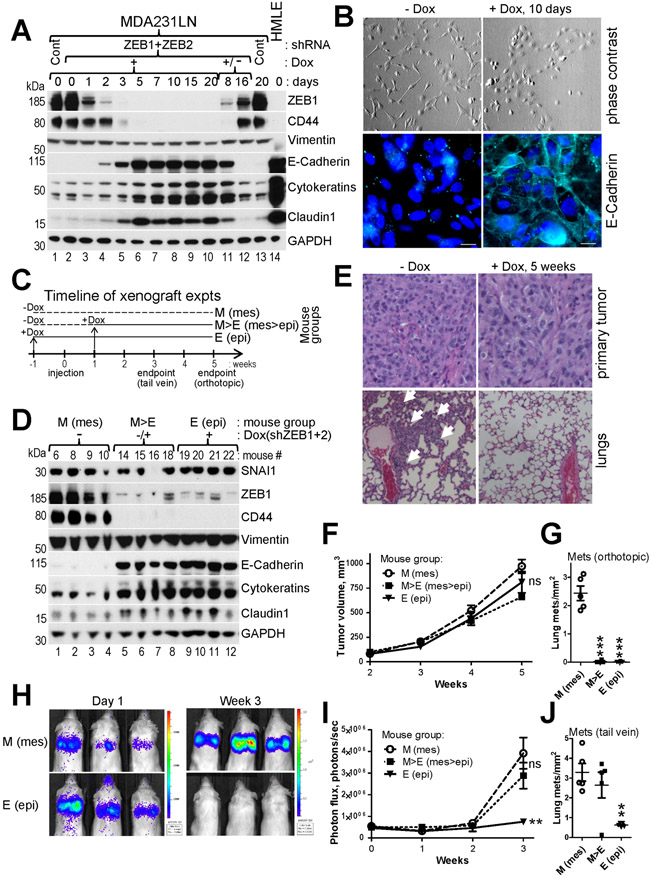
Several master transcription factors (TF) can activate the epithelial-to-mesenchymal transition (EMT). However, their individual and combinatorial contributions to EMT in breast cancer are not defined. We show that overexpression of EMT-TFs individually in epithelial cells upregulated endogenous SNAI2, ZEB1/2, TCF4, and TWIST1/2 as a result of positive feedback mediated in part by suppression of their negative regulator miRNAs miR200s/203/205. We identified TCF4 as a potential new target of miR200s. Expression of ZEB1/2 strongly correlated with the mesenchymal phenotype in breast cancer cells, with the CD24-/CD44+ stemness profile, and with lower expression of core epithelial genes in human breast tumors. Knockdown of EMT-TFs identified the key role of ZEB1 and its functional cooperation with other EMT-TFs in the maintenance of the mesenchymal state. Inducible ZEB1+2 knockdown in xenograft models inhibited pulmonary metastasis, emphasizing their critical role in dissemination from primary site and in extravasation. However, ZEB1+2 depletion one-week after intravenous injection did not inhibit lung colonization, suggesting that ZEB1/2 and EMT are not essential for macrometastatic outgrowth. These results provide strong evidence that EMT is orchestrated by coordinated expression of several EMT-TFs and establish ZEB1 as a key master regulator of EMT and metastasis in breast cancer. IMPLICATIONS: The EMT program is orchestrated by coordinated expression of multiple EMT transcription factors, whereas ZEB1 integrates the EMT master regulatory network and plays the major role in promoting EMT and metastasis.


Conflict of interest statement

Competing interests: The authors declare no potential conflicts of interest.

Figures

Fig.1.
Fig.1.. Overexpression of exogenous EMT-TFs induces EMT and secondary upregulation of endogenous EMT-TFs in HMLE cells.
HMLE cells were infected with pLUT-EMT-TF lentiviruses and selected with zeocin to establish stable Dox-inducible cell lines. A, WB analysis of EMT markers in HMLE-LUT-SNAI1 cells during time-course induction of SNAI1. Dox was added to culture media and cells were lysed at the indicated time points. B, Phase contrast images, C, WB analysis, and D, cell proliferation assay of the indicated HMLE-LUT-EMT-TFs cell lines. E, Relative mRNA levels of the EMT-TFs shown at the top in the indicated HMLE cell lines shown at the X-axis determined by RT-qPCR. The mean values of the EMT-TFs expression in control HMLE cells were set to 1. The data are mean ± SEM of three biological replicates. D,E, ANOVA with Dunnett’s post-test, * - p<0.05, ** - p<0.01, *** - p<0.001.
Fig.2.
Fig.2.. Reciprocal repression of EMT-TFs and miR200s/203/205 microRNAs.
A, Schematic map of ZEB1/2, TCF4 and SNAI2 transcripts and color-coded location of the microRNA sites. 3’UTR regions of ZEB1 and TCF4 used in luciferase reporter assay in (C) are shown below. (Table) Number of occurrences of predicted and validated sites complementary to seeds of the indicated microRNAs in coding sequences (CDS) and 3’UTRs of the EMT-TFs. B, Conservation of two sites and predicted duplex formation of TCF4 3’UTR from five different species and mature miR200c microRNA. The miR200c 7-nt seed sequence is shown in bold. Nucleotide substitutions of the mutant (Mt) TCF4 3’UTR construct used in (C) are shown in red. C, Repression of the TCF4 and ZEB1 luciferase-3’UTR reporters by miR200c. MDA231 cells were co-transfected with the indicated wild type (WT) or mutant (Mt) constructs and control or miR200c mimics. D, Ectopic EMT-TFs repress endogenous epithelial-specific microRNAs in HMLE cells. Relative levels of four microRNAs in the indicated HMLE-LUT-EMT-TFs cell lines described in Fig.1 determined by RT-qPCR. The mean values of the microRNAs expression in control HMLE cells were set to 1. C,D, The data are mean ± SEM of three replicate transfections or three biological replicates, respectively. ANOVA with Dunnett’s post-test, * - p<0.05, ** - p<0.01, *** - p<0.001. E, Ectopic epithelial-specific microRNAs repress endogenous EMT-TFs in BT549 and HS578T cells. Cells were infected with pLUT lentiviruses encoding indicated microRNAs. WB analysis of EMT-TFs and select EMT markers. Filled arrow ~78kDa TCF4 isoform, open arrow ~68kDa TCF4 isoform. F, Double negative feedback loop model. Red T-ending lines indicate repression by the EMT-TFs of the respective microRNAs and vice versa.
Fig.3.
Fig.3.. ZEB1/2 and TCF4 strongly correlate with the mesenchymal phenotype in breast cancer cell lines, and with EMT markers in human primary breast tumors.
A, WB analysis of EMT-TFs, EMT and stemness markers in primary HMECs and in the indicated immortalized and breast cancer cell lines of luminal (L), basal (B) and mesenchymal (M) groups. Filled arrow ~78kDa TCF4 isoform, open arrow ~68kDa TCF4 isoform. Tubulin – loading control. * - non-specific band. B, Correlation of expression between each of the EMT-TFs in normal breast tissue and four breast cancer subtypes. Pearson’s R coefficient was computed between an EMT-TF indicated at the top of each column section and the other seven EMT-TFs for each of the five sample groups. R values were plotted as color-coded dots, where each color represents individual EMT-TF according to the legend. See description of dashed boxes in the main text. C, Number of negatively (above 0) and positively (below 0) correlated core epithelial genes with each EMT-TF in the five sample groups indicated at the top. Quantification of data presented in Suppl.Fig.6.
Fig.4.
Fig.4.. Normal mammary stem-like CD24−/CD44+ HMLE cells adopt mesenchymal phenotype and express high levels of ZEB1/2 and TWIST1/2.
A, WB analysis and B,C RT-qPCR analysis of EMT-TFs, EMT and stemness markers and epithelial-specific microRNAs in two FACS-purified subpopulations of HMLE cells (CD24+/CD44− and CD24−/CD44+). Tubulin – loading control for WB. (B,C) The mean values of expression in CD24+/CD44− cells were set to 1. The data are mean ± SEM of three biological replicates, ns – non-significant. D, Knockdown of ZEB1 but not TWIST1 in CD24−/CD44+ cells leads to partial MET. WB analysis of cells infected with lentiviruses encoding Control shRNA and two shRNAs against TWIST1, which were then reinfected with lentiviruses encoding Control and shRNA against ZEB1.
Fig.5.
Fig.5.. ZEB1 plays a major role in control of EMT in mesenchymal-like breast cancer cells.
A, Knockdowns of individual EMT-TFs in MDA231LN cells cause partial MET. WB (left panel) and RT-qPCR (right panel) analyses of MDA231LN cells infected with pGIPZ lentiviruses encoding Control and two different shRNAs against each SNAI1/2 and ZEB1/2. B, WB analysis of BT549 cells infected with pTRIPZ lentiviruses encoding Control shRNA and two different shRNAs against TWIST1, which were then reinfected with pTRIPZ lentiviruses encoding Control shRNA and shRNA against ZEB1. C, WB (left panel) and RT-qPCR (right panel) analyses of MDA231LN cells expressing Control, SNAI2-3 or ZEB1-3 shRNAs as shown in (A) reinfected with lentiviruses encoding Control shRNA or shRNA against SNAI1, ZEB2 or SNAI2, respectively. D, Phase contrast images, E, cell proliferation analysis, F, in vitro invasion assay of the indicated MDA231LN double knockdown cell lines described in (C). G, Cell lines described in (C) were injected into mammary fad pad of NSG mice, and the number of metastases was quantified in mouse lungs 5 weeks post-injection (n=4 for control and n=6 per other groups). The data are mean ± SEM of three biological replicates (A,C,E,F). ANOVA with Dunnett’s post-test, ** - p<0.01, *** - p<0.001.
Fig.6.
Fig.6.. Expression of ZEB1 correlates with increased metastatic potential of MDA231 cells.
A, WB and B,C RT-qPCR analyses of EMT-TFs, EMT markers and epithelial-specific microRNAs in two parental MDA231 sublines (ATCC and Parent, see main text) and three super-metastatic MDA231 sublines with increased metastatic potential to the lung (LM2), bone (BoM) and brain (BrM). The mean values of expression in Parent MDA231 cells were set to 1. D, cell proliferation assay of the indicated MDA231 sublines. The data are mean ± SEM of three biological replicates. ANOVA with Dunnett’s post-test, * - p<0.05, ** - p<0.01, *** - p<0.001.
Fig.7.
Fig.7.. Suppression of ZEB1+2 and EMT inhibits lung metastasis at multiple stages.
A, WB analysis of the indicated EMT markers in MDA231LN cells during time-course induction of Dox-regulated shRNAs against ZEB1+2. Cells were lysed at the indicate time points post Dox addition (lanes 1-10,13). Dox was washed out on day 20 and the cells were lysed 8 and 16 days post Dox withdrawal (lanes 11,12). B, Phase contrast images (top panel) and immunofluorescence for E-Cadherin pseudocolored cyan (bottom panel) of cells shown in (A). C, Timeline for mouse groups M, M>E and E used in xenograft experiments described in (D-J). D-J, MDA231LN/shZEB1+2 cells described in (A&B) were injected into mammary fad pad (D-G), or into tail vein (H-J) of NSG mice. D, WB analysis of the indicated EMT markers in primary tumors of four mice from each of the three groups at endpoint of the orthotopic injection experiment. E, H&E staining of primary tumors (top panel) and lungs (bottom panel) from (D). White arrows point to macrometastases. F-J, Dynamics of tumor growth (F and I) and the number of lung metastases at endpoints (G and J) for orthotopic and intravenous injection experiments, respectively (n=5 mice per group). H, Representative bioluminescent images for the tail vein injection. The data are mean ± SEM. ANOVA with Dunnett’s post-test, * - p<0.05, ** - p<0.01, *** - p<0.001, ns – non-significant.

References

    1. Thiery JP, Acloque H, Huang RY, Nieto MA. Epithelial-mesenchymal transitions in development and disease. Cell. 2009;139(5):871–90. - PubMed
    1. Mittal V Epithelial Mesenchymal Transition in Tumor Metastasis. Annu Rev Pathol. 2018;13:395–412. - PubMed
    1. Sobrado VR, Moreno-Bueno G, Cubillo E, Holt LJ, Nieto MA, Portillo F, et al. The class I bHLH factors E2-2A and E2-2B regulate EMT. Journal of cell science. 2009;122(Pt 7):1014–24. - PubMed
    1. de Herreros AG, Peiro S, Nassour M, Savagner P. Snail family regulation and epithelial mesenchymal transitions in breast cancer progression. Journal of mammary gland biology and neoplasia. 2010;15(2):135–47. - PMC - PubMed
    1. Stemmler MP, Eccles RL, Brabletz S, Brabletz T. Non-redundant functions of EMT transcription factors. Nature cell biology. 2019;21(1):102–12. - PubMed

Publication types

MeSH terms