. 2021 Jan 26;12(1):125.
doi: 10.1038/s41419-021-03422-3.

TROAP switches DYRK1 activity to drive hepatocellular carcinoma progression

Affiliations

TROAP switches DYRK1 activity to drive hepatocellular carcinoma progression

Lei Li et al. Cell Death Dis. .

Abstract

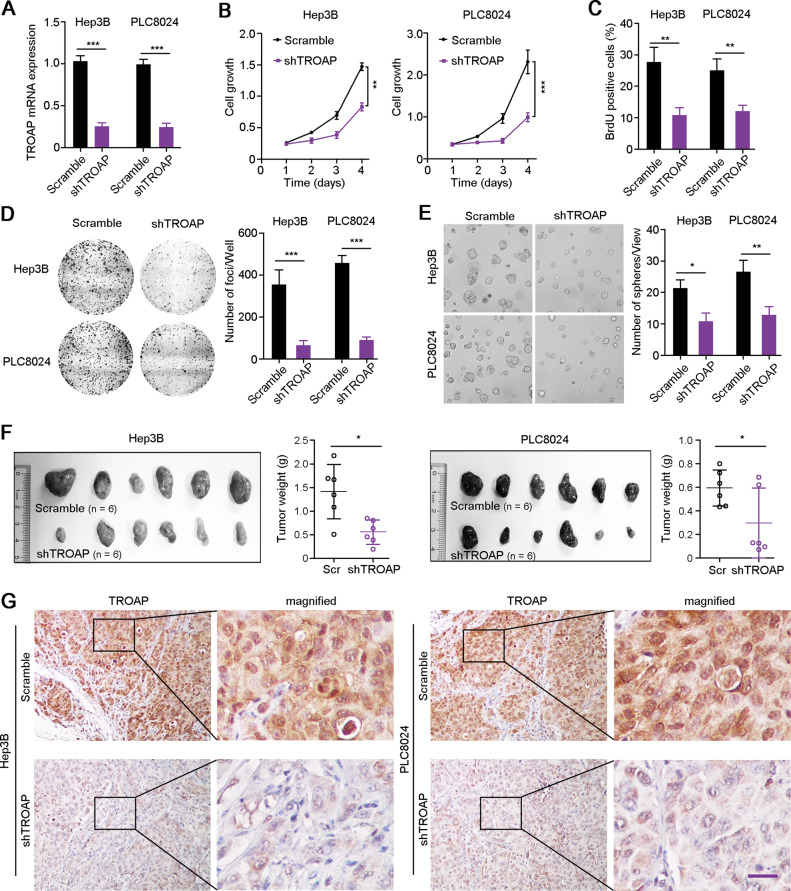
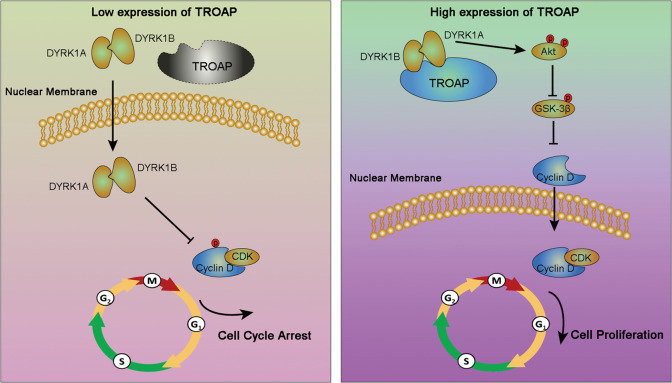
Hepatocellular carcinoma (HCC) is one of the common malignancy and lacks effective therapeutic targets. Here, we demonstrated that ectopic expression of trophinin-associated protein (TROAP) dramatically drove HCC cell growth assessed by foci formation in monolayer culture, colony formation in soft agar and orthotopic liver transplantation in nude mice. Inversely, silencing TROAP expression with short-hairpin RNA attenuated the malignant proliferation of HCC cells in vitro and in vivo. Next, mechanistic investigation revealed that TROAP directly bound to dual specificity tyrosine phosphorylation regulated kinase 1A/B (DYRK1A/B), resulting in the cytoplasmic retention of proteins DYRK1A/B and promoting cell cycle process via activation of Akt/GSK-3β signaling. Combination of cisplatin with an inhibitor of DYRK1 AZ191 effectively inhibited tumor growth in mouse model for HCC cells with high level of TROAP. Clinically, TROAP was significantly upregulated by miR-142-5p in HCC tissues, which predicted the poor survival of patients with HCC. Therefore, TROAP/DYRK1/Akt axis may be a promising therapeutic target and prognostic indicator for patients with HCC.


Conflict of interest statement

The authors declare that they have no conflict of interest.

Figures

Fig. 1
Fig. 1. TROAP enhances HCC cell growth by accelerating cell cycle process.
A The mRNA expression correlations between TROAP and cell proliferation-associated genes in HCC tissues were analyzed using TCGA database. IHC staining with antibodies against TROAP and Ki67 were performed in serial sections from two HCC patients with low or high expression of TROAP (B), or from orthotopic xenograft tumors derived from vector or TROAP-transfected HepG2 and Huh7 cells (C), respectively. Scale bar, 200 μm. In C, normal liver tissues were indicated by asterisks. D The cell cycle distributions of Hep3B and PLC8024 cells with or without TROAP silence were analyzed by flow cytometry. One way ANOVA; **P < 0.01. E Western blotting was used to analyze the expressions of cell cycle-associated proteins in HepG2 and Huh7 cells transfected with vector or TROAP, and in Hep3B and PLC8024 cells with or without TROAP knockdown. β-Tubulin was also tested as a loading control.
Fig. 2
Fig. 2. Overexpression of TROAP promotes HCC cell growth in vitro and in vivo.
A Gene Ontology (biological process) analysis of TROAP in human using Coexpedia internet tool (http://www.coexpedia.org/). B Overexpression of TROAP was confirmed with RT-qRCR assay in HepG2 and Huh7 cells after lentivirus-mediated transfection of TROAP. Cell growth curves (C), foci formation (D), and sphere formation (E) assays were used to investigate the activity of TROAP in HCC cells, respectively. F Orhtotopic liver transplantation of HCC cells after overexpression of TROAP in nude mice. Xenograft nodes were indicated by arrows. Tumor area was analyzed with ImageJ software and summarized in right panel. G IHC staining confirmed the high expression of TROAP in xenograft tumors derived from TROAP-overexpressed HCC cells. Asterisk, normal liver tissue; Scale bar, 50 μm. In panels BF, data are represented as mean ± SD; two-sided Student’s t-test; *P < 0.05; **P < 0.01; ***P < 0.001.
Fig. 3
Fig. 3. Downregulation of TROAP attenuates the malignant proliferation of HCC cells in vitro and in vivo.
A The downregulation of TROAP in Hep3B and PLC8024 cells after lentivirus-mediated silence of TROAP was confirmed by qRT-PCR. Cell growth (B), BrdU incorporation (C), foci formation (D), and sphere formation (E) assays were used to analyze HCC cell proliferation after knockdown of TROAP. Scramble vector was also transfected as a control. F Hep3B and PLC8024 cells transfected with shTROAP or scramble control were subcutaneously injected into nude mice. Three weeks after injection, tumor weights were measured. G IHC staining confirmed the knockdown of TROAP in xenograft tumors derived from TROAP-silenced HCC cells. Scale bar, 50 μm. In panels BF, data are indicated as mean ± SD; two-sided Student’s t-test; *P < 0.05; **P < 0.01; ***P < 0.001.
Fig. 4
Fig. 4. TROAP interacts with DYRK1A and DYRK1B promoting HCC cell growth.
A IntAct database (https://www.ebi.ac.uk/intact/) analysis showed TROAP interacting proteins that have been proved by different methods, such as yeast two-hybrid analysis (Y2H), tandem affinity purification (TAP), bimolecular fluorescence complementation (BiFC) and co-immunoprecipitation (Co-IP). B Immunofluorescent (IF) double-staining with antibodies against TROAP (red) and DYRK1A or DYRK1B (green) in Huh7 cells. Cell nuclei were stained with DAPI (blue). Scale bar, 10 μm. Representative co-localization signals indicated by white line were analyzed with ImageJ software. C The correlation of fluorescence values between TROAP and DYRK1A or DYRK1B were analyzed, respectively. D Co-IP analysis was performed to confirm the directly interaction of TROAP with DYRK1A or DYRK1B in Huh7 and PCL8024 cells. E IF staining with antibody against Ki67 (a marker of proliferative cell) in vector or TROAP-transfected Huh7 cells with or without DYRK1A/B silence. Scale bar, 100 μm. The percentages of Ki67 positive cells were summarized in right panel. F Foci formation analysis of vector or TROAP-transfected Huh7 cells under treatments with different concentration of DYRK1A/B inhibitor AZ191 (#S7338, Selleck). G The cell cycle distributions of Huh7 cells with or without TROAP overexpression or and AZ191 treatment (1 μM, 24 h) were analyzed by flow cytometry. In panels E, F data were indicated as mean ± SD; two-sided Student’s t-test; G One way ANOVA; *P < 0.05; **P < 0.01; ***P < 0.001; ns, no statistical significance.
Fig. 5
Fig. 5. TROAP-mediated the cytoplasmic localization of DYRK1A and DYRK1B activates Akt/GSK-3β signaling.
A IF double-staining with antibodies against TROAP (red) and DYRK1A or DYRK1B (green) in PLC8024 cells with or without TROAP silence. Cell nuclei were stained with DAPI (blue). Scale bar, 10 μm. Representative fluorescence signals in cytoplasm and nucleus indicated by white line were analyzed with ImageJ software and summarized in right panel. In right panel, data were indicated as mean ± SD; two-sided Student’s t-test; ***P < 0.001; ns, no statistical significance. B IHC staining with antibodies against DYRK1A and DYRK1B in xenograft tumors derived from vector or TROAP-transfected Huh7 cells. Scale bar, 50 μm. C The protein expressions of TROAP, DYRK1A, and DYRK1B in cytoplasm and nucleus in Huh7 cells transfected with vector or TROAP and PLC8024 cells with or without TROAP silence were analyzed with western blotting, respectively. GAPDH and Histone H3 were also severally tested as cytoplasmic and nuclear protein indicators. C, cytoplasm; N, nucleus. D The activation of Akt/GSK-3β signaling in HepG2 and Huh7 cells after transfection of vector (Vec) or TROAP (TRO) was analyzed by western blotting. E Western blot was used to analyze the activation of Akt/GSK-3β signaling in vector or TROAP-transfected Huh7 cells under treatments with DMSO or AZ191 (1 μM, 12 hours). In panels D and F, β-Tubulin was also tested as a loading control. Relative expressions of phosphorylated Akt and GSK-3β were analyzed with ImageJ software and summarized in right panel.
Fig. 6
Fig. 6. Combination of AZ191 and cisplatin suppresses HCC cell growth in nude mice.
A Hep3B and PLC8024 cells were subcutaneously injected into nude mice. One week after injection, mice were treated with DMSO or AZ191 (50 mg/kg, i.p.) for six times, and tumor weights were measured after sacrifice of mice. B IHC staining with antibody against Ki67 in xenograft tumors treated with or without AZ191. The percentage of Ki67 positive cells were summarized in right panel. C Subcutaneous xenograft tumors derived from Hep3B cells transfected with scramble RNA (Scr) or shRNA targeting TROAP (shT) were treated with DMSO, AZ191 or/and cisplatin (DDP, 6 mg/kg, i.p.). Tumor volumes were measured after six times treatments. D H&E staining of xenograft tumors after treatments. The proportion of dead cell area was analyzed with ImageJ software and summarized in the right panel. In all panels, data were indicated as mean ± SD; two-sided Student’s t-test; *P < 0.05; **P < 0.01; ***P < 0.001; ns, no statistical significance.
Fig. 7
Fig. 7. Upregulated TROAP predicts the poor outcome of HCC patients.
A Disease Ontology analysis of TROAP in human using Coexpedia internet tool (http://www.coexpedia.org/). B TROAP mRNA expression level in normal liver and HCC tissues was analyzed based on The Cancer Genome Atlas (TCGA) cohort. Two-sided Student’s t-test; ***P < 0.001. C IHC staining of TROAP in paired normal liver and HCC tissues. Scale bar, 200 μm. D Western blotting analysis of TROAP expression in one immortalized liver cell line MIHA and nine HCC cell lines. β-Tubulin was used a loading control. E Kaplan–Meier survival curves based on TCGA database suggested that both overall survival and disease-free survival of the HCC patients with high TROAP expression were significantly shorter than those with low level of TROAP (Log-Rank test). F In human, miR-142-5p potentially targets the 3’ untranslated Region (UTR) of TROAP. G The expression correlation of miR-142-5p and TROAP in 28 HCC cases was analyzed by quantitative real-time PCR (qRT-PCR). H TROAP mRNA expression in Hep3B and PLC8024 cells was tested by qRT-PCR after transfection of miR-142-5p mimics and negative control oligonucleotides. Data are represented as mean ± SEM; two-sided Student’s t-test; ***P < 0.001.
Fig. 8
Fig. 8. High expression of TROAP enhances HCC cell proliferation via DYRK1/Akt/GSK-3β signaling.
In normal liver tissues, the expression of TROAP is downregulated by miR-142-5p. Intranuclear DYRK1A and DYRK1B induce Cyclin D1 proteolysis and cell cycle arrest. Inversely, TROAP highly expresses in HCC tissues and directly binds DYRK1A and DYRK1B, which forms a protein complex resulting in the cytoplasmic retention of DYRK1A and DYRK1B. Cytoplasmic DYRK1 activates Akt/GSK-3β signaling and enhances the stability and nuclear localization of Cyclin D1, which accelerates cell cycle process and promotes the malignant proliferation of HCC cell.

Similar articles

Cited by

References

    1. Bray F, et al. Global cancer statistics 2018: GLOBOCAN estimates of incidence and mortality worldwide for 36 cancers in 185 countries. CA-Cancer J. Clin. 2018;68:394–424. doi: 10.3322/caac.21492. - DOI - PubMed
    1. Fukuda MN, et al. Trophinin and tastin, a novel cell adhesion molecule complex with potential involvement in embryo implantation. Gene Dev. 1995;9:1199–1210. doi: 10.1101/gad.9.10.1199. - DOI - PubMed
    1. Yang S, Liu X, Yin Y, Fukuda MN, Zhou J. Tastin is required for bipolar spindle assembly and centrosome integrity during mitosis. FASEB J. 2008;22:1960–1972. doi: 10.1096/fj.07-081463. - DOI - PubMed
    1. Suzuki N, et al. A cytoplasmic protein, bystin, interacts with trophinin, tastin, and cytokeratin and may be involved in trophinin-mediated cell adhesion between trophoblast and endometrial epithelial cells. Proc Natl Acad. Sci. USA. 1998;95:5027–5032. doi: 10.1073/pnas.95.9.5027. - DOI - PMC - PubMed
    1. Ye J, et al. TROAP regulates prostate cancer progression via the WNT3/survivin signalling pathways. Oncol. Rep. 2019;41:1169–1179. - PubMed

Publication types

MeSH terms

Substances