. 2021 Jan 26;12(1):594.
doi: 10.1038/s41467-020-20711-1.

Metabolic regulation of telomere silencing by SESAME complex-catalyzed H3T11 phosphorylation

Affiliations

Metabolic regulation of telomere silencing by SESAME complex-catalyzed H3T11 phosphorylation

Shihao Zhang et al. Nat Commun. .

Abstract

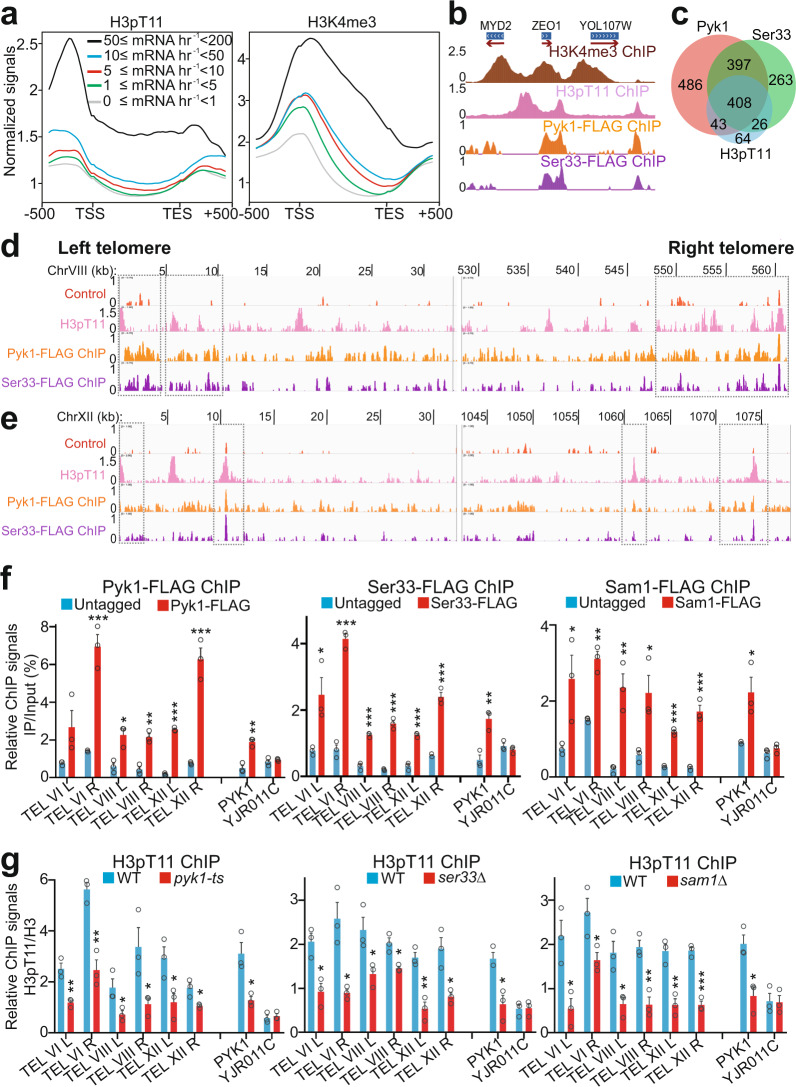
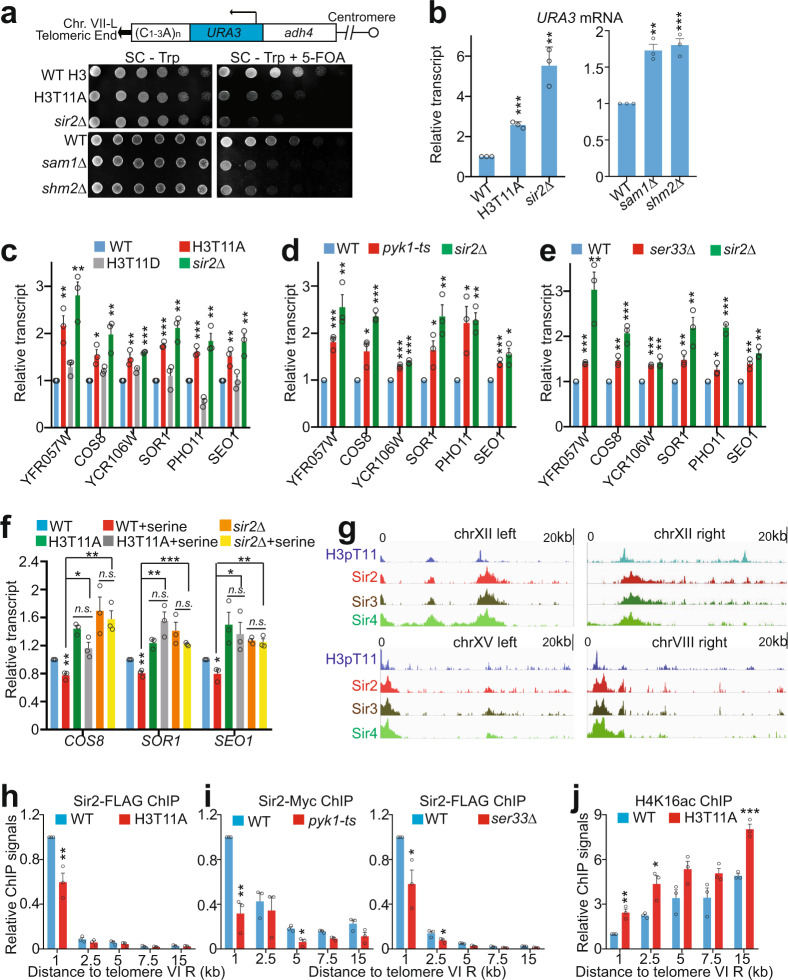
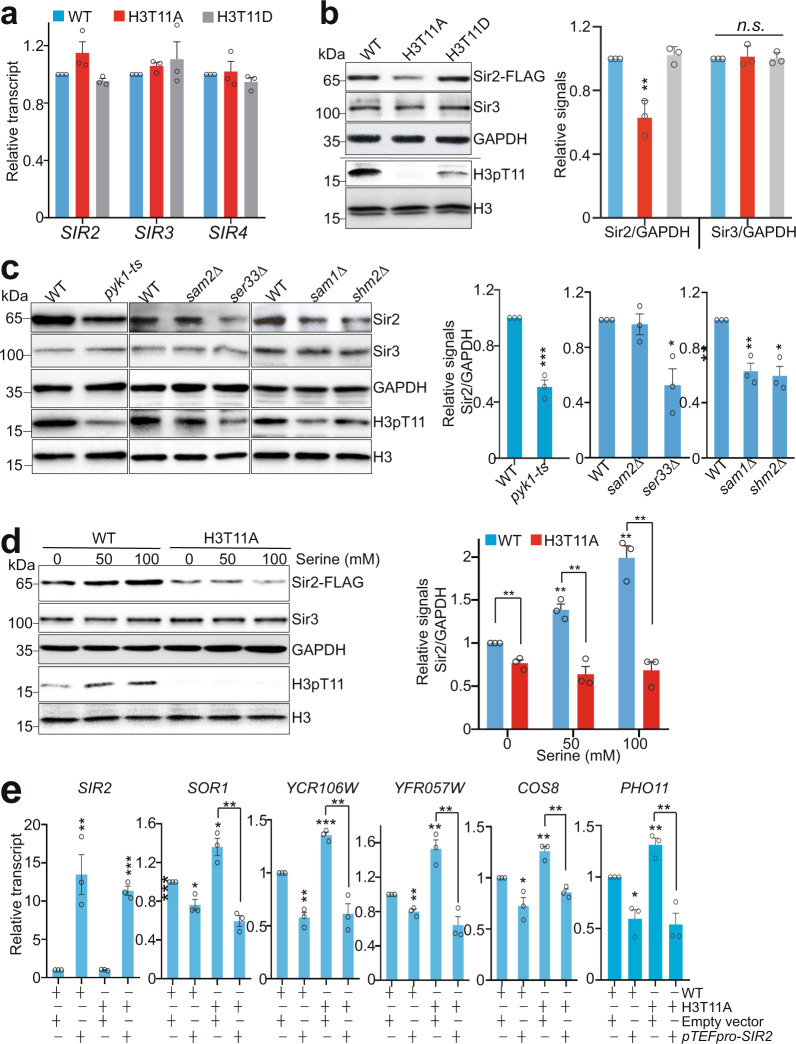
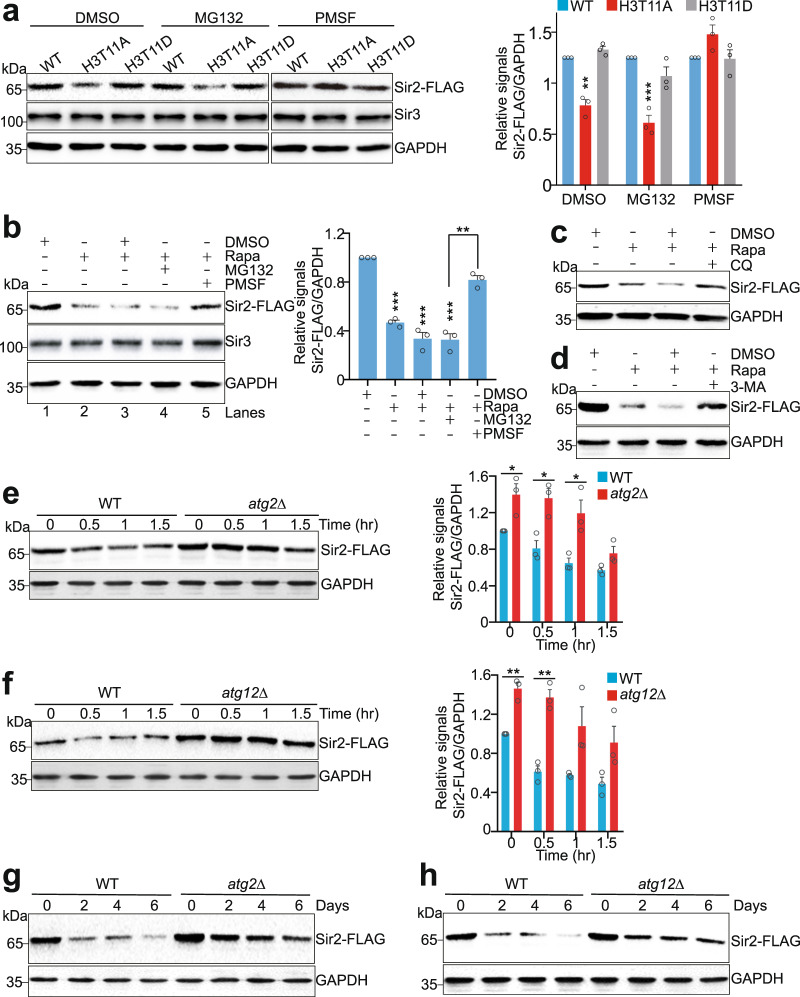
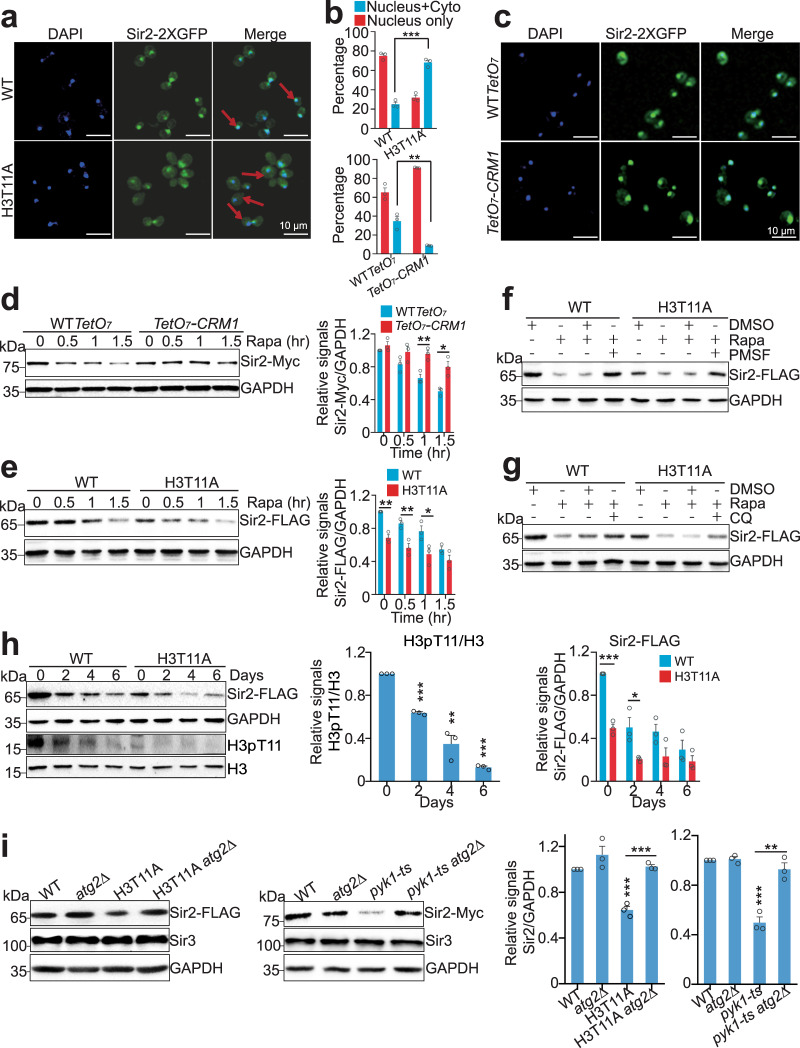
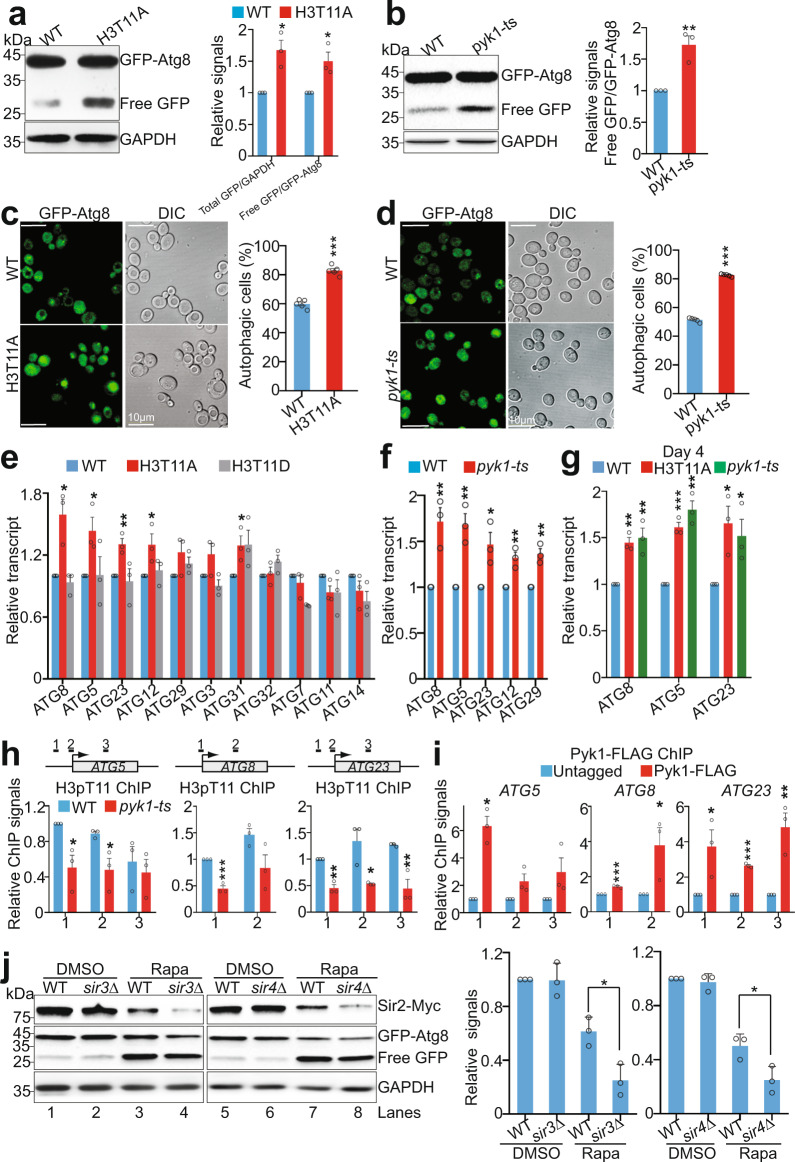
Telomeres are organized into a heterochromatin structure and maintenance of silent heterochromatin is required for chromosome stability. How telomere heterochromatin is dynamically regulated in response to stimuli remains unknown. Pyruvate kinase Pyk1 forms a complex named SESAME (Serine-responsive SAM-containing Metabolic Enzyme complex) to regulate gene expression by phosphorylating histone H3T11 (H3pT11). Here, we identify a function of SESAME in regulating telomere heterochromatin structure. SESAME phosphorylates H3T11 at telomeres, which maintains SIR (silent information regulator) complex occupancy at telomeres and protects Sir2 from degradation by autophagy. Moreover, SESAME-catalyzed H3pT11 directly represses autophagy-related gene expression to further prevent autophagy-mediated Sir2 degradation. By promoting H3pT11, serine increases Sir2 protein levels and enhances telomere silencing. Loss of H3pT11 leads to reduced Sir2 and compromised telomere silencing during chronological aging. Together, our study provides insights into dynamic regulation of silent heterochromatin by histone modifications and autophagy in response to cell metabolism and aging.


Conflict of interest statement

The authors declare no competing interests.

Figures

Fig. 1
Fig. 1. SESAME phosphorylates H3T11 at gene promoters and telomere regions.
a The composite binding profile of H3pT11 at 5065 genes which were divided into five groups according to their transcription rates. The log2 ratio of normalized enrichment (H3pT11/H3, H3K4me3/H3) for each gene region, including 500 bp upstream and downstream regions from the gene, were used for average gene analysis. The transcription start site (TSS) and termination site (TES) are indicated. b ChIP-seq tracks showing the occupancy of H3K4me3/H3, H3pT11/H3, Pyk1, and Ser33 at representative genes. c Venn diagram of genes that overlap among the Pyk1-peak, Ser33-peak, and H3pT11-peak gene sets as determined by ChIP-seq. The numbers of binding sites are represented. d, e ChIP-seq tracks showing the occupancy of H3pT11/H3, Pyk1, and Ser33 at the left and right telomere regions of chromosome VIII (TEL VIII) (d) and chromosome XII (TEL XII) (e). The control tracks were generated using untagged BY4741 strain with anti-FLAG antibody. f ChIP-qPCR analysis of Pyk1, Ser33, and Sam1 at telomeres of chromosome VI (TEL VIL and TEL VIR), chromosome VIII (TEL VIIIL and TEL VIIIR), and chromosome XII (TEL XIIL and TEL XIIR). The YJR011C was used as a non-target region. g ChIP-qPCR analysis of H3pT11 at telomeres in WT, pyk1-ts, ser33Δ, and sam1Δ mutants. Pyk1 was inactivated by growing pyk1-ts mutant at non-permissive temperature (37 °C) for 2 h. H3pT11 was normalized to histone H3 level. For Fig. 1f, g, the quantitative data represent the mean ± SE; n = 3 biological independent experiments. Statistical significance was tested using two-sided Student’s t test. *p < 0.05; **p < 0.01; ***p < 0.001.
Fig. 2
Fig. 2. SESAME-catalyzed H3pT11 promotes SIR complex binding at telomeres and is required to maintain normal telomere silencing.
a SESAME-catalyzed H3pT11 is required to maintain telomere silencing. Top panel: Diagram of the position of URA3 inserted near the telomere VII-L in the telomere silencing reporter strain. Bottom panel: WT, H3T11A, sir2Δ, sam1Δ, and shm2Δ cells bearing URA3 adjacent to Tel VII-L were grown to saturation, normalized for OD600, 3-fold serially diluted and spotted on SC - Trp and SC - Trp + 5-FOA plates. Impaired growth on 5-FOA plates indicates diminished silencing of URA3. b qRT-PCR analysis of URA3 in WT, H3T11A, sir2Δ, sam1Δ, and shm2Δ mutants. ce qRT-PCR analysis of native telomere-proximal genes (YFR057W, COS8, YCR106W, SOR1, SEO1) in WT, H3T11A (c), H3T11D (c), pyk1-ts (d), ser33Δ (e), and sir2Δ mutants. f Effect of serine on the transcription of native telomere-proximal genes (COS8, SOR1, and SEO1) in WT, H3T11A, and sir2Δ mutants as determined by qRT-PCR analysis. g ChIP-seq tracks showing the enrichment of H3pT11/H3, Sir2, Sir3, and Sir4 at regions within 20 kb of representative telomeres. h, i ChIP analysis of Sir2 occupancy at regions with different distance (1, 2.5, 5, 7.5, and 15 kb) to telomere VI-R in WT, H3T11A (h), pyk1-ts (i), and ser33Δ (i) mutants. j ChIP analysis of H4K16ac at regions with different distance (1, 2.5, 5, 7.5, and 15 kb) to telomere VI-R in WT and H3T11A mutant. H4K16 acetylation was normalized to its input. For Fig. 2b–f, h–j, the quantitative data represent the mean ± SE; n = 3 biological independent experiments. Statistical significance was tested using two-sided Student’s t test. *p < 0.05; **p < 0.01; ***p < 0.001. For Fig. 2a, shown are the typical example of three biological independent biological replicates.
Fig. 3
Fig. 3. SESAME-catalyzed H3pT11 is required to maintain global Sir2 protein levels.
a qRT-PCR analysis of SIR2, SIR3, and SIR4 expression in WT, H3T11A, and H3T11D mutants. b Left panel: Western blots analysis of Sir2 and Sir3 in WT, H3T11A, and H3T11D mutants. The H3pT11 antibody can recognize the phosphomimic site (aspartate) at H3T11D with low efficiency. Right panel: The relative intensities of Sir2/GAPDH and Sir3/GAPDH in left panel were quantified using ImageJ with standard error (SE). Data represent the mean ± SE of three biological independent experiments. c Sir2 protein levels were significantly reduced in WT, pyk1-ts, ser33Δ, sam1Δ, and shm2Δ mutants with the exception of sam2Δ as determined by Western blots analysis. d Serine significantly increased the global Sir2 protein levels in WT but not H3T11A mutant. e qRT-PCR analysis of SIR2, SOR1, YCR106W, YFR057W, COS8, and PHO11 in WT and H3T11A mutant transformed with empty vector or vector that overexpresses Sir2 (pTEFpro-SIR2). For Fig. 3a–e, the quantitative data represent means ± SE; n = 3 biological independent experiments. Statistical significance was tested using two-sided Student’s t test. *p < 0.05; **p < 0.01; ***p < 0.001; n.s. no significance.
Fig. 4
Fig. 4. Sir2 is degraded by the autophagy pathway.
a Western blots showing PMSF but not MG132 treatment rescued the reduced Sir2 proteins in the H3T11A mutant. The endogenously expressed Sir2-FLAG and Sir3 in WT, H3T11A, and H3T11D mutants were examined with anti-FLAG and anti-Sir3 antibodies, respectively. b Rapamycin-reduced Sir2 protein levels were partially rescued by PMSF treatment as determined by Western blots. Rapa rapamycin. c, d Representative Western blots showing rapamycin-reduced Sir2 protein levels were partially rescued by chloroquine (CQ) and 3-MA. e, f Western blots showing the global Sir2 protein levels were significantly higher in atg2Δ (e) and atg12Δ (f) mutants than in WT when treated with rapamycin. WT, atg2Δ, and atg12Δ mutants were treated with 1 μg/ml rapamycin for 0–1.5 h. g, h The global Sir2 protein levels were significantly higher in atg2Δ and atg12Δ mutants than in WT when aged for 0–6 days in YPD medium as determined by Western blots. For Fig. 4a, b, e, f, the quantitative data represent means ± SE; n = 3 biological independent experiments. Statistical significance was tested using two-sided Student’s t test. *p < 0.05; **p < 0.01; ***p < 0.001. For Fig. 4c, d, g, h, shown are the typical example of three biological independent experiments.
Fig. 5
Fig. 5. SESAME-catalyzed H3pT11 prevent the nuclear export of Sir2 and autophagy-mediated Sir2 degradation.
a Representative fluorescence images showing the distribution of Sir2-2xGFP (green) in WT and H3T11A cells expressing Sir2-2xGFP from the native SIR2 locus. The nucleus DNA was stained with 4’,6-diamidino-2-phenylindole (DAPI) as shown in blue. There was more Sir2 diffuse throughout the cell in H3T11A mutant compared with WT. Arrows indicate the nucleus-localized Sir2 in WT and cytoplasm-localized Sir2 H3T11A mutant, respectively. Bar, 10 μm. b Quantification of Sir2-2xGFP localization in cells displayed in Fig. 5a, c, respectively. The bar graphs represent the percentages of cells exhibiting Sir2-2xGFP localized in the nucleus (Nucleus only), or exported to the cytoplasm (Nucleus + Cyto). Data show mean ± SE from at least three biological independent experiments, with ∼350 cells counted for each strain per experiment. c Knockdown of CRM1 expression retained most Sir2 in the nucleus. WT TetO7 and TetO7-CRM1 cells grown in YPD medium were treated with 6.25 μg/ml doxycycline for 1.5 h followed by fluorescence microscopy. Bar, 10 μm. d Knockdown of CRM1 expression partly rescued rapamycin-reduced Sir2. WT TetO7 and TetO7-CRM1 cells grown in YPD medium were treated with 6.25 μg/ml doxycycline and rapamycin for 0–1.5 h. e The global Sir2 protein levels in H3T11A mutant were significantly lower than those in WT when treated with rapamycin. f, g Rapamycin-reduced Sir2 in H3T11A mutant was partly rescued by PMSF (f) and CQ (g) treatments. h Western blots analysis of Sir2 and H3pT11 in WT and H3T11A mutant when aged for 0–6 days in YPD medium. i Western blots showing deletion of ATG2 rescued the reduced Sir2 in H3T11A and pyk1-ts mutants. For WT, atg2Δ, pyk1-ts, and pyk1-ts atg2Δ mutants, these four strains were treated at 37 °C for 2 h. For Fig. 5b, d, e, h, i, the quantitative data represent means ± SE; n = 3 biological independent experiments. Statistical significance was tested using two-sided Student’s t test. *p < 0.05; **p < 0.01; ***p < 0.001. For Fig. 5f, g, shown are the typical example of three biological independent experiments.
Fig. 6
Fig. 6. SESAME-catalyzed H3pT11 prevents the autophagy flux.
a Representative immunoblot analysis of GFP-Atg8 and free GFP in WT and H3T11A mutant expressing the endogenous ATG8 promoter-driven GFP-ATG8 with anti-GFP antibody. GAPDH was used as a loading control. b GFP-Atg8 processing assays were performed in WT and pyk1-ts mutant expressing the endogenous ATG8 promoter-driven GFP-ATG8. c, d Representative fluorescence microscopy images showed the distribution of GFP-Atg8 (green) in WT, H3T11A (c) and pyk1-ts (d) mutants. The autophagic cells were defined as cells with clear vacuolar GFP fluorescence. Quantification of autophagic cells depicted in Fig. 6c, d with 200–300 counts (blinded) for each replicate. e, f qRT-PCR analysis of the transcription of autophagy-related genes in WT, H3T11A (e), H3T11D (e), and pyk1-ts (f) mutants. g qRT-PCR analysis of the transcription of autophagy-related genes in WT, H3T11A, and pyk1-ts mutants when aged for 4 days in YPD medium. h Reduced H3pT11 enrichment at ATG5, ATG8, and ATG23 in pyk1-ts mutant as determined by ChIP-qPCR using the amplicons at each gene as indicated at the top panel. i ChIP analysis of Pyk1 occupancy at ATG5, ATG8, and ATG23. j Loss of Sir3 and Sir4 accelerated rapamycin-induced Sir2 degradation. WT, sir3Δ, and sir4Δ mutants were treated with DMSO or rapamycin. The endogenously expressed Sir2 was detected with anti-Myc antibody. The autophagy activity was assessed by immunoblot analysis of GFP-Atg8 and free GFP. For Fig. 6a, b, e–j, the quantitative data represent means ± SE; n = 3 biological independent experiments. For Fig. 6c, d, the quantitative data represent means ± SE; n = 5 biological independent experiments. Statistical significance was tested using two-sided Student’s t test. *p < 0.05; **p < 0.01; ***p < 0.001.
Fig. 7
Fig. 7. H3T11 phosphorylation maintains telomere silencing by promoting Sir2 binding at telomeres and preventing autophagy-mediated Sir2 degradation.
a qRT-PCR analysis of COS8, SOR1, YCR106W, and YFR057W in WT, H3T11A, atg12Δ, and H3T11A atg12Δ mutants. b ChIP-PCR analysis of Sir2 occupancy at COS8, SOR1, YCR106W, and YFR057W in WT, H3T11A, atg12Δ, and H3T11A atg12Δ mutants. c Left panel: Western blots analysis of Sir2 and autophagy activity in WT and H3T11A mutant when aged for 0–4 days in YPD medium. Right panel: qRT-PCR analysis of YCR106W and YFR057W in WT and H3T11A mutant when aged for 0–4 days in YPD medium. For Fig. 7a–c, the quantitative data represent means ± SE; n = 3 biological independent experiments. Statistical significance was tested using two-sided Student’s t test. *p < 0.05; **p < 0.01; n.s. no significance. d Proposed model for SESAME-catalyzed H3pT11 maintains telomere silencing, promotes SIR complex binding at telomere regions, and prevents autophagy-mediated Sir2 degradation.

Similar articles

Cited by

References

    1. Oki M, Kamakaka RT. Blockers and barriers to transcription: competing activities? Curr. Opin. Cell Biol. 2002;14:299–304. doi: 10.1016/S0955-0674(02)00327-7. - DOI - PubMed
    1. Wang J, Jia ST, Jia S. New insights into the regulation of heterochromatin. Trends Genet. 2016;32:284–294. doi: 10.1016/j.tig.2016.02.005. - DOI - PMC - PubMed
    1. Moazed D. Common themes in mechanisms of gene silencing. Mol. Cell. 2001;8:489–498. doi: 10.1016/S1097-2765(01)00340-9. - DOI - PubMed
    1. Kitada T, et al. Mechanism for epigenetic variegation of gene expression at yeast telomeric heterochromatin. Genes Dev. 2012;26:2443–2455. doi: 10.1101/gad.201095.112. - DOI - PMC - PubMed
    1. Marta K, Morillon A. Subtelomeric transcription and its regulation. J. Mol. Biol. 2020;432:4199–4219. doi: 10.1016/j.jmb.2020.01.026. - DOI - PMC - PubMed

Publication types

MeSH terms