. 2021 Jan 26;11(1):2224.
doi: 10.1038/s41598-021-81245-0.

A new SYBR Green real-time PCR to detect SARS-CoV-2

Affiliations

A new SYBR Green real-time PCR to detect SARS-CoV-2

D R Marinowic et al. Sci Rep. .

Abstract

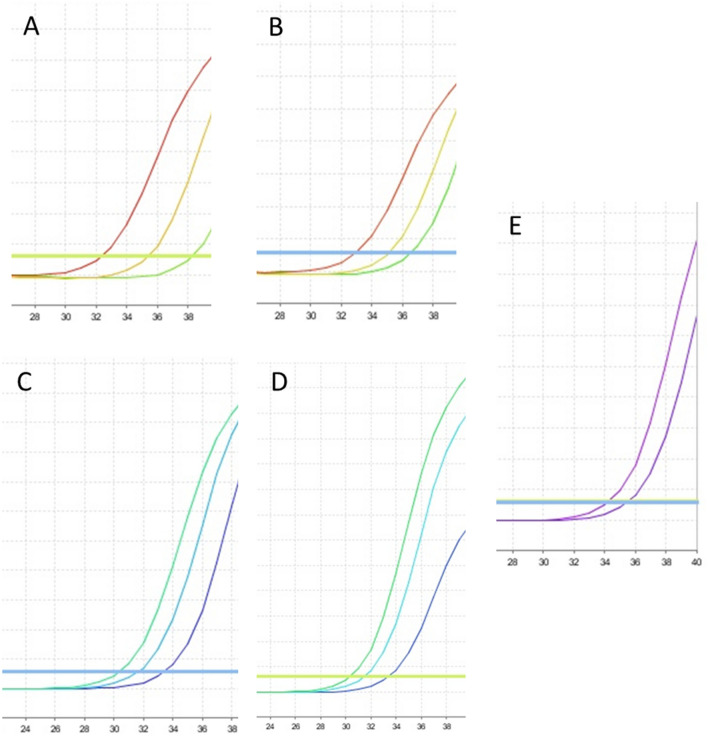
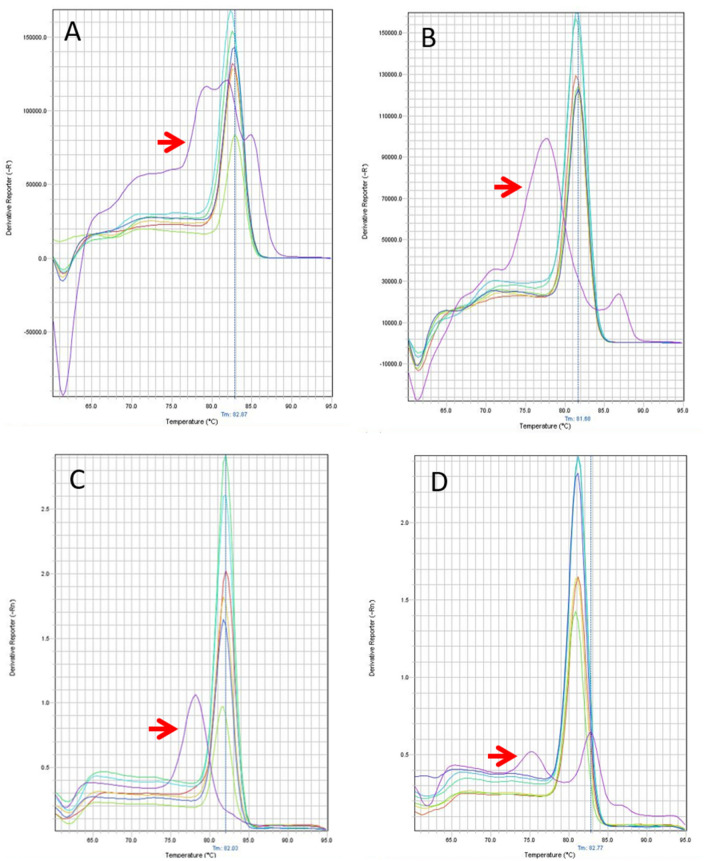
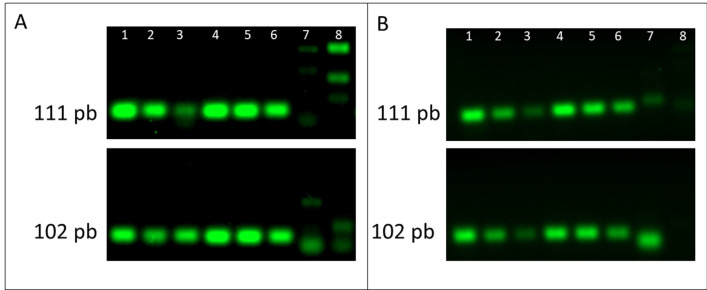
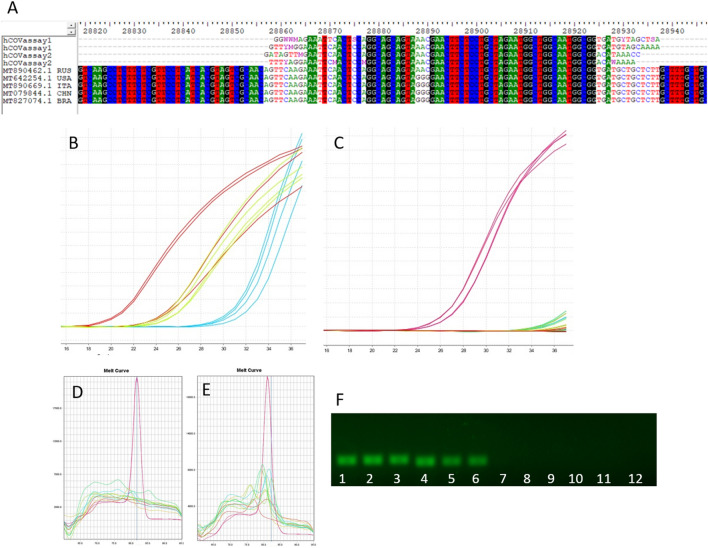
Phylogenetic analysis has demonstrated that the etiologic agent of the 2020 pandemic outbreak is a betacoronavirus named SARS-CoV-2. For public health interventions, a diagnostic test with high sensitivity and specificity is required. The gold standard protocol for diagnosis by the Word Health Organization (WHO) is RT-PCR. To detect low viral loads and perform large-scale screening, a low-cost diagnostic test is necessary. Here, we developed a cost-effective test capable of detecting SARS-CoV-2. We validated an auxiliary protocol for molecular diagnosis with the SYBR Green RT-PCR methodology to successfully screen negative cases of SARS-CoV-2. Our results revealed a set of primers with high specificity and no homology with other viruses from the Coronovideae family or human respiratory tract pathogenic viruses, presenting with complementarity only for rhinoviruses/enteroviruses and Legionella spp. Optimization of the annealing temperature and polymerization time led to a high specificity in the PCR products. We have developed a more affordable and swift methodology for negative SARS-CoV-2 screening. This methodology can be applied on a large scale to soften panic and economic burden through guidance for isolation strategies.


Conflict of interest statement

The authors declare no competing interests.

Figures

Figure 1
Figure 1
Real-time reverse transcription amplification curves using master mix without uracil DNA glycosylase (UDG) activation. (A) Dilutions of ssDNA (500 ng, 100 ng and 50 ng) from SARS-CoV-2 positive samples amplified by the 3′ primer of the hCOVassay1 set. (B) Three different dilutions of ssDNA (500 ng, 100 ng and 50 ng) from SARS-CoV-2 positive samples amplified with the 3′ primer of the hCOVassay2 set. (C,D) The three dilutions of ssDNA (100 ng, 50 ng and 10 ng) from SARS-CoV-2 positive samples produced with the random primers methodology and amplified with the (C) hCOVassay1 and (D) hCOVassay2 primers. (E) Amplification curves of negative controls produced using the two primer sets using 3′ primer ssDNA method. The negative control was from a negative patient.
Figure 2
Figure 2
Real-time reverse-transcription amplification curves using master mix with uracil DNA glycosylase (UDG) activation. (A) Three dilutions of ssDNA from SARS-CoV-2 positive samples amplified by the 3′ primer of the hCOVassay1 set. (B) Three dilutions of ssDNA from SARS-CoV-2 positive samples amplified with the hCOVassay2 primer set. (C) Three dilutions of ssDNA from SARS-CoV-2 positive samples produced by the random primers methodology and amplified with the hCOVassay1 and hCOVassay2 primers (D). (E) Amplified negative controls for the two tested primer pairs. The negative control was from a negative patient.
Figure 3
Figure 3
Representation of amplification melt curves after amplification. The melt curves showed a similar pattern for all SARS-CoV-2-positive samples using master mix without UDG activation for the hCOVassay1 (A) and hCOVassay2 (B) and with UDG activation for hCOVassay1 (C) and hCOVassay2 (D) primers. The melt curve of the negative samples was quite different from that of the positive samples (arrows). The negative control was from a negative patient.
Figure 4
Figure 4
Real-time PCR amplicons of SARS-CoV-2-positive samples after separation by 2% agarose gel electrophoresis. The 111 bp amplicon generated by RT-PCR with the hCOVassay1 primer set (upper figures) and the 102 bp amplicon generated with the hCOVassay2 primer set (lower figures). (A) Amplicons produced by RT-PCR without UDG activation. (B) Amplicons produced by RT-PCR with UDG activation. Lanes 1–3: 500 ng, 100 ng and 50 ng, respectively, of the first-strand DNA synthesized using the 3′ primer followed by PCR amplification. Lanes 4–6: 100 ng, 50 ng and 10 ng, respectively, of the first-strand DNA followed by RT-PCR amplification. Lanes 7 and 8 are negative controls. The gels were cropped for improving the quality and clarity of image. Full gels are presented in Supplementary Figs. S4 and S5.
Figure 5
Figure 5
Real-time PCR amplification curves and amplicons of SARS-CoV-2-positive and negative samples without UDG activation followed by separation with 2% agarose gel electrophoresis. (A) Amplification curve produced using the hCOVassay1 primer of SARS-CoV-2–positive (red line) and negative control (green and yellow line) samples. (B) Amplification curve produced using the hCOVassay2 primer of SARS-CoV-2-positive (green) and negative control (indigo and light blue lines) samples. (C) Amplicons after separation on a 2% agarose gel by electrophoresis. Lane 1: amplicon of a SARS-CoV-2-positive sample obtained using the hCOVassay1 primer (111 bp). Lane 2: SARS-CoV-2-negative sample amplified using hCOVassay1 primer. Lane 3: SARS-CoV-2–positive sample amplified using the hCOVassay2 primer (102 bp). Lane 4: SARS-CoV-2-negative sample amplified using the hCOVassay2 primer. The gels were cropped for improving the quality and clarity of image. Full gels are presented in Supplementary Fig. S4.
Figure 6
Figure 6
Real-time PCR amplification curves and amplicons of SARS-CoV-2-positive and negative samples with UDG activation followed by separation with 2% agarose gel electrophoresis. (A) Amplification curve of SARS-CoV-2-positive samples using the hCOVassay1 primer set (arrow). (B) Amplification curve of SARS-CoV-2-positive samples using the hCOVassay2 primer set (arrow). For both primers (A,B), no amplification or cycle threshold curves were produced for SARS-CoV-2–negative control samples. (C) Real-time PCR amplicons. Lane 1: amplicon of a SARS-CoV-2-positive sample using the hCOVassay1 primer set (111 bp). Lane 2: amplicon of a SARS-CoV-2-negative sample using the hCOVassay1 primer set (111 bp). Lane 3: amplicon of a SARS-CoV-2-positive sample using the hCOVassay2 primer (102 bp). Lane 4: amplicon of a SARS-CoV-2-negative sample using the hCOVassay2 primer (102 bp). (D) Amplicons of 4 samples and 4 controls for both primers tested in 3 different dilutions of reverse transcriptase produced by the random primers method. Lanes 1, 2 and 3: amplicons of SARS-CoV-2-positive samples using hCOVassay1 primer dilutions of 100 ng, 50 ng, and 10 ng, respectively. Lanes 7, 8 and 9: amplicons of SARS-CoV-2-positive samples using hCOVassay2 primer at dilutions of 100 ng, 50 ng, and 10 ng, respectively. Lanes 4, 5, 6, 10, 11 and 12: amplicons of SARS-CoV-2-negative samples obtained using the two primer pairs. The gels were cropped for improving the quality and clarity of image. Full gels are presented in Supplementary Figs. S5 and S6.
Figure 7
Figure 7
Real-time PCR amplification for quantifiable control and detection curves. Four different concentrations of quantification control for SARS-CoV-2 (iDT—INTEGRATED DNA TECHNOLOGIES, IOWA, USA) using the hCOVassay1 (A) and hCOVassay2 (B) primer sets are represented in grey curves. The different sample concentrations (total ssDNA after extraction) from positive patient are represented in red curves.
Figure 8
Figure 8
Real-time PCR amplification curves and amplicons of SARS-CoV-2-positive samples with UDG activation using 3′ primer method followed by separation with 2% agarose gel electrophoresis. (A) The results obtained by sequencing the amplicons obtained using the hCOVassay1 and hCOVassay2 primer sets showed high homology with SARS-CoV-2 sequences. The homology analysis was performed using entire genome sequences of strain from Russia (MT890462.1 RUS), the United States (MT642254.1 USA), Italy (MT890669.1 ITA), China (MT079844.1 CHN) and Brazil (MT827074.1 BRA). (B) Amplification curves for 3 positive samples using the hCOVassay1 and hCOVassay2 primer sets. (C) Examples of PCR amplification curves for 6 samples (5 negative samples and 1 positive sample (red curves). Melt curves dissociation for samples amplified using primer hCOVassay1 (D) and primer hCOVassay2 (E). The melt curve dissociation of the negative and positive samples was clearly distinct. (F) Electrophoresis in agarose 2% gel of 3 samples and 3 controls for both primers tested. Lanes 1–3: hCOVassay1 primer. Lanes: 4–6: hCOVassay2 primer. Lanes 7–9 and 10–12: negative controls amplified using the hCOVassay1 and hCOVassay2 primer sets, respectively. The gels were cropped for improving the quality and clarity of image. Full gels are presented in Supplementary Fig. S7.

References

    1. Bogoch II, et al. Pneumonia of unknown aetiology in Wuhan, China: Potential for international spread via commercial air travel. J. Travel Med. 2020 doi: 10.1093/jtm/taaa008. - DOI - PMC - PubMed
    1. Alavi-Moghaddam M. A novel coronavirus outbreak from Wuhan City in China, rapid need for emergency departments preparedness and response; a letter to editor. Arch. Acad. Emerg. Med. 2020;8:e12. - PMC - PubMed
    1. Benvenuto D, et al. The 2019-new coronavirus epidemic: Evidence for virus evolution. J. Med. Virol. 2020;92:455–459. doi: 10.1002/jmv.25688. - DOI - PMC - PubMed
    1. Andersen KG, Rambaut A, Lipkin WI, Holmes EC, Garry RF. The proximal origin of SARS-CoV-2. Nat. Med. 2020;26:450–452. doi: 10.1038/s41591-020-0820-9. - DOI - PMC - PubMed
    1. Wang Y, Wang Y, Chen Y, Qin Q. Unique epidemiological and clinical features of the emerging 2019 novel coronavirus pneumonia (COVID-19) implicate special control measures. J. Med. Virol. 2020 doi: 10.1002/jmv.25748. - DOI - PMC - PubMed

Publication types