. 2021 Jan 26;11(1):2269.
doi: 10.1038/s41598-021-81871-8.

Probiotics improve the neurometabolic profile of rats with chronic cholestatic liver disease

Affiliations

Probiotics improve the neurometabolic profile of rats with chronic cholestatic liver disease

Veronika Rackayová et al. Sci Rep. .

Abstract

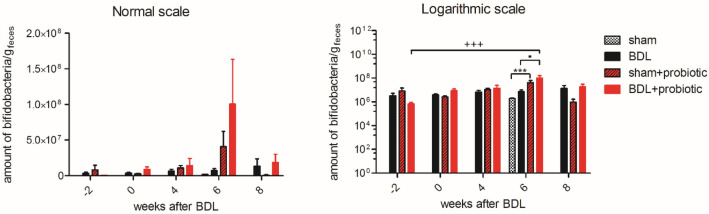
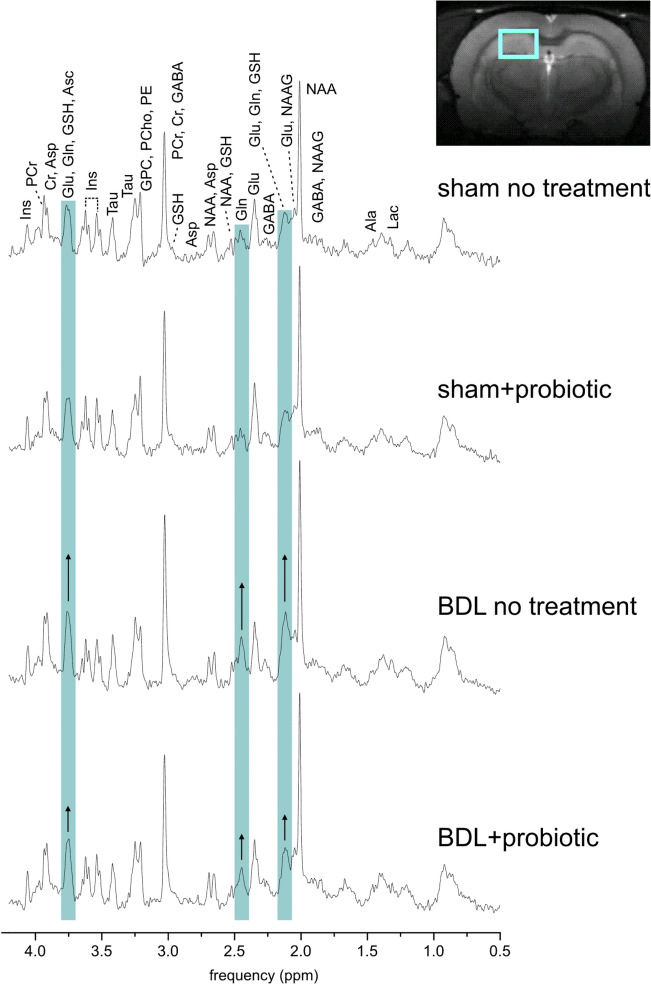
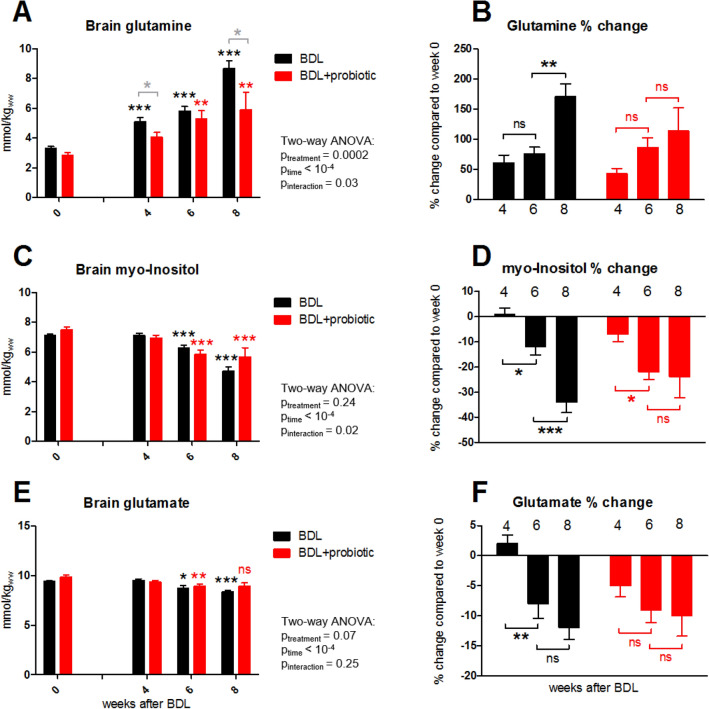
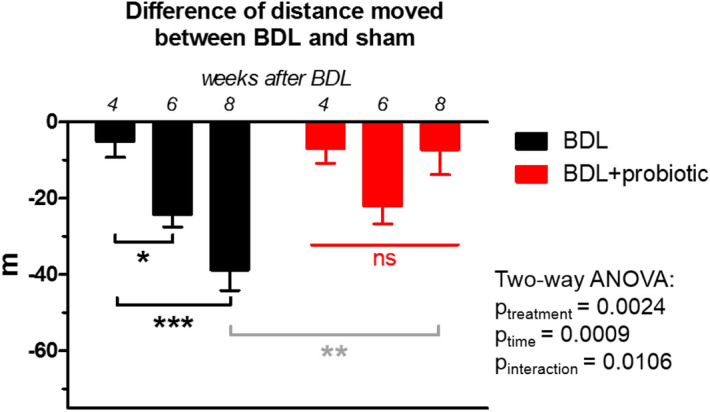
Chronic liver disease leads to neuropsychiatric complications called hepatic encephalopathy (HE). Current treatments have some limitations in their efficacy and tolerability, emphasizing the need for alternative therapies. Modulation of gut bacterial flora using probiotics is emerging as a therapeutic alternative. However, knowledge about how probiotics influence brain metabolite changes during HE is missing. In the present study, we combined the advantages of ultra-high field in vivo 1H MRS with behavioural tests to analyse whether a long-term treatment with a multistrain probiotic mixture (VIVOMIXX) in a rat model of type C HE had a positive effect on behaviour and neurometabolic changes. We showed that the prophylactic administration of this probiotic formulation led to an increase in gut Bifidobacteria and attenuated changes in locomotor activity and neurometabolic profile in a rat model of type C HE. Both the performance in behavioural tests and the neurometabolic profile of BDL + probiotic rats were improved compared to the BDL group at week 8 post-BDL. They displayed a significantly lesser increase in brain Gln, a milder decrease in brain mIns and a smaller decrease in neurotransmitter Glu than untreated animals. The clinical implications of these findings are potentially far-reaching given that probiotics are generally safe and well-tolerated by patients.


Conflict of interest statement

The authors declare no competing interests.

Figures

Figure 1
Figure 1
Amount of Bifidobacteria/g of faeces expressed in normal and logarithmic scale. One-way ANOVA was used for statistical analysis, shown on the logarithmic scale graph: *between sham and sham + probiotics at week 6, ▪between BDL and BDL + probiotic at week 6, + between BDL + probiotic between week − 2 and week 6.
Figure 2
Figure 2
Representative in vivo 1H MRS spectra 8 weeks after surgery from sham rat, sham + probiotic rat, BDL rat and BDL + probiotic rat (SPECIAL sequence, TE = 2.8 ms, TR = 4000 ms, 160 averages). Blue bands highlight glutamine resonance that is visibly increased in BDL rats with smaller increase in BDL + probiotic rat. T2 weighted axial image of the rat brain indicates position of measured volume (2 × 2.8 × 2mm3) placed in dorsal hippocampus. Ala alanine, Asc ascorbate, Asp aspartate, GPC glycerophosphocholine, PCho phosphocholine, Cr creatine, PCr phosphocreatine, GABA γ-aminobutyric acid, Glc glucose, Gln glutamine, Glu glutamate, GSH glutathione, mIns myo-inositol, Lac lactate, NAA N-acetylaspartate, NAAG N-acetylaspartylglutamate, PE phosphoethanolamine, Tau taurine.
Figure 3
Figure 3
Longitudinal brain Gln, mIns and Glu. Expressed in absolute concentration as mmol/kgww (mmol per kg wet weight) (A,C,E) and % changes as compared to scan 0 (B,D,F). Significance (one-way ANOVA with Bonferroni corrections) on graphs (A,C,E) in comparison to brain concentration of corresponding metabolite at week 0 (black, red) or between the two groups for a given week (grey). ns non-significant.
Figure 4
Figure 4
Performance in open field test. In black, difference in distance moved in meters (m) during the open field test between BDL rats and their shams at corresponding weeks. In red, difference between BDL + probiotic rats and their shams (sham + probiotic). There was no significant change between any weeks in BDL + probiotic group. Significance (one-way ANOVA with Bonferroni corrections) is given intra-group (black, red) or between the two groups at week 8 (grey).

References

    1. Dasarathy S, et al. Ammonia toxicity: From head to toe? Metab. Brain Dis. 2017;32:529–538. doi: 10.1007/s11011-016-9938-3. - DOI - PMC - PubMed
    1. Romero-Gómez M, Jover M, Galán JJ, Ruiz A. Gut ammonia production and its modulation. Metab. Brain Dis. 2009;24:147–157. doi: 10.1007/s11011-008-9124-3. - DOI - PubMed
    1. Weiss N, Jalan R, Thabut D. Understanding hepatic encephalopathy. Intensive Care Med. 2018;44:231–234. doi: 10.1007/s00134-017-4845-6. - DOI - PubMed
    1. Collins CM, D’Orazio SEF. Bacterial ureases: Structure, regulation of expression and role in pathogenesis. Mol. Microbiol. 1993;9:907–913. doi: 10.1111/j.1365-2958.1993.tb01220.x. - DOI - PubMed
    1. Bajaj JS. The role of microbiota in hepatic encephalopathy. Gut Microbes. 2014;5:397–403. doi: 10.4161/gmic.28684. - DOI - PMC - PubMed

Publication types

MeSH terms

LinkOut - more resources