. 2021 Jan 26;4(1):117.
doi: 10.1038/s42003-020-01626-5.

Mash-based analyses of Escherichia coli genomes reveal 14 distinct phylogroups

Affiliations

Mash-based analyses of Escherichia coli genomes reveal 14 distinct phylogroups

Kaleb Abram et al. Commun Biol. .

Abstract

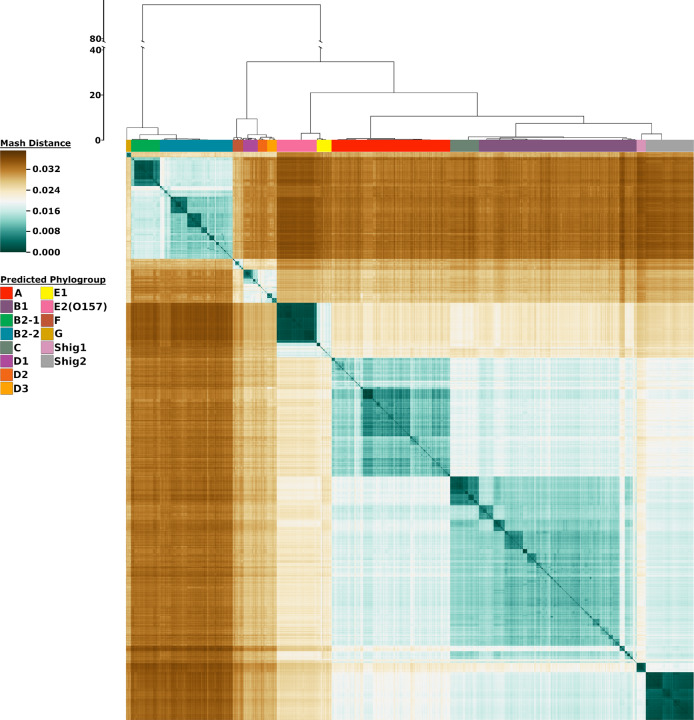
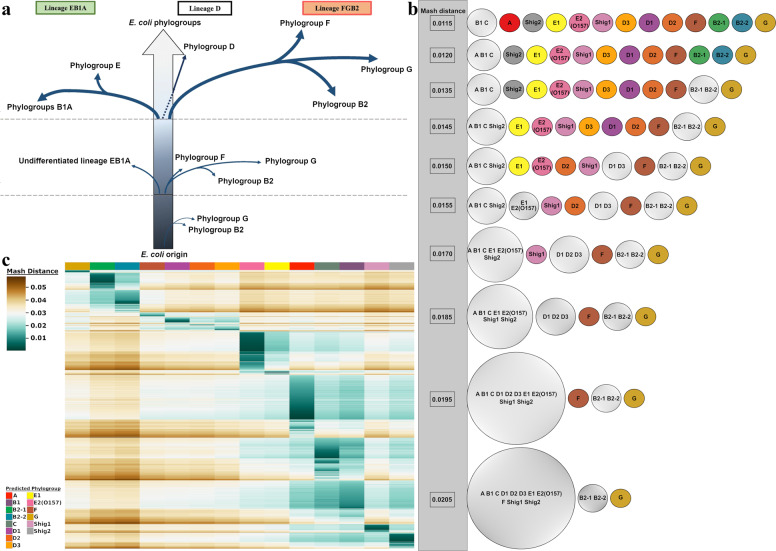
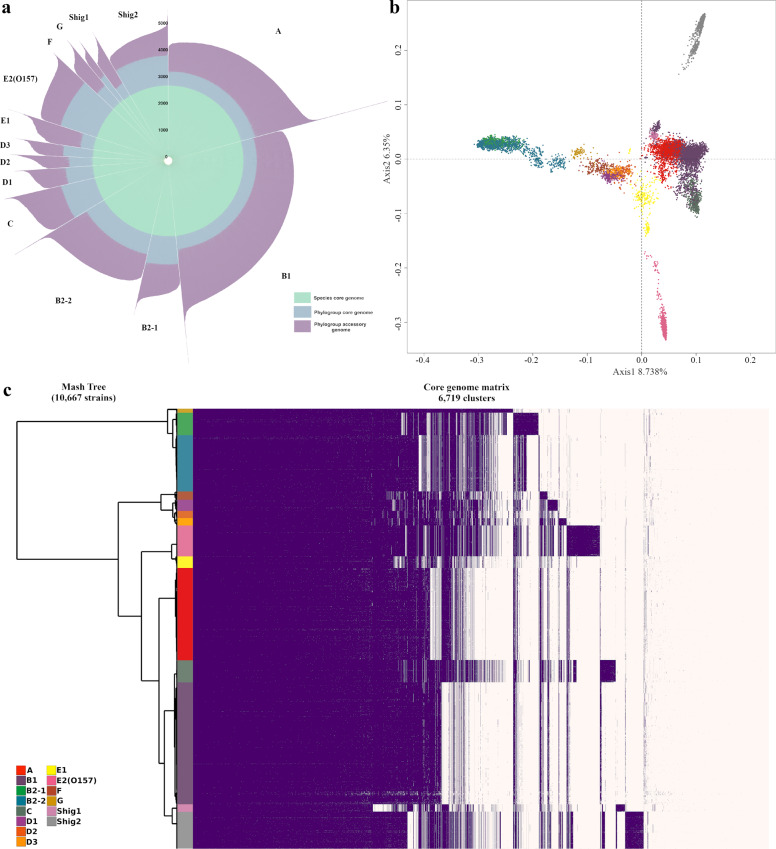
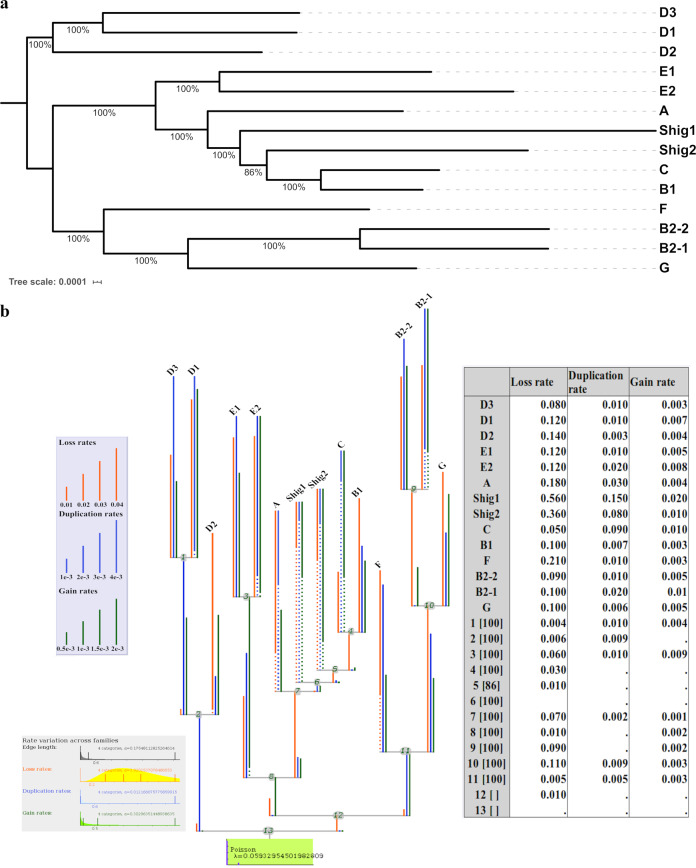
In this study, more than one hundred thousand Escherichia coli and Shigella genomes were examined and classified. This is, to our knowledge, the largest E. coli genome dataset analyzed to date. A Mash-based analysis of a cleaned set of 10,667 E. coli genomes from GenBank revealed 14 distinct phylogroups. A representative genome or medoid identified for each phylogroup was used as a proxy to classify 95,525 unassembled genomes from the Sequence Read Archive (SRA). We find that most of the sequenced E. coli genomes belong to four phylogroups (A, C, B1 and E2(O157)). Authenticity of the 14 phylogroups is supported by several different lines of evidence: phylogroup-specific core genes, a phylogenetic tree constructed with 2613 single copy core genes, and differences in the rates of gene gain/loss/duplication. The methodology used in this work is able to reproduce known phylogroups, as well as to identify previously uncharacterized phylogroups in E. coli species.


Conflict of interest statement

The authors declare no competing interests.

Figures

Fig. 1
Fig. 1. Heatmap representation of 10,667 genomes using Mash distances.
The color bars at the top of the heatmap identify the phylogroups as predicted from the analysis. The scale to the left of the dendrogram corresponds to the resultant cluster height of the entire dataset obtained from hclust function in R. The colors in the heatmap are based on the pairwise Mash distances. Shades of teal represent similarity between genomes, with the darkest teal corresponding to identical genomes reporting a Mash distance of 0. Shades of brown represent low genetic similarity per Mash distance, with the darkest brown indicating a maximum distance of ~0.039. Genomes of relative median genetic similarity have the lightest color.
Fig. 2
Fig. 2. Summary of phylogroup differentiation and heatmap representation of sequence reads from the SRA database.
a Evolutionary scenario in the diversification of E. coli adapted from Gonzalez-Alba et al., based on their methodology “SP-mPH,” a combination of “stratified phylogeny” and “molecular polymorphism hallmark.” Each branch reflects SNPs accrued by each phylogroup over time. Branch length is not proportional to the observed evolutionary distance. b Summary of the Cytoscape analysis. Phylogroups are colored based on the same color scheme in Fig. 1. Phylogroups with more than one member are gray colored. The Mash distance at which each division occurs at is indicated by numerical value in the gray bar that runs down the side of this panel. c Clustered heatmap of 91,260 unassembled sequence reads. The heatmap colors are based on the pairwise Mash distance between the SRA read sets and the 14 medoid genomes, one for each phylogroup, which are presented in the same order as in Fig. 1. To be included, SRA reads sets had to have three or more medoid comparisons producing a Mash distance equal to or less than 0.04. This removed 4265 SRA read sets from the dataset. The number of SRA reads mapped to each medoids is given below the heatmap. Additional heatmaps of the SRA data can be found in Supplementary Figs. 3–16.
Fig. 3
Fig. 3. Pangenome representations of E. coli and Shigella.
a Each bar length of the circular bar plot represents the total number of proteins of a single genome, grouped by phylogroup. The proteins belonging to the TOTcore97 genome are shown in green. Additional proteins shared in each PHYcore97 genome are shown in blue, whereas purple is reserved for accessory proteins. b Principal Coordinate Analysis plot of 135,983 protein families of 10,667 assembled genomes. Phylogroups are indicated by the same color scheme used in Figs. 1 and 2. c Core genome matrix of 6719 phylogroup core clusters and 10,667 assembled genomes. Clusters are sorted such that the core for the species is placed first, then the phylogroup core genes are placed, sorted by their overall abundance in the species for each phylogroup in the same order as Fig. 1; finally, the remaining clusters are placed by overall abundance. Phylogroup unique core genes are indicated by purple blocks which do not appear in other phylogroups.
Fig. 4
Fig. 4. Phylogenetic representations of E. coli species using the core genome of the 14 medoids.
a The tree was built using a set of 2,613 core clusters with no paralogs using IQ-TREE. b Summary representation of Count output. The phylogenetic tree presents the different gain/loss/duplication ratios obtained per each phylogroup as output of Count v.10.04 software. Dots in branches represent “informative ellipsis” where the length of the undotted section of the branch multiplied by the inverse ratio of undotted section is equal to the true rate of the branch. For example, assuming the displayed branch length is 1 and 1/10 of the branch is solid, then the true rate of the branch would be 10. Gain/loss/duplication rates for each branch are shown in the table.

References

    1. Jang J, et al. Environmental Escherichia coli: ecology and public health implications-a review. J. Appl. Microbiol. 2017;123:570–581. doi: 10.1111/jam.13468. - DOI - PubMed
    1. Alm, E. W., Walk, S. T. & Gordon, D. M. in Population Genetics of Bacteria. 69–89, 10.1128/9781555817114.ch6 (Wiley, 2011).
    1. Lan R, Reeves PR. Escherichia coli in disguise: molecular origins of Shigella. Microbes Infect. 2002;4:1125–1132. doi: 10.1016/S1286-4579(02)01637-4. - DOI - PubMed
    1. Fischer Walker CL, Sack D, Black RE. Etiology of diarrhea in older children, adolescents and adults: a systematic review. PLoS Negl. Trop. Dis. 2010;4:e768. doi: 10.1371/journal.pntd.0000768. - DOI - PMC - PubMed
    1. Dunne, K. A. et al. Sequencing a piece of history: complete genome sequence of the original Escherichia coli strain. Microb. Genom. 3, mgen000106 (2017). - PMC - PubMed

Publication types

Substances