. 2021 Jan 18:14:87-99.
doi: 10.2147/PGPM.S271516. eCollection 2021.

High LARGE1 Expression May Predict Benefit from Adjuvant Chemotherapy in Resected Non-Small-Cell Lung Cancer

Affiliations

High LARGE1 Expression May Predict Benefit from Adjuvant Chemotherapy in Resected Non-Small-Cell Lung Cancer

Yu Liu et al. Pharmgenomics Pers Med. .

Abstract

Background: LARGE1 plays a pivotal role in glycosylation of alpha-Dystroglycan (α-DG) and is aberrantly downregulated in cell lines originating from epithelium-derived cancers including lung cancer. However, the expression of LARGE1 and its clinical significance in NSCLC are not clear.

Materials and methods: The data were collected from the TCGA database to investigate LARGE1 expression in stage I-III NSCLC and explore its associations with clinicopathological parameters and overall survival of patients. The prognostic role of LARGE1 was examined in subgroups according to clinical features and treatments. The results were validated in external cohorts from the NCBI GEO database. Gene Set Enrichment Analysis (GSEA) was performed to investigate the potential molecular mechanisms during LARGE1 alteration in NSCLC.

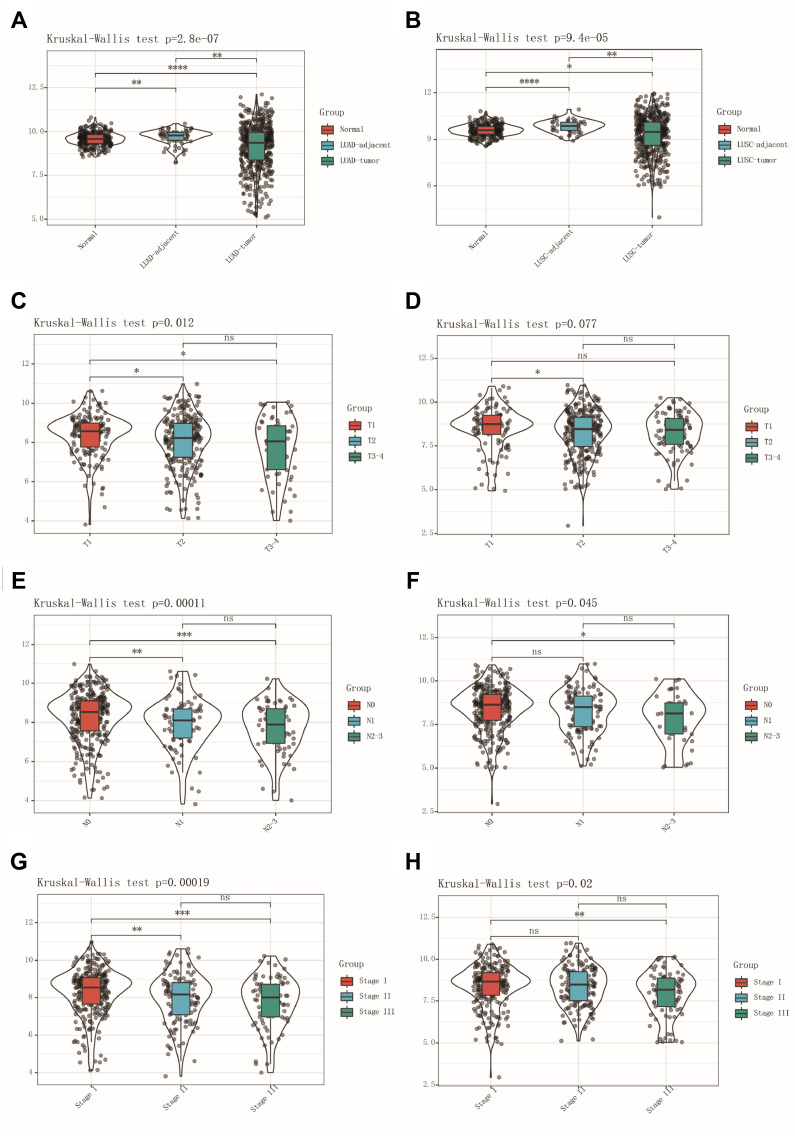
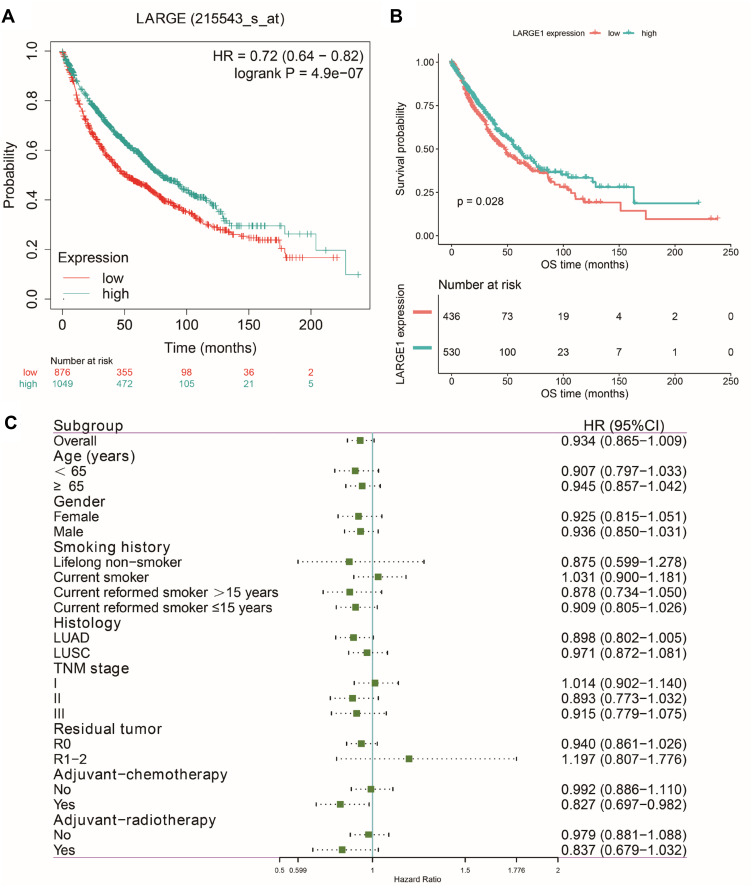
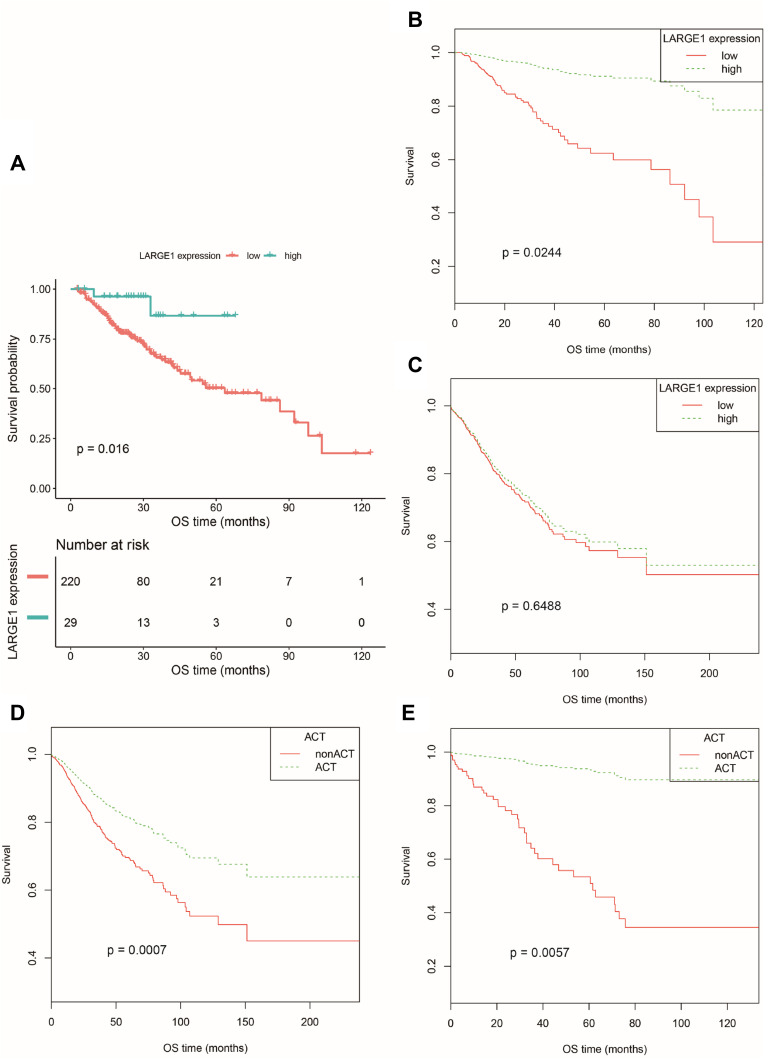
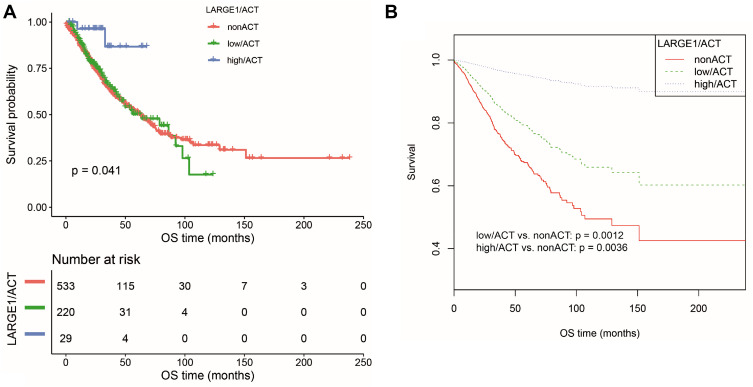
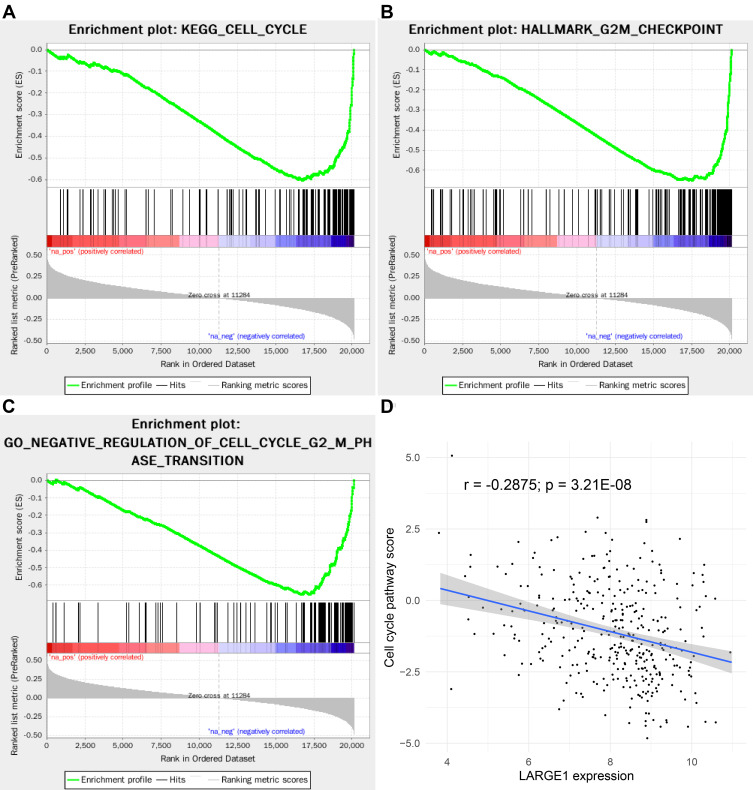
Results: LARGE1 was aberrantly downregulated in NSCLC compared with adjacent tissues and normal lung tissues and in tumors with advanced stage compared with early stage. There was only a trend of association between high LARGE1 with OS in multivariate analysis. Surprisingly, high LARGE1 was significantly associated with improved OS in a subgroup of the patients with adjuvant chemotherapy (ACT) and a significant interaction between LARGE1 expression and ACT was found. Improved OS after ACT was also found in patients with high LARGE1 compared to those with low LARGE1. When combining LARGE1 expression and ACT, compared with patients with non-ACT, HR of low LARGE1/ACT was 0.592 (95% CI=0.432-0.813, P=0.0012), and HR of high LARGE1/ACT was 0.124 (95% CI=0.031-0.505, P=0.0036). The results were verified in two external cohorts from the GEO database. GSEA indicated that LARGE1 might downregulate cell cycle pathway to improve ACT sensitivity and subsequently the prognosis in NSCLC.

Conclusion: High LARGE1 can be used to identify the patients with resected stage I-III NSCLC most likely to benefit from adjuvant chemotherapy.

Keywords: LARGE1; NSCLC; adjuvant chemotherapy; benefit; mRNA; overall survival.


Conflict of interest statement

The authors report no conflicts of interest in this work.

Figures

Figure 1
Figure 1
LARGE1 mRNA expression in NSCLC. (A, B) LARGE1 expression in lung adenocarcinoma (LUAD) (A) and lung squamous cell carcinoma (LUSC) (B) compared to corresponding adjacent tissues and normal lung tissues. (CH) LARGE1 expression in LUAD (C, E, and G) and LUSC (D, F, and H) with different T stages (C and D), N stages (E and F), and TNM stages (G and H).
Figure 2
Figure 2
Effects of LARGE1 on overall survival (OS) in NSCLC. (A) OS difference between NSCLC patients with high and low LARGE1 expression analyzed by the web-tool, Kaplan-Meier plotter, using auto select best cutoff value and the JetSet best probe set (215543_s_at). (B) OS difference between TNM I–III NSCLC patients with high and low LARGE1 expression from TCGA, analyzed by Kaplan-Meier curve with Log rank test. (C) Forest plot of the hazard ratios (HRs) for the associations of increasing LARGE1 expression (serves as a continuous variable) with overall survival (OS) of patients with TNM I–III NSCLC in subgroups stratified by age, gender, smoking history, histology, TNM stage, margin, adjuvant chemotherapy, and adjuvant radiotherapy.
Figure 3
Figure 3
OS difference between TNM I–III NSCLC patients with high and low LARGE1 expression split by optimal cutoff value in subgroups stratified by adjuvant chemotherapy treatment (ACT) and between NSCLC patients with and without ACT in subgroups stratified by LARGE1 expression, demonstrated by Kaplan-Meier curves. (A) OS difference between NSCLC patients with high and low LARGE1 expression in the subgroup with ACT. (B) OS difference between NSCLC patients with high and low LARGE1 expression in subgroup of ACT adjusted by the confounding factors. (C) OS difference between NSCLC patients with high and low LARGE1 expression in subgroup of non-ACT adjusted by the confounding factors. (D) OS difference between NSCLC patients with and without ACT in the subgroup of low LARGE1 expression adjusted by the confounding factors. (E) OS difference between NSCLC patients with and without ACT in the subgroup of high LARGE1 expression adjusted by the confounding factors.
Figure 4
Figure 4
OS difference in TNM I–III NSCLC patients stratified by combining LARGE1 expression and adjuvant chemotherapy (ACT), ie, non-ACT, low LARGE1/ACT, and high LARGE1/ACT. (A and B) LARGE1 expression was split into high and low groups by optimal cutoff value; OS difference of patients with non-ACT, low LARGE1/ACT, and high LARGE1/ACT was analyzed by Kaplan-Meier curve (A), which was also analyzed by adjusting the confounding factors (B).
Figure 5
Figure 5
Gene Set Enrichment Analysis (GSEA) of LARGE1 co-expressed genes in lung adenocarcinoma (LUAD). Genes were ranked by Spearman’s rank rho association with LARGE1 expression were subjected to GSEA with KEGG pathways, HALLMARKS, and GO biological processes as reference databases. (A) The top 10 negative and top 10 positive KEGG pathways associated with LARGE1 expression. (B) The top 10 negative and top 10 positive HALLMARKS associated with LARGE1 expression. (C) The top 10 negative and top 10 positive GO biological processes associated with LARGE1 expression.
Figure 6
Figure 6
LARGE1 expression was negatively associated with cell cycle in lung adenocarcinoma (LUAD). (AC) KEGG Cell cycle pathway (A), HALLMARK G2/M checkpoint (B), and GO cell cycle G2/M phase transition (C) were all negatively associated with LARGE1 expression. (D) The association of LARGE1 expression with cell cycle pathway score, which was calculated by summing cell cycle-related proteins expression.

Similar articles

Cited by

References

    1. Siegel RL, Miller KD, Jemal A. Cancer statistics, 2020. CA Cancer J Clin. 2020;70(1):425. - PubMed
    1. Travis WD. Pathology of lung cancer. Clin Chest Med. 2011;32(4):669–692. doi:10.1016/j.ccm.2011.08.005 - DOI - PubMed
    1. Torre LA, Siegel RL, Jemal A. Lung cancer statistics. Adv Exp Med Biol. 2016;893:893. doi:10.1007/978-3-319-24223-1_1 - DOI - PubMed
    1. Xue C, Hu Z, Jiang W, et al. National survey of the medical treatment status for non-small cell lung cancer (NSCLC) in China. Lung Cancer. 2012;77(2):371–375. doi:10.1016/j.lungcan.2012.04.014 - DOI - PubMed
    1. Hung -J-J, Jeng W-J, Hsu W-H, Huang B-S, Wu Y-C. Time trends of overall survival and survival after recurrence in completely resected stage I non-small cell lung cancer. J Thorac Oncol. 2012;7(2):397–405. doi:10.1097/JTO.0b013e31823b564a - DOI - PubMed

LinkOut - more resources