. 2021 Jan 1;11(5):2201-2217.
doi: 10.7150/thno.52717. eCollection 2021.

m6A regulator-based methylation modification patterns characterized by distinct tumor microenvironment immune profiles in colon cancer

Affiliations

m6A regulator-based methylation modification patterns characterized by distinct tumor microenvironment immune profiles in colon cancer

Wei Chong et al. Theranostics. .

Abstract

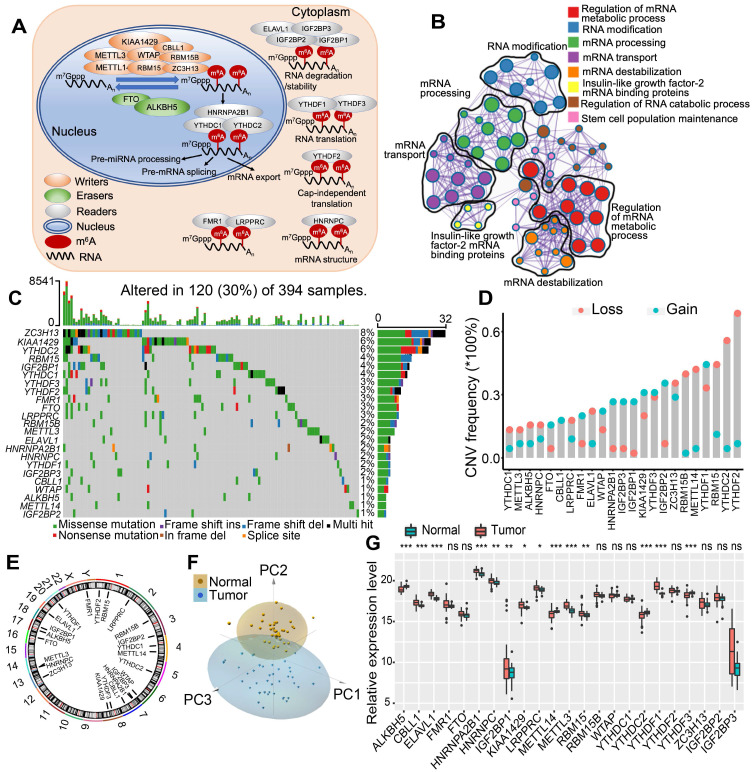
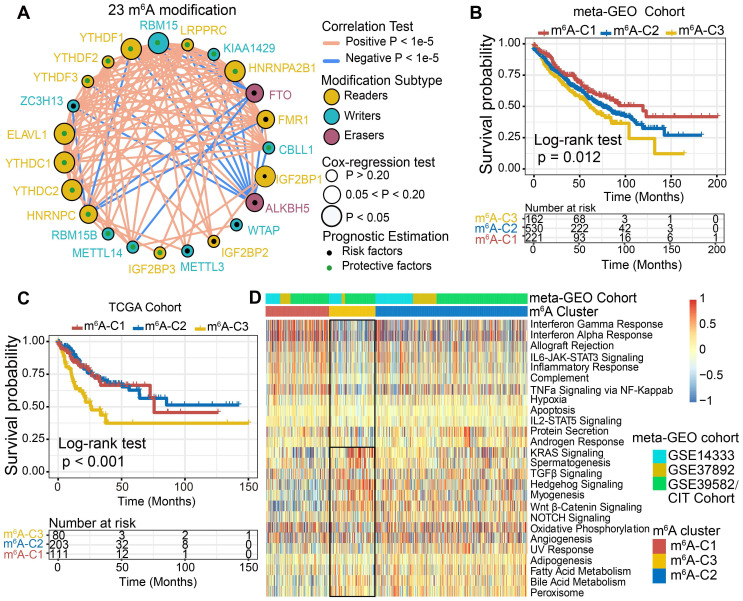
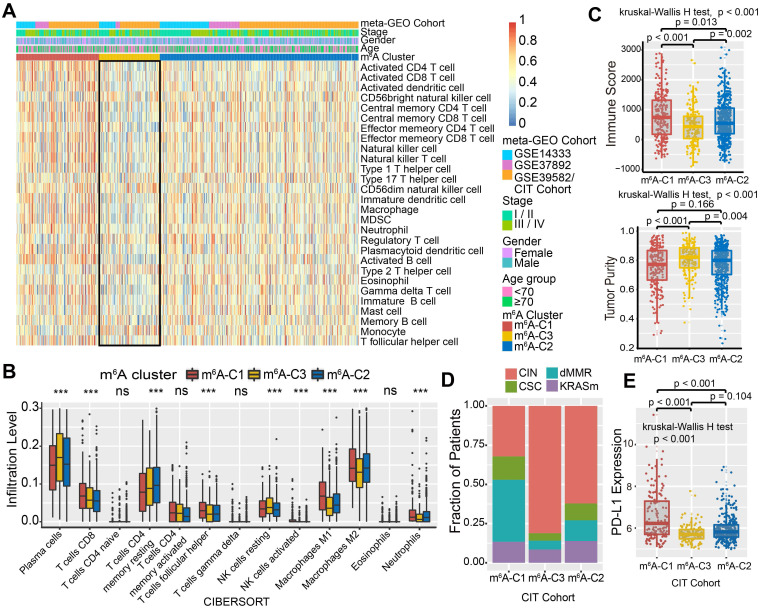
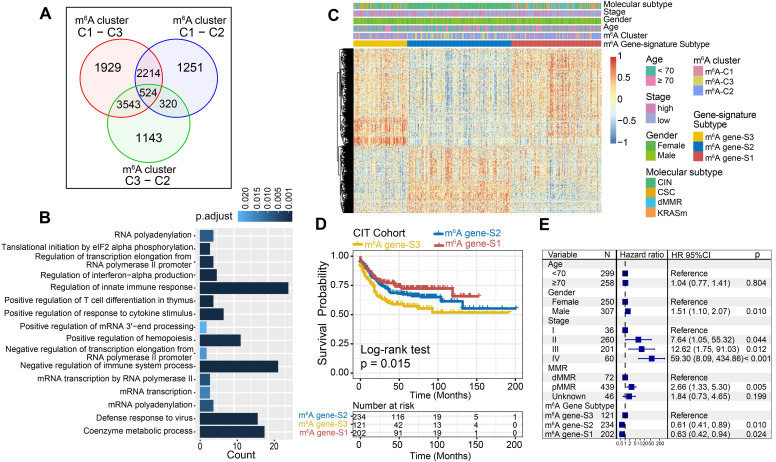
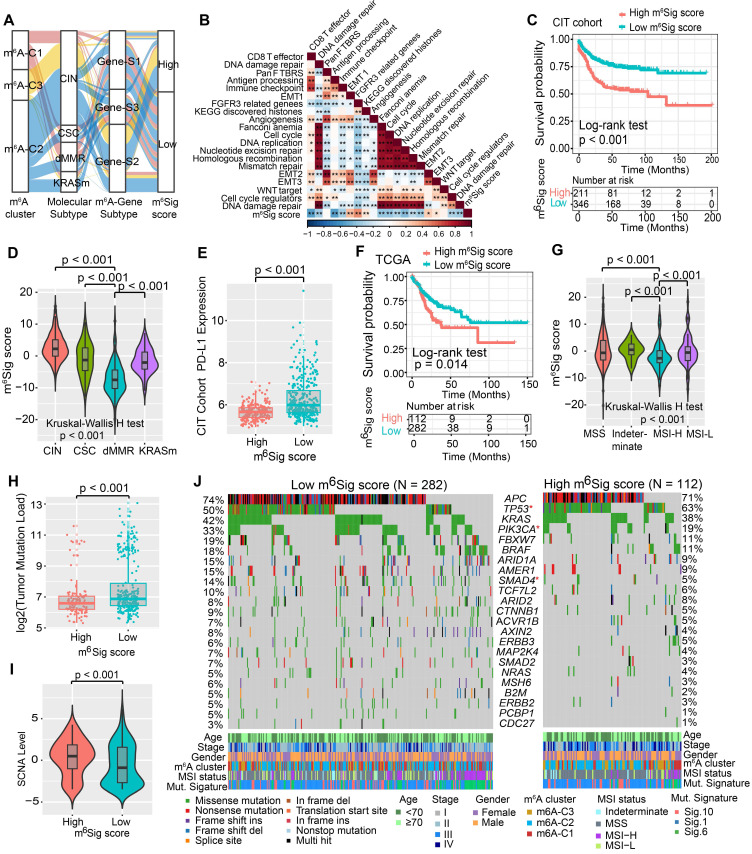
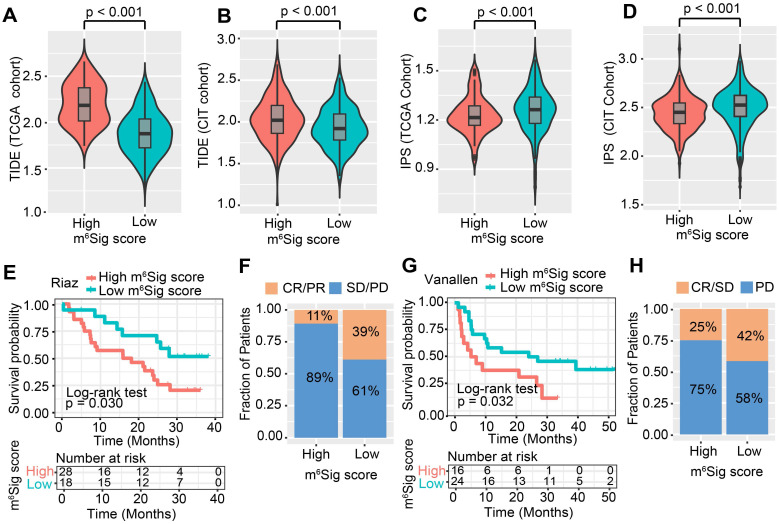
Recent studies have highlighted the biological significance of RNA N6-methyladenosine (m6A) modification in tumorigenicity and progression. However, it remains unclear whether m6A modifications also have potential roles in immune regulation and tumor microenvironment (TME) formation. Methods: In this study, we curated 23 m6A regulators and performed consensus molecular subtyping with NMF algorithm to determine m6A modification patterns and the m6A-related gene signature in colon cancer (CC). The ssGSEA and CIBERSORT algorithms were employed to quantify the relative infiltration levels of various immune cell subsets. An PCA algorithm based m6Sig scoring scheme was used to evaluate the m6A modification patterns of individual tumors with an immune response. Results: Three distinct m6A modification patterns were identified among 1307 CC samples, which were also associated with different clinical outcomes and biological pathways. The TME characterization revealed that the identified m6A patterns were highly consistent with three known immune profiles: immune-inflamed, immune-excluded, and immune-desert, respectively. Based on the m6Sig score, which was extracted from the m6A-related signature genes, CC patients can be divided into high and low score subgroups. Patients with lower m6Sig score was characterized by prolonged survival time and enhanced immune infiltration. Further analysis indicated that lower m6Sig score also correlated with greater tumor mutation loads, PD-L1 expression, and higher mutation rates in SMGs (e.g., PIK3CA and SMAD4). In addition, patients with lower m6Sig scores showed a better immune responses and durable clinical benefits in three independent immunotherapy cohorts. Conclusions: This study highlights that m6A modification is significantly associated with TME diversity and complexity. Quantitatively evaluating the m6A modification patterns of individual tumors will strengthen our understanding of TME characteristics and promote more effective immunotherapy strategies.

Keywords: Colon cancer; Immune profiles; Immunotherapy; Tumor microenvironment; m6A modification.


Conflict of interest statement

Competing Interests: The authors have declared that no competing interest exists.

Figures

Figure 1
Figure 1
The landscape of genetic alterations of m6A regulators in colon cancer. (A) Regulation of m6A modification and its biological functions in RNA metabolism by m6A “writer”, “eraser” and “reader” proteins. m6A RNA methylation was known to be involved in all stages in the life cycle of RNA including pre-mRNA splicing, pre-miRNA processing, RNA translation, RNA degradation/stability, etc. (B) Metascape enrichment network visualization showed the intra-cluster and inter-cluster similarities of enriched terms, up to 20 terms per cluster. Cluster annotations were shown in the color code. (C) 120 of the 394 CC patients experienced genetic alterations of 23 m6A regulators, with a frequency of 30%, mostly including amplification, missense mutations, and deep deletions. The number on the right indicated the mutation frequency in each regulator. Each column represented individual patients. (D) The CNV mutation frequency of 23 m6A regulators was prevalent. The column represented the alteration frequency. The deletion frequency, pink dot; The amplification frequency, blue dot. (E) The location of CNV alteration of m6A regulators on chromosomes. (F) Principal component analysis of 23 m6A regulators to distinguish tumors from normal samples. (G) The difference of mRNA expression levels of 23 m6A regulators between normal and CC samples. The asterisks represented the statistical P-value (*P < 0.05; **P < 0.01; ***P < 0.001).
Figure 2
Figure 2
m6A methylation modification pattern and relevant biological pathway. (A) The interaction of expression on 23 m6A regulators in CC. The m6A regulators in three RNA modification types were depicted by circles in different colors. Readers, yellow; Writers, blue; Erasers, red. The lines connecting m6A regulators represented their interaction with each other. The size of each circle represented the prognosis effect of each regulator and scaled by P-value. Protective factors for patients' survival were indicated by a green dot in the circle center and risk factors indicated by the black dot in the circle center. (B) Kaplan-Meier curves of relapse-free survival (RFS) for 913 CC patients in meta-GEO cohort with different m6A clusters. The numbers of patients in m6A-C1, m6A-C2, and m6A-C3 phenotypes are 221, 530, and 162, respectively (Log-rank test). (C) Kaplan-Meier curves of relapse-free survival (RFS) for 394 CC patients in the TCGA cohort with three m6A clusters. The numbers of patients in m6A-C1, m6A-C2, and m6A-C3 phenotypes are 111, 203, and 80, respectively (Log-rank test). The m6A-C3 showed significantly worse prognostic than the other two m6A clusters in both meta-GEO and TCGA-COAD cohorts. (D) Heatmap shows the GSVA score of representative Hallmark pathways curated from MSigDB in distinct m6A modification patterns. The GEO cohort composition (GSE14333, GSE37892, and GSE39582) were used as sample annotations.
Figure 3
Figure 3
TME characteristics in distinct m6A modification patterns. (A) Unsupervised clustering of 23 m6A regulators in the meta-GEO CC cohort. Clinicopathological information including age, gender, and tumor stage, as well as the m6A cluster, is shown in annotations above. Red represented the high expression of regulators and blue represented the low expression. (B) The fraction of tumor-infiltrating lymphocyte cells in three m6A clusters using the CIBERSORT algorithm. Within each group, the scattered dots represented TME cell expression values. The thick line represented the median value. The bottom and top of the boxes were the 25th and 75th percentiles (interquartile range). The whiskers encompassed 1.5 times the interquartile range. The statistical difference of three gene clusters was compared through the Kruskal-Wallis H test. *P < 0.05; **P < 0.01; ***P < 0.001. (C) The immune score and tumor purity of three gene clusters were analyzed and plotted. (D) The proportion of molecular subtypes in the three modification patterns. (E) Comparison of PD-L1 expression level across three m6A modification patterns.
Figure 4
Figure 4
Construction of differential expression of m6A gene signatures and functional annotation. (A) 524 m6A-related differentially expressed genes (DEGs) between three m6A-clusters were shown in the Venn diagram. (B) Functional annotation for m6A-related genes using GO enrichment analysis. The color depth of the barplots represented the number of genes enriched. (C) Unsupervised clustering of overlapping m6A phenotype-related DEGs to classify patients into different genomic subtypes, termed as m6A gene S1-3, respectively. The gene signature subtypes, m6A clusters, molecular subtypes, tumor stage, gender, and age were used as patient annotations. (D) The survival curves of the m6A phenotype-related gene signatures were estimated by the Kaplan-Meier plotter. (P = 0.015, Log-rank test). (E) Subgroup analysis estimating clinical prognostic value between m6A gene signature in independent CC data sets and cancer stage by univariate Cox regression. The length of the horizontal line represented the 95% confidence interval for each group. The vertical dotted line represented the hazard ratio (HR) of all patients.
Figure 5
Figure 5
Construction of m6Sig score and explore the relevance of clinical features. (A) Alluvial diagram of m6A clusters in groups with different molecular subtypes (CIN, CSC, dMMR and KRASm), m6A-gene cluster, and m6Sig score. (B) Correlations between m6Sig score and the known biological gene signatures using Spearman analysis. The negative correlation was marked with blue and positive correlation with red. (C) Kaplan-Meier curves for high and low m6Sig score patient groups in CIT cohort. Log-rank test, P < 0.001. (D) Distribution of m6Sig score in the different molecular subtypes. The thick line represented the median value. The bottom and top of the boxes were the 25th and 75th percentiles (interquartile range). The whiskers encompassed 1.5 times the interquartile range. The differences between every two groups were compared through the Kruskal-Wallis H test. (E) Relative distribution of PD-L1 expression in high m6Sig score versus low m6Sig score subgroups. (F) Kaplan-Meier curves for patients with high and low m6Sig score subgroups in the TCGA cohort. (G) Violin plot showing m6Sig score in groups with high or low MSI and stable status. The differences between the four groups were compared through the Kruskal-Wallis test. MSS, microsatellite stable; MSI-H, high microsatellite instability; MSI-L, low microsatellite instability. (H-I) Relative distribution of tumor mutation load (H) and somatic copy number alternation (I) in m6Sig score high versus low subgroups. (J) Mutational landscape of SMGs in TCGA-COAD stratified by low (left panel) versus high m6Sig score (right panel) subgroups. Individual patients were represented in each column. The upper barplot showed TML, the right bar plot showed the mutation frequency of each gene in separate m6Sig score groups. m6A cluster, stage, gender, MSI status, and mutational signatures were shown as patient annotations.
Figure 6
Figure 6
The m6Sig score predicts immunotherapeutic benefits. (A-D) The relative distribution of TIDE was compared between m6Sig score high versus low groups in TCGA-COAD (A) and CIT (B) cohort, respectively. The relative distribution of IPS was also compared between m6Sig score high and low groups in TCGA-COAD (C) and CIT (D) cohort. (E) Kaplan-Meier curves for high and low m6Sig score patient groups in the Riaz et al. cohort. Log-rank test, P = 0.030. (F) The fraction of patients with clinical response to anti-PD-1 immunotherapy (Riaz et al. cohort) in low or high m6Sig score groups. CR/PR vs. SD/PD: 39% vs. 61% in the low m6Sig score groups, 11% vs. 89% in the high m6Sig score groups. (G) Kaplan-Meier curves for high and low m6Sig score patient groups in the Vanallen et al. cohort. Log-rank test, P = 0.032. (H) The fraction of patients with clinical response to anti-CTLA-4 immunotherapy in low or high m6Sig score groups of Vanallen et al. cohort. CR/SD vs. PD: 42% vs. 58% in the low m6Sig score groups and 25% vs. 75% in the high m6Sig score groups. CR, complete response; PR, partial response; SD, stable disease; PD, progressive disease.

References

    1. Zhao BS, Roundtree IA, He C. Post-transcriptional gene regulation by mRNA modifications. Nat Rev Mol Cell Biol. 2017;18:31–42. - PMC - PubMed
    1. Zaccara S, Ries RJ, Jaffrey SR. Reading, writing and erasing mRNA methylation. Nat Rev Mol Cell Biol. 2019;20:608–24. - PubMed
    1. He L, Li H, Wu A, Peng Y, Shu G, Yin G. Functions of N6-methyladenosine and its role in cancer. Mol Cancer. 2019;18:176. - PMC - PubMed
    1. Li XC, Jin F, Wang BY, Yin XJ, Hong W, Tian FJ. The m6A demethylase ALKBH5 controls trophoblast invasion at the maternal-fetal interface by regulating the stability of CYR61 mRNA. Theranostics. 2019;9:3853–65. - PMC - PubMed
    1. Chen Z, Wu L, Zhou J, Lin X, Peng Y, Ge L. et al. N6-methyladenosine-induced ERRgamma triggers chemoresistance of cancer cells through upregulation of ABCB1 and metabolic reprogramming. Theranostics. 2020;10:3382–96. - PMC - PubMed

Publication types

MeSH terms