. 2021 Jan 1;11(5):2381-2394.
doi: 10.7150/thno.47627. eCollection 2021.

Multi-omics study of silicosis reveals the potential therapeutic targets PGD2 and TXA2

Affiliations

Multi-omics study of silicosis reveals the potential therapeutic targets PGD2 and TXA2

Junling Pang et al. Theranostics. .

Abstract

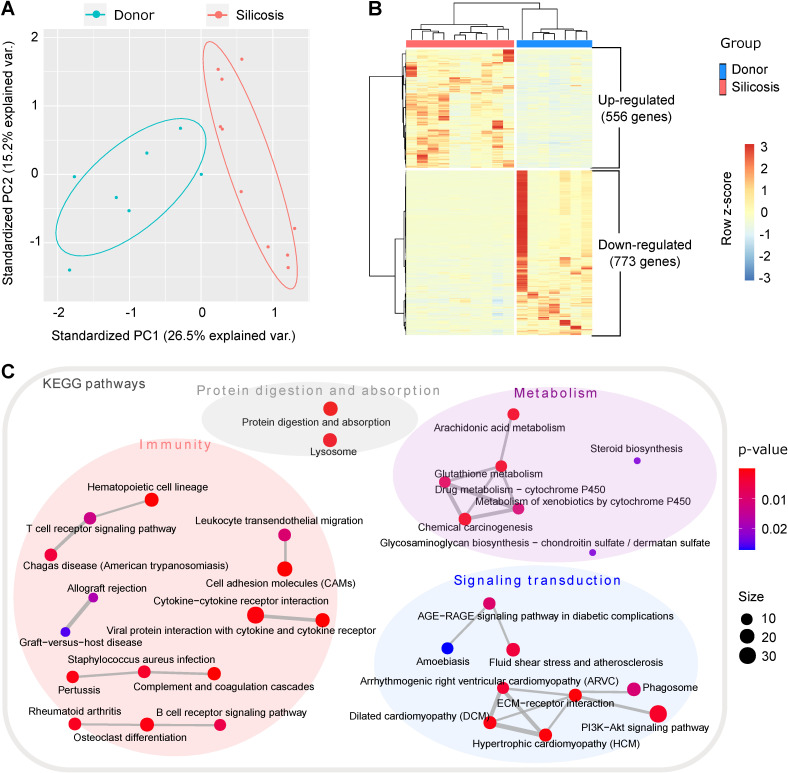
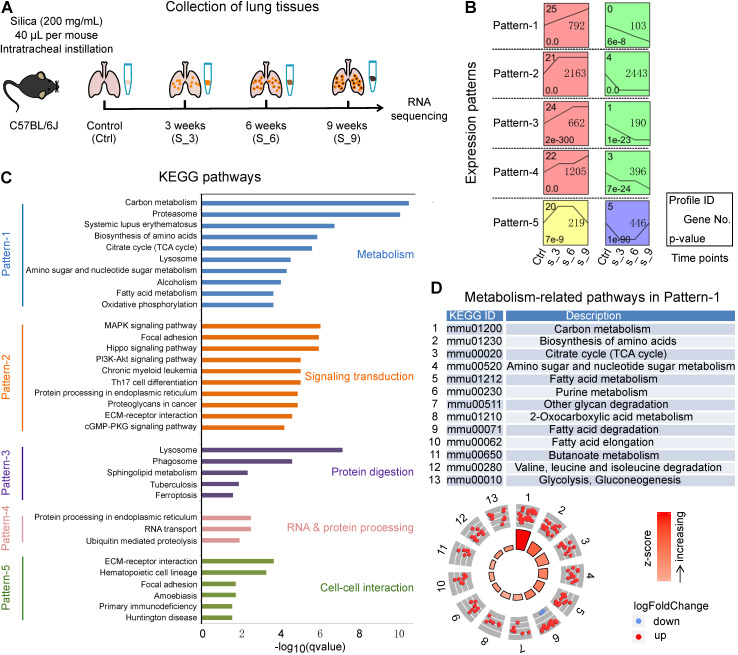
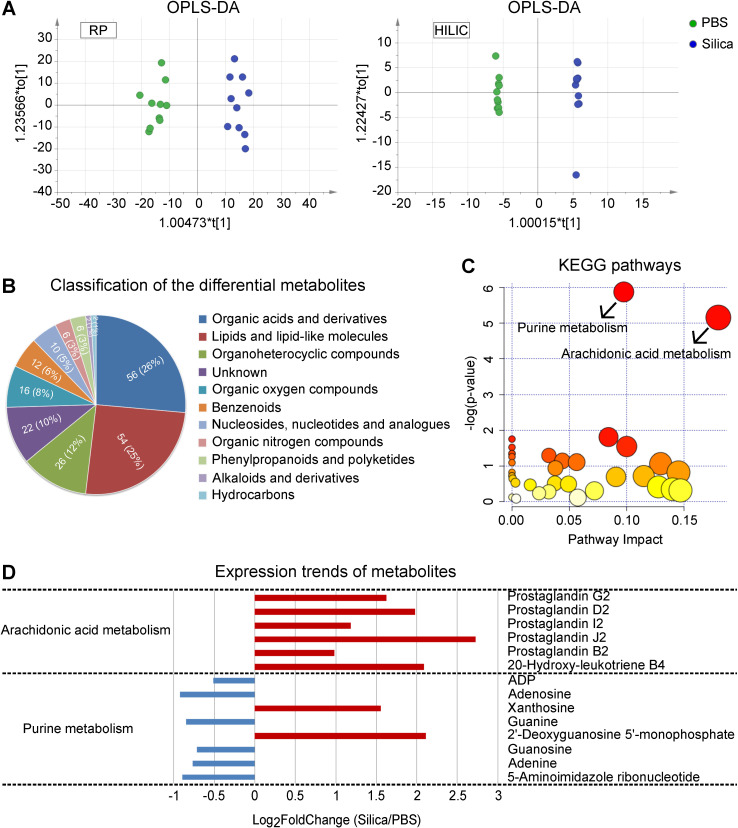
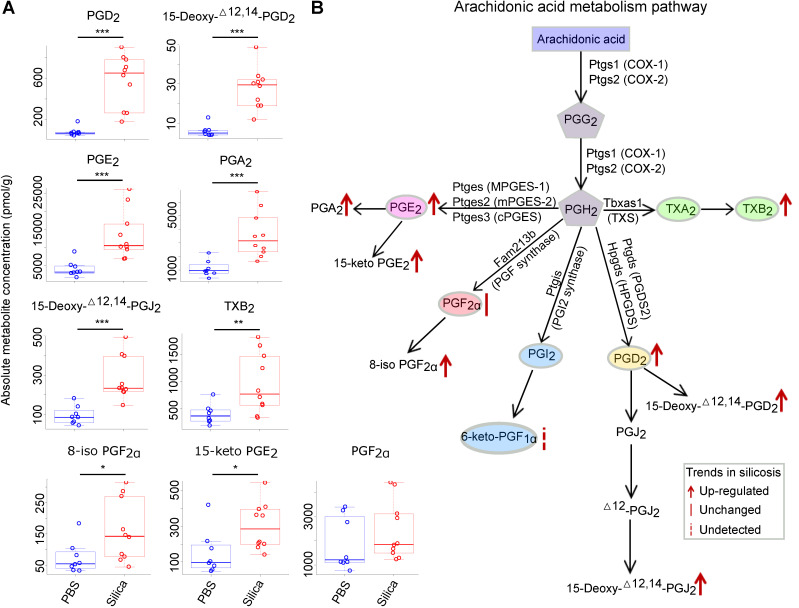
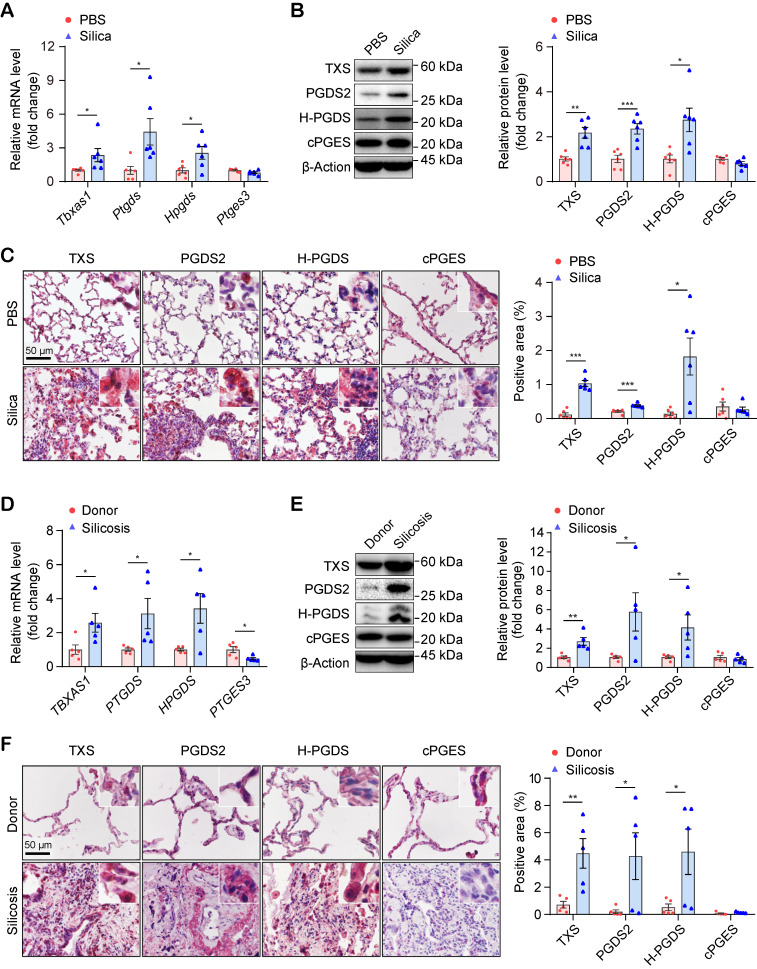
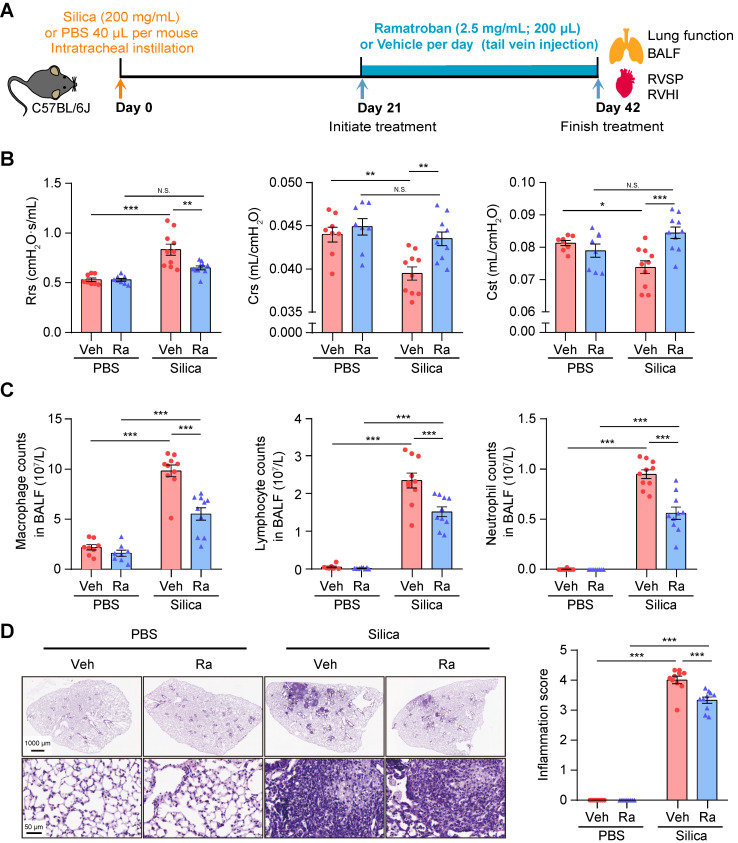
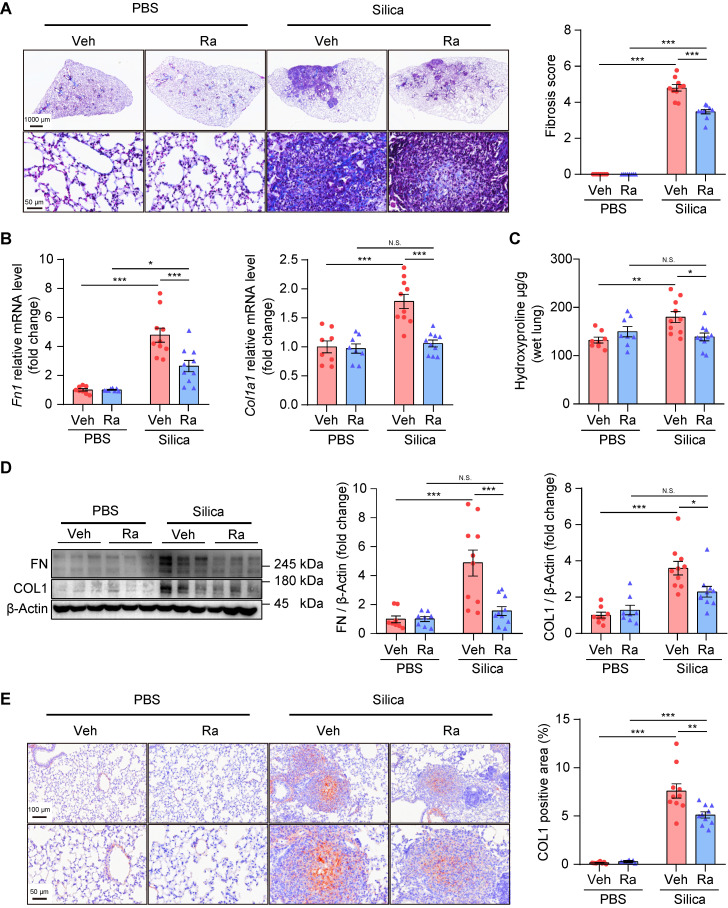
Rationale: Silicosis is a severe occupational lung disease. Current treatments for silicosis have highly limited availability (i.e., lung transplantation) or, do not effectively prolong patient survival time (i.e., lung lavage). There is thus an urgent clinical need for effective drugs to retard the progression of silicosis. Methods: To systematically characterize the molecular changes associated with silicosis and to discover potential therapeutic targets, we conducted a transcriptomics analysis of human lung tissues acquired during transplantation, which was integrated with transcriptomics and metabolomics analyses of silicosis mouse lungs. The results from the multi-omics analyses were then verified by qPCR, western blot, and immunohistochemistry. The effect of Ramatroban on the progression of silicosis was evaluated in a silica-induced mouse model. Results: Wide metabolic alterations were found in lungs from both human patients and mice with silicosis. Targeted metabolite quantification and validation of expression of their synthases revealed that arachidonic acid (AA) pathway metabolites, prostaglandin D2 (PGD2) and thromboxane A2 (TXA2), were significantly up-regulated in silicosis lungs. We further examined the effect of Ramatroban, a clinical antagonist of both PGD2 and TXA2 receptors, on treating silicosis using a mouse model. The results showed that Ramatroban significantly alleviated silica-induced pulmonary inflammation, fibrosis, and cardiopulmonary dysfunction compared with the control group. Conclusion: Our results revealed the importance of AA metabolic reprogramming, especially PGD2 and TXA2 in the progression of silicosis. By blocking the receptors of these two prostanoids, Ramatroban may be a novel potential therapeutic drug to inhibit the progression of silicosis.

Keywords: PGD2; Ramatroban; TXA2; multi-omics; silicosis.


Conflict of interest statement

Competing Interests: The authors have declared that no competing interest exists.

Figures

Figure 1
Figure 1
Transcriptomics analysis of lungs from silicosis patients and healthy donors. (A) Principal component analysis of the samples. The red dots indicate lung samples from silicosis patients (n = 10) and the blue dots represent lung samples from healthy donors (n = 7). (B) Heatmap showing the differentially expressed genes between silicosis and healthy lungs. Each column represents a sample and each row a gene. The expression of genes was scaled using z-score. (C) Significantly enriched KEGG items of the differential genes. Four super classes were highlighted based on the nature of the pathways. KEGG, kyoto encyclopedia of genes and genomes.
Figure 2
Figure 2
A time-course transcriptional analysis using mouse lungs from silicosis models. (A) Sketch map of the time points to collect lung tissues for RNA sequencing. Mice instilled with PBS for 3 weeks were used as control. Lung tissues from control (Ctrl) along with the silica group at 3, 6 and 9 weeks were collected for RNA sequencing. (B) Significant gene expression patterns identified by the STEM method. The x-axis represents the time points during the model construction, and all the expression patterns follow the lines of Control (Ctrl), Silica 3 weeks (S_3), Silica 6 weeks (S_6) and Silica 9 weeks (S_9). (C) The KEGG enrichment results of the five patterns in (B). For each pattern, only the top ten (if there were) significant items were shown, and five different colors represent the five patterns separately. (D) All the metabolism-related KEGG pathways enriched for Pattern-1. The dots in the outer circle represent the genes in each item, of which the red color highlight the genes up-regulated in silicosis while the blue down-regulated genes. The color bars in the center circle display the z-score, a crude measure of genes' activity in each item. The higher z-score means more up-regulated genes in that item. STEM, short time-series expression miner; KEGG, kyoto encyclopedia of genes and genomes.
Figure 3
Figure 3
LC-MS-based untargeted metabolomics using silicosis mouse lungs. (A) OPLS-DA of the samples. The green color represents the PBS group (n = 10), while the blue color Silica group (n = 10). Compounds that were selected through RP and HILIC were analyzed separately. (B) Classification of the 212 significantly altered metabolites between PBS and Silica groups. Each color displays a class of metabolites, with the specific number and percentage highlighted in the middle of the pie. (C) KEGG pathway enrichment of the 212 differential metabolites. The two significant pathways with a p < 0.05 were highlighted with their names. (D) The expression trends of the metabolites included in the two significant pathways. The x-axis shows the log2 transformed fold change of the relative metabolite level in the Silica group compared to the PBS group. LC-MS, liquid chromatography-tandem mass spectrometry; OPLS-DA, orthogonal partial least squares discriminant analysis; PBS, phosphate-buffered saline; RP, reversed-phase; HILIC, hydrophilic interaction liquid chromatography; KEGG, kyoto encyclopedia of genes and genomes.
Figure 4
Figure 4
Targeted metabolomics analysis of the arachidonic acid metabolism pathway using silicosis mouse lungs. (A) The absolute metabolite concentration of prostanoids and derivates in both PBS and Silica groups. The comparison between groups was analyzed using the two-tailed unpaired Student's t-test. *: p < 0.05; **: p < 0.01; ***: p < 0.001 are representative for the differences of the Silica group (n = 10) as compared to the PBS group (n = 8). (B) The diagram of arachidonic acid metabolism pathway and the metabolic changes in silicosis. PBS, phosphate-buffered saline.
Figure 5
Figure 5
Expressional validation of the synthases of PGD2 and TXA2 in the lungs of silicosis mice and human patients. (A) Relative mRNA expression levels of the genes (Tbxas1, Ptgds, Hpgds, and Ptges3) in the lung tissues of mice instilled with silica or PBS. (B) Representative western blotting images and quantification of proteins (TXS, PGDS2, H-PGDS, and cPGES) in the lung tissues of mice instilled with silica or PBS. (C) Representative images of immunohistochemical staining and quantification of immunoreactivity of TXS, PGDS2, H-PGDS, and cPGES in lung sections from the Silica or PBS group. Red-brown indicates the positive staining. All scale bars are 50 μm. (D) Relative mRNA expression levels of the genes (TBXAS1, PTGDS, HPGDS, and PTGES3) in the lung tissues from silicosis patients or healthy donors. (E) Representative western blotting images and quantification of protein (TXS, PGDS2, H-PGDS, and cPGES) in lung tissues from silicosis patients or healthy donors. (F) Representative images of immunohistochemical staining and quantification of immunoreactivity of TXS, PGDS2, H-PGDS, and cPGES in lung sections from silicosis patients or healthy donors. Red-brown indicates the positive staining. All scale bars are 50 μm. All the above experiments were performed at least three times. Quantitative analysis results are presented as mean ± SEM, and the differences were analyzed by using the two-tailed unpaired Student's t-test. *: p < 0.05, **: p < 0.01, and ***: p < 0.001 in A, B, C are representative for the differences from the Silica group (n = 6 each group) versus the PBS group (n = 6 each group), and in D, E, F are representative for the differences from the Silicosis group (n = 5 each group) versus the donor group (n = 5 each group). PGD2, prostaglandin D2; TXA2, thromboxane A2; PBS, phosphate-buffered saline.
Figure 6
Figure 6
Ramatroban treatment improved pulmonary function and inflammation in silicosis mice. (A) Schematic diagram of Ramatroban treatment on silicosis mice. (B) Measurements of parameters of pulmonary function, including Rrs, Crs, and Cst. (C) Counts of inflammatory cells (macrophages, lymphocytes, and neutrophils) in BALF. (D) Representative images of hematoxylin-eosin staining and quantification of pulmonary inflammation. Upper scale bar indicates 1000 μm, and lower scale bar indicates 50 μm. All the above experiments were performed at least three times. All the quantitative results are presented as mean ± SEM. The differences were analyzed by a two-way ANOVA and followed by Bonferroni adjustment. N.S.: no significance; *: p < 0.05, **: p < 0.01, and ***: p < 0.001. PBS group: n = 8 each group; Silica group: n = 10 each group. PBS, phosphate-buffered saline; BALF, bronchoalveolar lavage fluid; RVSP, right ventricular systolic pressure; RVHI, right ventricular hypertrophy index; Veh: vehicle; Ra: Ramatroban; Rrs, resistance; Crs, compliance of the respiratory system; Cst, quasi-static lung compliance.
Figure 7
Figure 7
Ramatroban treatment alleviated pulmonary fibrosis in silicosis mice. (A) Representative images of Masson staining and quantification of pulmonary fibrosis. Upper scale bar indicates 1000 μm, while lower scale bar indicates 50 μm. (B) Relative mRNA expression levels of Fn1 and Col1a1. (C) Hydroxyproline levels evaluated from mouse lungs. (D) Representative western blotting images and quantification of FN and COL1. (E) Representative images of immunohistochemical staining and quantification of immunoreactivity of COL1 in lung sections. Red-brown indicates the positive staining. Upper scale bar indicates 100 μm, and lower scale bar indicates 50 μm. All the above experiments were performed at least three times. All the quantitative results are shown as mean ± SEM. The differences were calculated by a two-way ANOVA and followed by Bonferroni adjustment. N.S.: no significance; *: p < 0.05, **: p < 0.01, and ***: p < 0.001. Mouse lung tissues are from the Silica group (n = 10) or the PBS group (n = 8) following Ramatroban (Ra) or vehicle (Veh) treatment. Fn or FN, fibronectin; Col or COL, collagen; PBS, phosphate-buffered saline.

References

    1. Hoy RF, Chambers DC. Silica-related diseases in the modern world. Allergy, in press. doi:10.1111/ALL.14202. - PubMed
    1. Barnes H, Goh NSL, Leong TL, Hoy R. Silica-associated lung disease: an old-world exposure in modern industries. Respirology. 2019;24:1165–75. - PubMed
    1. Rose C, Heinzerling A, Patel K, Sack C, Wolff J, Zell-Baran L. et al. Severe silicosis in engineered stone fabrication workers — California, Colorado, Texas, and Washington, 2017-2019. MMWR Morb Mortal Wkly Rep. 2019;68:813–8. - PMC - PubMed
    1. Odintseva OV, Semenikhin VA, Lee GA. Total broncho-alveolar lavage in respiratory diseases among coal mining workers. Med Tr Prom Ekol. 2015;5:25–9. - PubMed
    1. Fujimura N. Pathology and pathophysiology of pneumoconiosis. Curr Opin Pulm Med. 2000;6:140–4. - PubMed

Publication types