. 2021 Jan 1;11(5):2442-2459.
doi: 10.7150/thno.46460. eCollection 2021.

Cisplatin prevents breast cancer metastasis through blocking early EMT and retards cancer growth together with paclitaxel

Affiliations

Cisplatin prevents breast cancer metastasis through blocking early EMT and retards cancer growth together with paclitaxel

Haitao Wang et al. Theranostics. .

Abstract

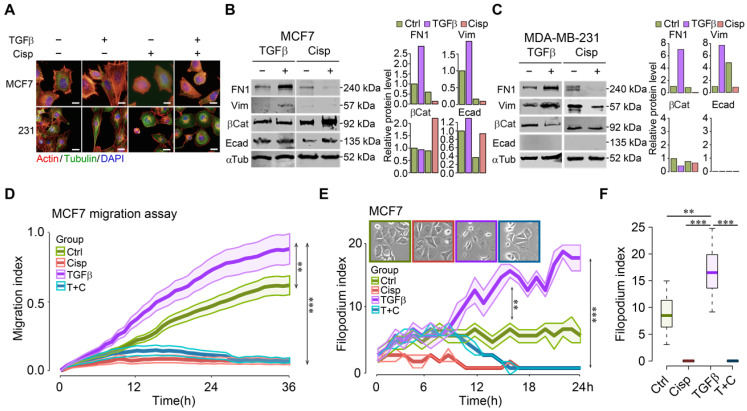
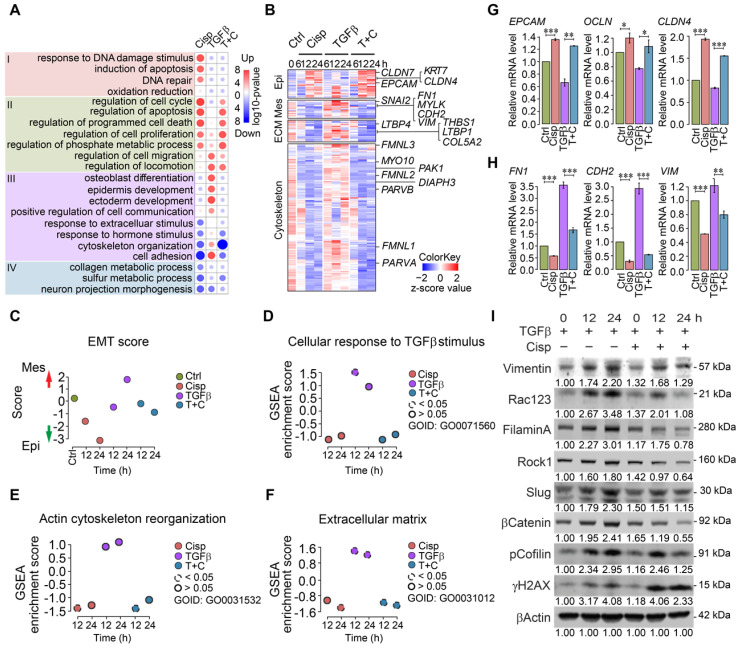
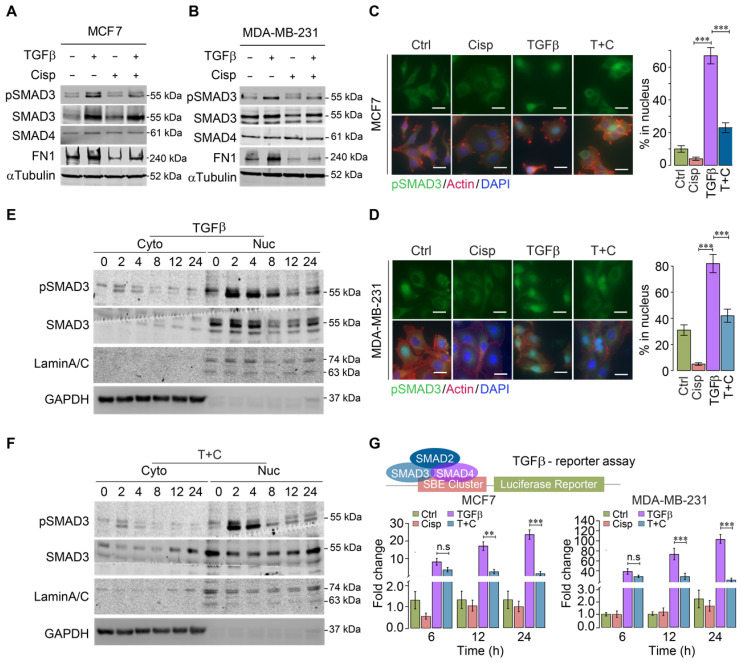
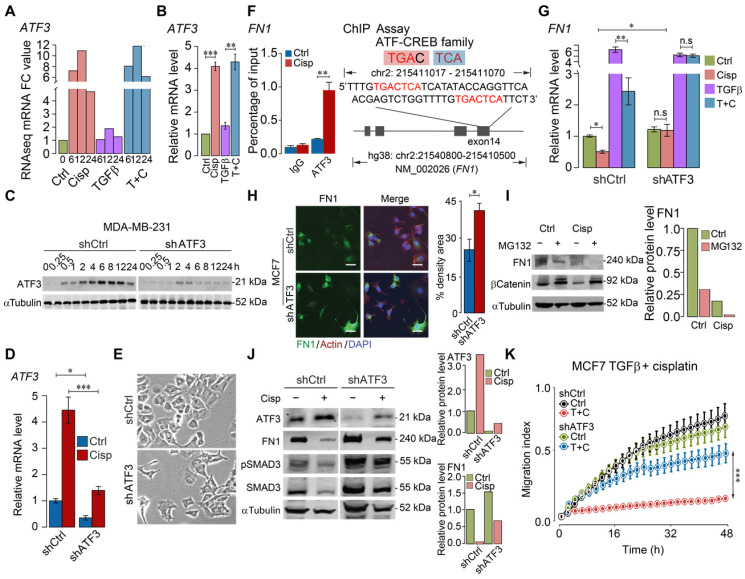
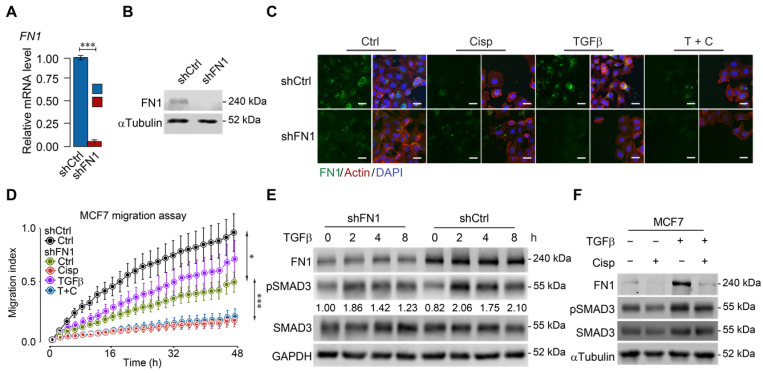
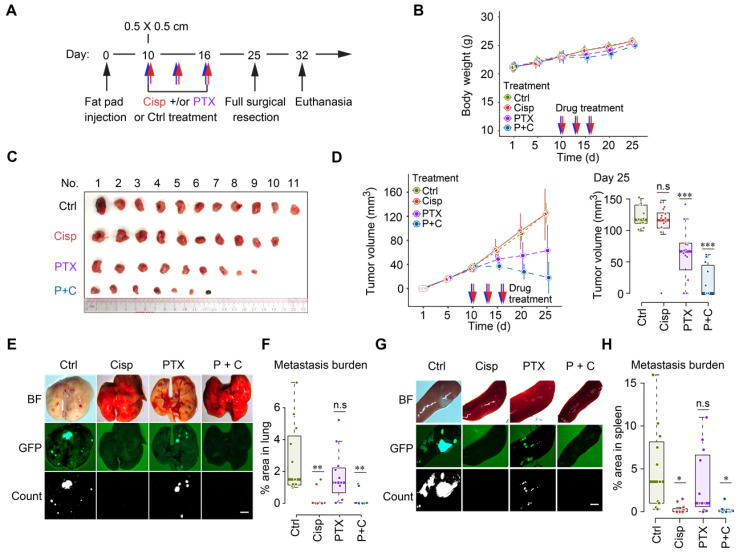
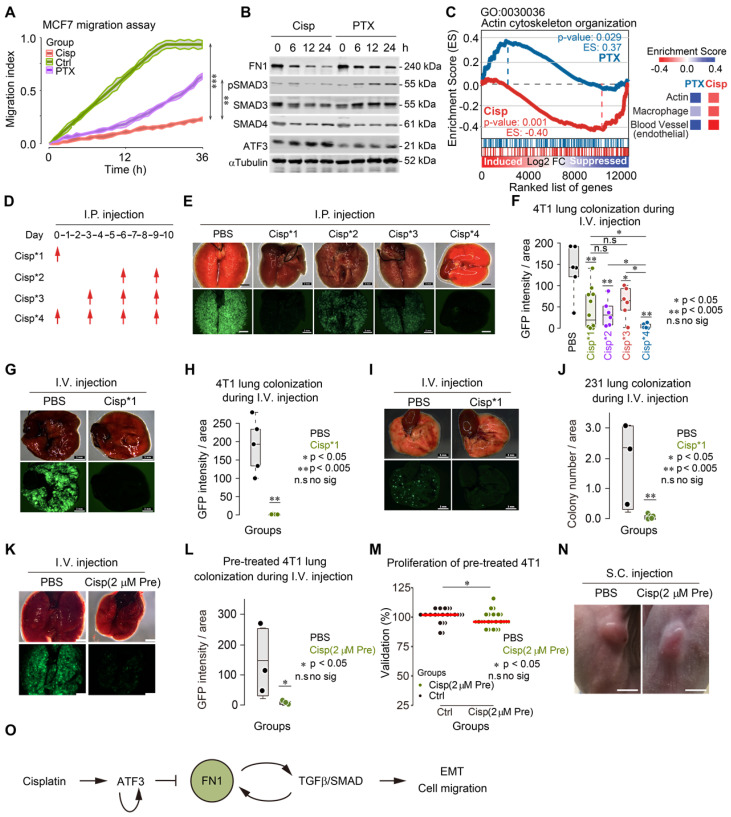
Cancer growth is usually accompanied by metastasis which kills most cancer patients. Here we aim to study the effect of cisplatin at different doses on breast cancer growth and metastasis. Methods: We used cisplatin to treat breast cancer cells, then detected the migration of cells and the changes of epithelial-mesenchymal transition (EMT) markers by migration assay, Western blot, and immunofluorescent staining. Next, we analyzed the changes of RNA expression of genes by RNA-seq and confirmed the binding of activating transcription factor 3 (ATF3) to cytoskeleton related genes by ChIP-seq. Thereafter, we combined cisplatin and paclitaxel in a neoadjuvant setting to treat xenograft mouse models. Furthermore, we analyzed the association of disease prognosis with cytoskeletal genes and ATF3 by clinical data analysis. Results: When administered at a higher dose (6 mg/kg), cisplatin inhibits both cancer growth and metastasis, yet with strong side effects, whereas a lower dose (2 mg/kg) cisplatin blocks cancer metastasis without obvious killing effects. Cisplatin inhibits cancer metastasis through blocking early steps of EMT. It antagonizes transforming growth factor beta (TGFβ) signaling through suppressing transcription of many genes involved in cytoskeleton reorganization and filopodia formation which occur early in EMT and are responsible for cancer metastasis. Mechanistically, TGFβ and fibronectin-1 (FN1) constitute a positive reciprocal regulation loop that is critical for activating TGFβ/SMAD3 signaling, which is repressed by cisplatin induced expression of ATF3. Furthermore, neoadjuvant administration of cisplatin at 2 mg/kg in conjunction with paclitaxel inhibits cancer growth and blocks metastasis without causing obvious side effects by inhibiting colonization of cancer cells in the target organs. Conclusion: Thus, cisplatin prevents breast cancer metastasis through blocking early EMT, and the combination of cisplatin and paclitaxel represents a promising therapy for killing breast cancer and blocking tumor metastasis.

Keywords: TGFβ; cisplatin; metastasis; neoadjuvant therapy; paclitaxel.


Conflict of interest statement

Competing Interests: The authors have declared that no competing interest exists.

Figures

Figure 1
Figure 1
Cisplatin antagonizes TGFβ-induced EMT and cell movement of breast cancer cells. A TGFβ induces EMT in MCF7 and MDA-MB-231 cells, which is counteracted by cisplatin. Filamentous actin was stained by 1:1000 phalloidin. Bar = 50 μm. B, C TGFβ and cisplatin induce expression changes of mesenchymal and epithelial markers triggered in opposite directions revealed by Western blot. Quantification of FN1, Vimentin, β-catenin and E-cadherin levels were shown on the right panels. D TGFβ enhances cell migration as compared to control cells whereas cisplatin not only inhibits cell migration, but also overrides the stimulatory effect of TGFβ in MCF7 cells. E, F Calculation of filopodium index during a 24-h time lapse (E) and at 24h point (F) reveals that TGFβ significantly increases filopodium formation as compared to control, whereas cisplatin completely blocks filopodium formation in either cisplatin or cisplatin/TGFβ treatment conditions in MCF7 cells. Insert in E shows MCF7 cell morphology at 24h point. In (D-F), data represent means ± standard deviations (SDs). See also Figure S1, Figure S2 and Figure S3. Concentration of drugs in this figure: TGFβ [5 ng/mL] cisplatin [10 μM]. Immunoblots shown in this figure have 3 replicates. ns, *, ** and *** means not significant, p < 0.05, p < 0.005, and p < 0.0005, respectively.
Figure 2
Figure 2
Analysis of gene expression of MCF7 and MDA-MB-231 cells at different time points after treatment with TGFβ and/or cisplatin. A Heatmap of overall gene expression in cisplatin and/or TGFβ treated MCF7 cells. B Illustration of expression changes of genes involved in epithelial and mesenchymal signatures, ECM function as well as cytoskeleton rearrangement induced by cisplatin and/or TGFβ treatment in MCF7 cells. C-F Calculation of EMT score (C), GSEA gene enrichment score of TGFβ responding genes (D), actin cytoskeleton reorganization (E), and extracellular matrix (F) in MCF7 cells after single or combined treatment with TGFβ and cisplatin. G, H RT-qPCR validation of selected epithelial (G), and mesenchymal (H) marker genes after cisplatin and TGFβ treatment in MCF7 cells. I Western blot analysis of mesenchymal marker genes that are induced by TGFβ and inhibited by cisplatin in MDA-MB-231 cells. Quantifications of each proteins are shown under each band. Replicate = 3. In (G, H), data represent means ± standard deviations (SDs). See also Figure S4. Concentration of drugs in this figure: TGFβ [5 ng/mL] cisplatin [10 μM]. ns, *, ** and *** means not significant, p < 0.05, p < 0.005, and p < 0.0005, respectively.
Figure 3
Figure 3
Effect of cisplatin on TGFβ/SMAD3 signaling. A, B Effect of cisplatin on pSMAD3 revealed by Western blot analysis for MDA-MB-231 (A) and MCF7 (B) cells. C, D Effect of cisplatin on nuclear pSMAD3 revealed by immunofluorescent staining of MDA-MB-231 (C) and MCF7 (D) cells. The quantification of ratio of pSMAD3 in nucleus were shown on the right panel. Bar = 50 μm. E, F Effect of cisplatin on TGFβ mediated SMAD3 phosphorylation (pSMAD3) revealed by Western blot of cell lysates from cytoplasm (E) and nucleus (F) during a time course from 0 to 24 h after cisplatin and/or TGFβ treatment. G Effect of cisplatin and/or TGFβ treatment of an SBE-luciferase reporter in MCF7 and MDA-MB-231 cells 48 h after the treatment. In (C, D and G), data represent means ± standard deviations (SDs). Concentration of drugs in this figure: TGFβ [5 ng/mL] cisplatin [10 μM]. Immunoblots shown in this figure have 3 replicates. ns, *, ** and *** means not significant, p < 0.05, p < 0.005, and p < 0.0005, respectively.
Figure 4
Figure 4
ATF3 stimulation by cisplatin suppresses FN1 transcription and hence compromises cell migration. A, B ATF3 expression was significantly induced by cisplatin but not affected by TGFβ revealed by RNA-seq (A) and confirmed by RT-qPCR (B) in MDA-MB-231 cells, FC (Fold Change). C-E Cisplatin induces ATF3 expression, which was diminished in ATF3-KD cells at protein (C) and RNA (D) levels. Also, ATF3-KD cells prevailed spindle cell phenotype (E). F ChIP-seq showed that ATF3 binds to exon 14 of FN1, which is enhanced by cisplatin treatment. The binding site was shown on the right panel. G Cisplatin reduces FN1 expression in both control and TGFβ treated cells, which is blocked by the knockdown of ATF3. H Knockdown of ATF3 increased FN1 expression revealed in immunofluorescent staining of FN1 and merged with Actin and DAPI. Quantification of FN1 levels was shown on the right panel. Bar = 50 μm. I Western blot analysis of FN1 expression under ubiquitin-proteasome inhibitor, MG132, to determine if FN degradation requires proteasome-mediated protein degradation in control cells and cisplatin treated cells. J Cisplatin induces ATF3, reduces FN1 and pSMAD3, which is attenuated by knockdown of ATF3. Quantification of ATF3 and FN1 levels was shown on the right panels. K ATF3 knockdown did not affect cell migration but significantly attenuated inhibition of cisplatin on cell migration induced by TGFβ treatment. In (B, D, F, G, H and K), data represent means ± standard deviations (SDs). See also Figure S5. Concentration of drugs in this figure: TGFβ [5 ng/mL] cisplatin [10 μM]. Immunoblots shown in this figure have 3 replicates. ns, *, ** and *** means not significant, p < 0.05, p < 0.005, and p < 0.0005, respectively.
Figure 5
Figure 5
ATF3 stimulation by cisplatin suppresses FN1 transcription and hence compromises cell migration. A, B Confirmation of FN1 knockdown by shRNA using RT-qPCR (A) and Western blot (B) in MCF7 cells. C Expression and distribution of FN1 under TGFβ, cisplatin or combined treatment showed by immunofluorescent staining. FN1 knockdown cells mimic the morphology of cisplatin-treated MCF7 cells. Bar = 50 μm. D FN1 knockdown inhibits migration of MCF7 cells under cisplatin addition to TGFβ treatment. E FN1 knockdown reduces SMAD3 phosphorylation in both conditions with/without TGFβ-treatment by Western blot. The ratios of pSMAD3/SMAD3 are shown under the band of pSMAD3. F TGFβ induces expression of FN1 and pSMAD3 in MCF7 cells, which is inhibited by cisplatin treatment. In (A and D), data represent means ± standard deviations (SDs). Concentration of drugs in this figure: TGFβ [5 ng/mL] cisplatin [10 μM]. Immunoblots shown in this figure have 3 replicates. ns, *, ** and *** means not significant, p < 0.05, p < 0.005, and p < 0.0005, respectively.
Figure 6
Figure 6
Cisplatin blocks cancer metastasis in a neoadjuvant setting in nude mice. A A procedure of allograft of 4T1 cells by implanting them into the mammary fat pad of BALB/c mice followed by treatment with low dosage of cisplatin [2 mg/kg] and/or paclitaxel [18 mg/kg] at the time point indicated. B Body weights of control and cisplatin treated mice during the 25 days experiment period. C, D Volumes, and sizes of tumors during 25 days of the treatment with cisplatin and/or paclitaxel. Quantification of tumor volumes of different groups in day 25 were shown on the right panels (D). E-H Measurement of metastasis of tumors to lungs (E, F) and spleens (G, H) at 25 days under different treatment conditions as indicated, BF (Bright Field). GFP intensities were measured and quantified in (F, H). * indicates p < 0.05 and ** indicates p < 0.01 in relation to controls. Bar = 3 mm. In (B, D, F and H), data represent means ± standard deviations (SDs). See also Figure S6. ns, *, ** and *** means not significant, p < 0.05, p < 0.005, and p < 0.0005, respectively.
Figure 7
Figure 7
Cisplatin blocks cancer metastasis through inhibiting early colonization. A The effects of cisplatin and paclitaxel on MCF7 cell migration were compared with control group. B Western blot shows the effects of cisplatin and paclitaxel on expression of FN1, ATF3, SMAD3, SMAD4 and phosphorylation of SMAD3 in a 24-h time lapse. Concentration of drugs: Cisplatin [10 μM] PTX [5 μM]. Replicate = 3. C GSEA enrichment score of actin cytoskeleton organization (GO: 0030036) are different under cisplatin and paclitaxel treatments. Comparison of enrichment scores of actin, macrophage, and blood vessel under two treatments were shown on the right panel. D A procedure of tail vein injection (i.v.) of pre-trained tumor cells and intraperitoneal injection (i.p.) of cisplatin. Pre-trained breast tumor cells were injected through i.v. into each mouse at day 0. Then, cisplatin or PBS were injected through i.p. depending on the designing of each group. All the mice were killed at day 10. E, G and I Images of colonized lungs by pre-trained 4T1 cells and pre-trained MDA-MB-231 cells (these cells have lower colonization ability compared with pre-trained 4T1 cells) after cisplatin treatments by dissection. The upper panel are the bright viewed images of colonized lungs while the lower panel are the immunofluorescent images showing GFP signals. Bar = 3 mm. F Summary and comparison of GFP intensity/area of colonized lungs by pre-trained 4T1 cells. The intensity of GFP and the area of each lobby of all groups were analyzed by ImageJ. H, J Summary, and comparison of GFP intensity (or number of colonization)/areas of colonized lungs by pre-trained 4T1/pre-trained MDA-MB-231 cells in PBS and cisplatin injected (only at first time through i.v.) groups. K Images of colonized lungs by pre-trained 4T1 cells with/without cisplatin [2 μM] pre-treatment by dissection. Bar = 3 mm. L Summary and comparison of number of GFP puncta of colonized lungs by pre-trained 4T1 cells with/without cisplatin [2 μM] pre-treatment (i.v.) groups. M Comparison of effects of PBS and cisplatin [2 μM] pre-treatment on proliferation. N Images of tumors formed by PBS and cisplatin pre-treated 4T1 cells by subcutaneous (s.c.) injection. Bar = 5 mm. O Summary of the mechanism of cisplatin inhibition on cell migration/cancer metastasis through ATF3, which regulates the positive reciprocal loop among FN1, TGFβ/SMAD. In (A, F, H, J, L and M), data represent means ± standard deviations (SDs). ns, *, ** and *** means not significant, p < 0.05, p < 0.005, and p < 0.0005, respectively.

References

    1. Alizadeh AM, Shiri S, Farsinejad S. Metastasis review: from bench to bedside. Tumour Biol. 2014;35:8483–523. - PubMed
    1. Li C, Balazsi G. A landscape view on the interplay between EMT and cancer metastasis. NPJ Syst Biol Appl. 2018;4:34. - PMC - PubMed
    1. Hanahan D, Weinberg RA. Hallmarks of cancer: the next generation. Cell. 2011;144:646–74. - PubMed
    1. Brabletz T, Lyden D, Steeg PS, Werb Z. Roadblocks to translational advances on metastasis research. Nat Med. 2013;19:1104–9. - PMC - PubMed
    1. Hao Y, Baker D, Ten Dijke P. TGF-beta-Mediated Epithelial-Mesenchymal Transition and Cancer Metastasis. Int J Mol Sci. 2019. 20. - PMC - PubMed

Publication types

MeSH terms