[Preprint]. 2021 Jan 20:2021.01.19.427330.
doi: 10.1101/2021.01.19.427330.

Temporal dynamics of SARS-CoV-2 mutation accumulation within and across infected hosts

Affiliations

Temporal dynamics of SARS-CoV-2 mutation accumulation within and across infected hosts

Andrew L Valesano et al. bioRxiv. .

Update in

Abstract

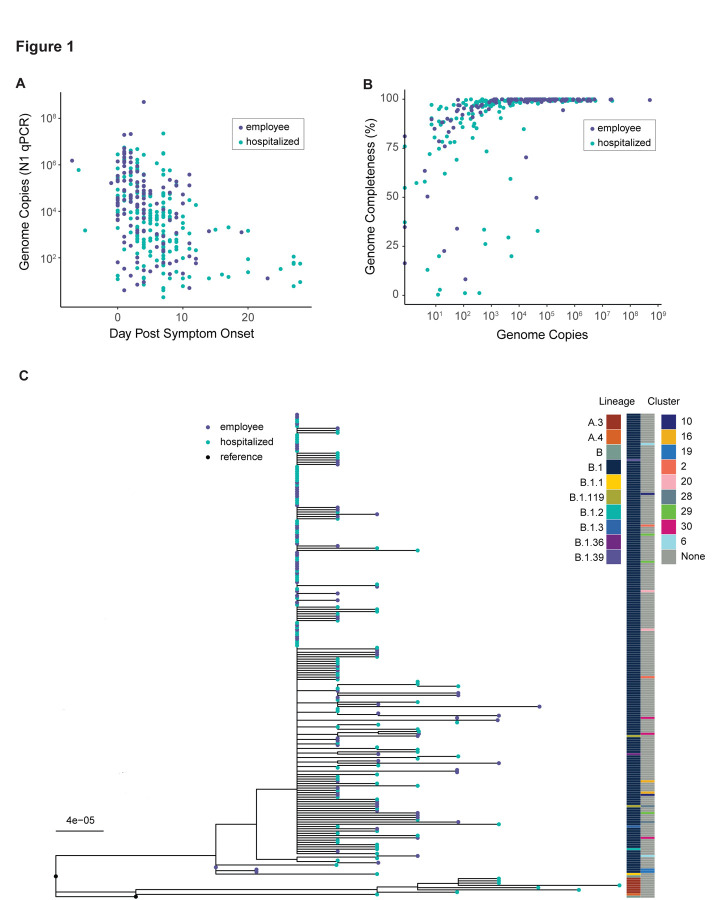
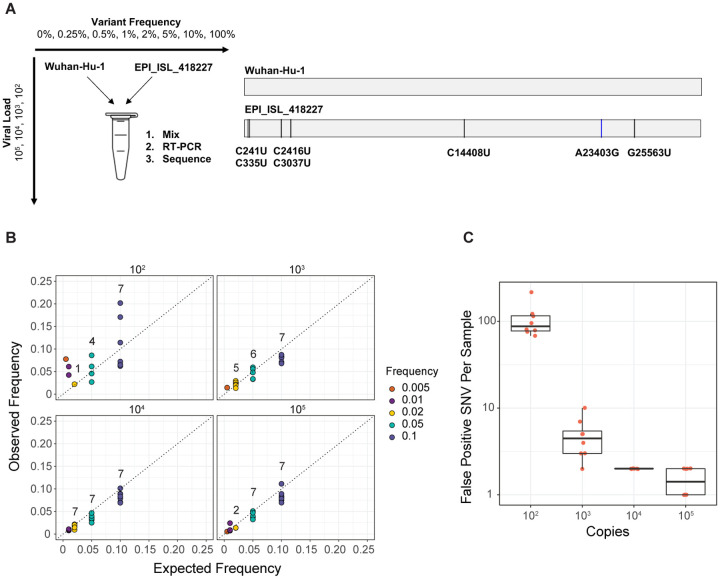
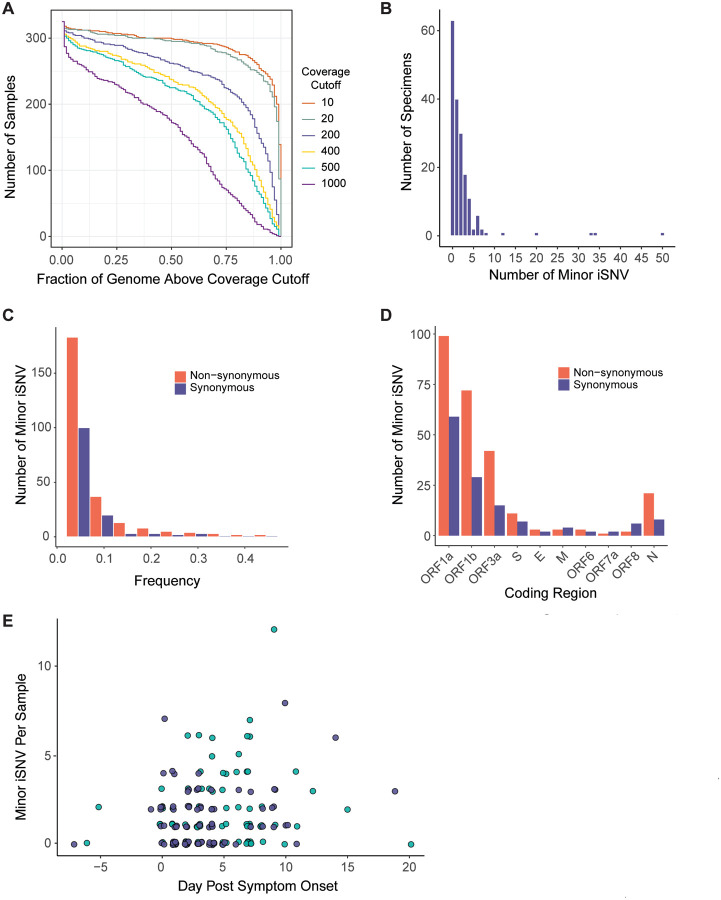
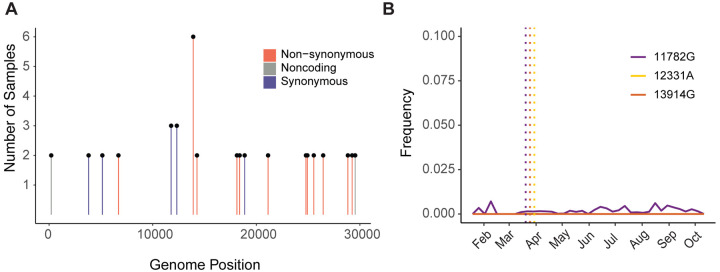
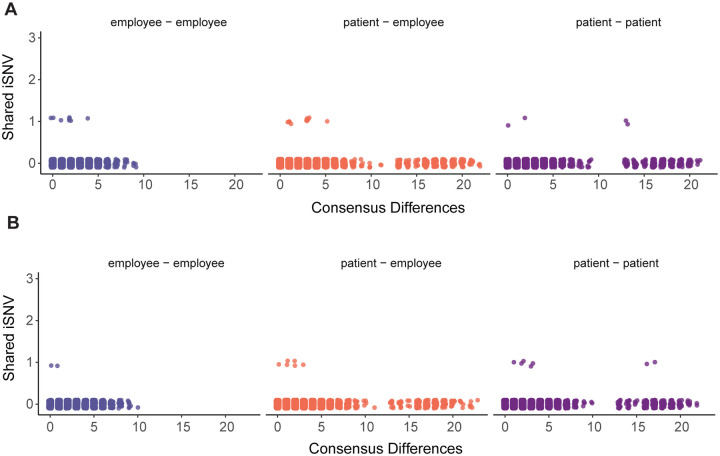
Analysis of SARS-CoV-2 genetic diversity within infected hosts can provide insight into the generation and spread of new viral variants and may enable high resolution inference of transmission chains. However, little is known about temporal aspects of SARS-CoV-2 intrahost diversity and the extent to which shared diversity reflects convergent evolution as opposed to transmission linkage. Here we use high depth of coverage sequencing to identify within-host genetic variants in 325 specimens from hospitalized COVID-19 patients and infected employees at a single medical center. We validated our variant calling by sequencing defined RNA mixtures and identified a viral load threshold that minimizes false positives. By leveraging clinical metadata, we found that intrahost diversity is low and does not vary by time from symptom onset. This suggests that variants will only rarely rise to appreciable frequency prior to transmission. Although there was generally little shared variation across the sequenced cohort, we identified intrahost variants shared across individuals who were unlikely to be related by transmission. These variants did not precede a rise in frequency in global consensus genomes, suggesting that intrahost variants may have limited utility for predicting future lineages. These results provide important context for sequence-based inference in SARS-CoV-2 evolution and epidemiology.


Figures

Figure 1.
Figure 1.
Viral shedding and overview of genome sequencing data. (A) Viral load by day of infection in hospitalized patients (teal) and employees (violet). Viral load, measured by qPCR of the N gene in units of genome copies per microliter of extracted RNA, is on the y-axis and day post symptom onset is on the x-axis. (B) Genome completeness by viral load in hospitalized patients (teal) and employees (violet). Viral load as shown in (A) is on the x-axis and the fraction of the genome covered above 10x read depth is shown on the y-axis. (C) Maximum-likelihood phylogenetic tree. Tips represent complete consensus genomes from hospitalized patients (teal) and employees (violet). The axis shows divergence from the root (Wuhan-Hu-1/2019). Heatmaps show PANGOLIN evolutionary linage (left) and epidemiologic cluster (right).
Figure 2.
Figure 2.
Assessing accuracy of intrahost variant detection by sequencing defined viral mixtures. (A) Schematic of the experiment. Wuhan-Hu-1 (reference) and EPI_ISL_418227 (variant) RNA were mixed at the given frequencies and viral loads (units of genome copies per microliter, representing the resulting mixture). Mixtures of RNA were amplified and sequenced in the same fashion as the clinical specimens. Reference and variant genomes differ by seven single nucleotide substitutions. (B) Observed frequency by expected frequency. Observed frequency of the true positive intrahost single nucleotide variants (iSNV) is on the y-axis and expected iSNV frequency is on the x-axis. Synthetic RNA copy number in units of genome copies per microliter of RNA is shown above each facet. Values above the points indicate the number of variants detected in that group (maximum of seven per group). (C) False positive iSNV. Number of false positive iSNV per sample is shown on the y-axis (base 10 log scale) and viral load as shown in (B) is on the x-axis. Each point represents a unique sample and the boxplots represent the median and 25th and 75th percentiles, with whiskers extending to the most extreme point within the range of the median ± 1.5 times the interquartile range.
Figure 3.
Figure 3.
SARS-CoV-2 intrahost single nucleotide variant (iSNV) diversity. (A) Sequencing coverage for clinical samples. The number of clinical samples (y-axis) is shown by the fraction of the genome above a given read depth threshold (x-axis). The different lines show the data evaluated with six read depth thresholds. (B) Histogram of the number of specimens (y-axis) by the number of minor iSNV per sample (x-axis), n = 178. (C) Number of minor iSNV by frequency with a bin width of 0.05. Non-synonymous iSNV are shown in orange and synonymous iSNV are shown in violet. (D) Number of minor iSNV by coding region. Non-synonymous iSNV are shown in orange and synonymous iSNV are shown in violet. (E) Scatterplot of the number of minor iSNV per sample (y-axis) by the day post symptom onset (x-axis). Hospitalized patients are shown in teal and employees shown in violet. The four samples with > 15 iSNV shown in (B) are excluded from the plot for visualization.
Figure 4.
Figure 4.
Shared iSNV across samples and their frequency in global consensus genomes. (A) Shared iSNV across samples, with the number of samples sharing the iSNV (y-axis) by the genome position (x-axis). Colors indicate the iSNV coding change relative to the reference. (B) The frequency (y-axis) of three iSNV shared by three or more samples over time (x-axis). The consensus genomes are from GISAID, as available on 2020-11-11. The vertical dotted lines represent the earliest time we detected each iSNV in our samples.
Figure 5.
Figure 5.
Pairwise comparisons of shared iSNV. Each unique pair is shown as a single point, with employee-employee pairs in violet (left), patient-employee pairs in orange (middle), and patient-patient pairs in purple (right). The number of iSNV shared by each pair is shown on the y-axis with the number of consensus differences between the pair of genomes on the x-axis. Pairs of samples collected within seven days of each other are displayed in (A), and pairs of samples collected greater than seven days apart are shown in (B).

References

    1. Fauver J. R. et al. Coast-to-Coast Spread of SARS-CoV-2 during the Early Epidemic in the United States. Cell 181, 990–996.e5 (2020). - PMC - PubMed
    1. Meredith L. W. et al. Rapid implementation of SARS-CoV-2 sequencing to investigate cases of health-care associated COVID-19: a prospective genomic surveillance study. Lancet Infect. Dis. 0, (2020). - PMC - PubMed
    1. Munnink B. B. O. et al. Rapid SARS-CoV-2 whole-genome sequencing and analysis for informed public health decision-making in the Netherlands. Nat. Med. 1–6 (2020) doi:10.1038/s41591-020-0997-y - DOI - PubMed
    1. Sekizuka T. et al. Haplotype networks of SARS-CoV-2 infections in the Diamond Princess cruise ship outbreak. Proc. Natl. Acad. Sci. (2020) doi:10.1073/pnas.2006824117 - DOI - PMC - PubMed
    1. Geoghegan J. L. et al. Genomic epidemiology reveals transmission patterns and dynamics of SARS-CoV-2 in Aotearoa New Zealand. Nat. Commun. 11, 6351 (2020). - PMC - PubMed

Publication types

LinkOut - more resources