

This is a preprint.
High-throughput sequencing of SARS-CoV-2 in wastewater provides insights into circulating variants
- PMID: 33501452
- PMCID: PMC7836124
- DOI: 10.1101/2021.01.22.21250320
High-throughput sequencing of SARS-CoV-2 in wastewater provides insights into circulating variants
Update in
-
High-throughput sequencing of SARS-CoV-2 in wastewater provides insights into circulating variants.Water Res. 2021 Oct 15;205:117710. doi: 10.1016/j.watres.2021.117710. Epub 2021 Sep 25. Water Res. 2021. PMID: 34607084 Free PMC article.
Abstract
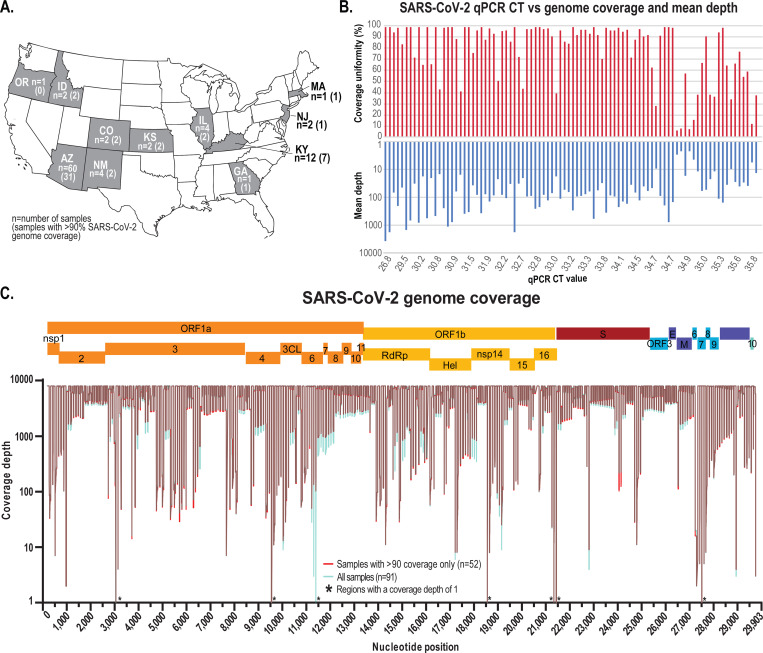
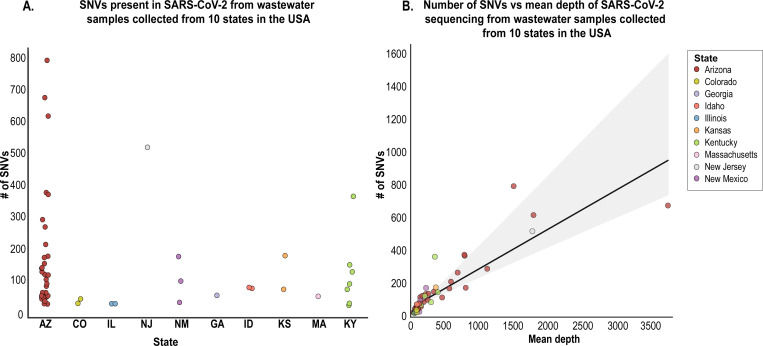
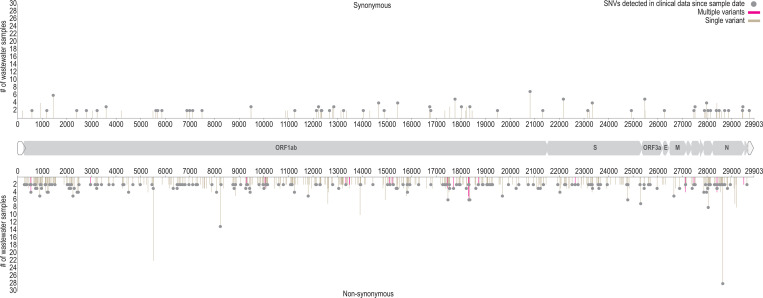
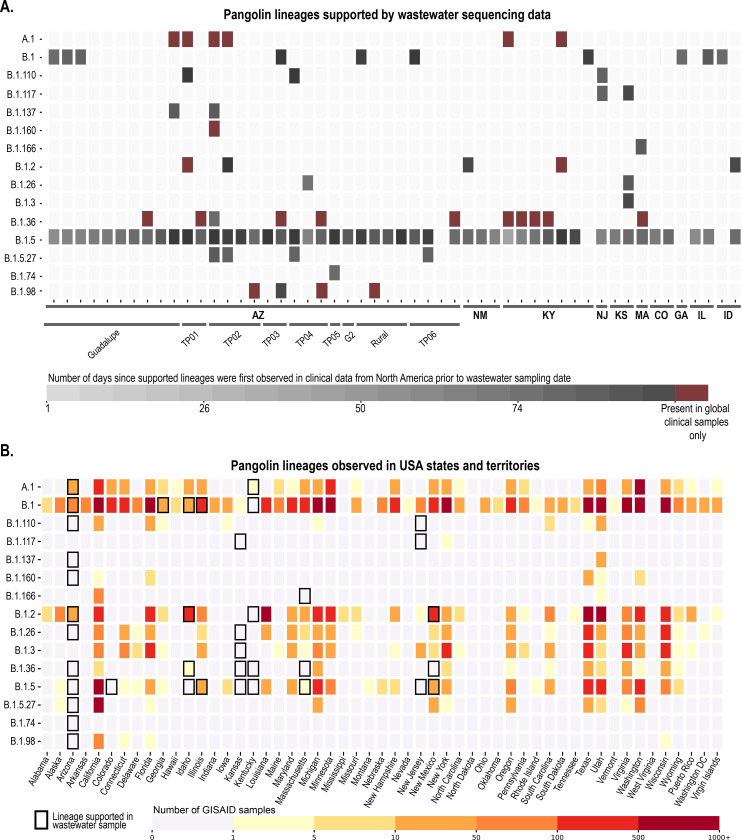
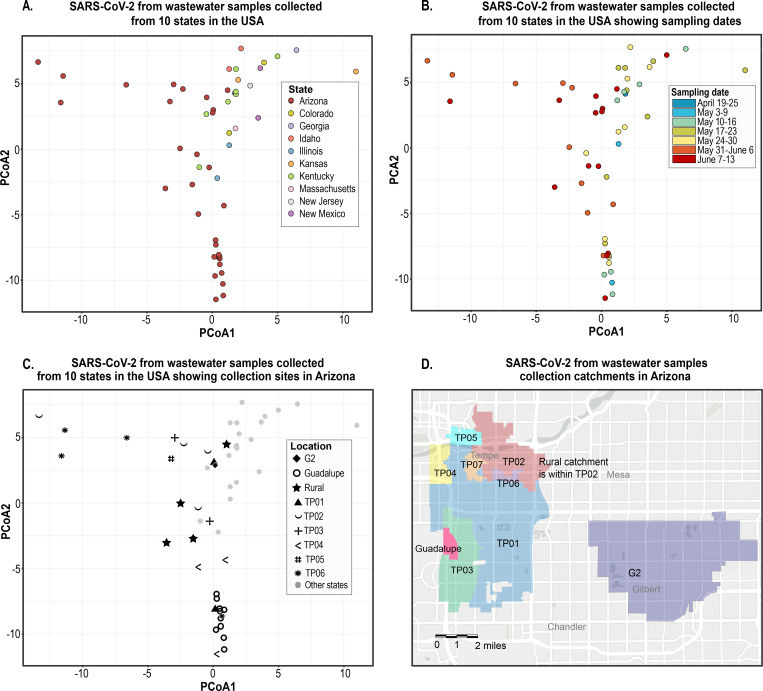
Severe acute respiratory syndrome coronavirus 2 (SARS-CoV-2) emerged from a zoonotic spill-over event and has led to a global pandemic. The public health response has been predominantly informed by surveillance of symptomatic individuals and contact tracing, with quarantine, and other preventive measures have then been applied to mitigate further spread. Non-traditional methods of surveillance such as genomic epidemiology and wastewater-based epidemiology (WBE) have also been leveraged during this pandemic. Genomic epidemiology uses high-throughput sequencing of SARS-CoV-2 genomes to inform local and international transmission events, as well as the diversity of circulating variants. WBE uses wastewater to analyse community spread, as it is known that SARS-CoV-2 is shed through bodily excretions. Since both symptomatic and asymptomatic individuals contribute to wastewater inputs, we hypothesized that the resultant pooled sample of population-wide excreta can provide a more comprehensive picture of SARS-CoV-2 genomic diversity circulating in a community than clinical testing and sequencing alone. In this study, we analysed 91 wastewater samples from 11 states in the USA, where the majority of samples represent Maricopa County, Arizona (USA). With the objective of assessing the viral diversity at a population scale, we undertook a single-nucleotide variant (SNV) analysis on data from 52 samples with >90% SARS-CoV-2 genome coverage of sequence reads, and compared these SNVs with those detected in genomes sequenced from clinical patients. We identified 7973 SNVs, of which 5680 were novel SNVs that had not yet been identified in the global clinical-derived data as of 17th June 2020 (the day after our last wastewater sampling date). However, between 17th of June 2020 and 20th November 2020, almost half of the SNVs have since been detected in clinical-derived data. Using the combination of SNVs present in each sample, we identified the more probable lineages present in that sample and compared them to lineages observed in North America prior to our sampling dates. The wastewater-derived SARS-CoV-2 sequence data indicates there were more lineages circulating across the sampled communities than represented in the clinical-derived data. Principal coordinate analyses identified patterns in population structure based on genetic variation within the sequenced samples, with clear trends associated with increased diversity likely due to a higher number of infected individuals relative to the sampling dates. We demonstrate that genetic correlation analysis combined with SNVs analysis using wastewater sampling can provide a comprehensive snapshot of the SARS-CoV-2 genetic population structure circulating within a community, which might not be observed if relying solely on clinical cases.
Conflict of interest statement
Figures
References
-
- Adams E.R., Ainsworth M., Anand R., Andersson M.I., Auckland K., Baillie J.K., Barnes E., Beer S., Bell J.I. and Berry T. 2020. Antibody testing for COVID-19: A report from the National COVID Scientific Advisory Panel. Wellcome Open Research 5(139), 139.10.12688/wellcomeopenres.15927.1. - DOI - PMC - PubMed
-
- Ahmed W., Angel N., Edson J., Bibby K., Bivins A., O’Brien J.W., Choi P.M., Kitajima M., Simpson S.L., Li J., Tscharke B., Verhagen R., Smith W.J.M., Zaugg J., Dierens L., Hugenholtz P., Thomas K.V. and Mueller J.F. 2020. First confirmed detection of SARS-CoV-2 in untreated wastewater in Australia: A proof of concept for the wastewater surveillance of COVID-19 in the community. Sci Total Environ 728, 138764.10.1016/j.scitotenv.2020.138764. - DOI - PMC - PubMed
-
- Balboa S., Mauricio-Iglesias M., Rodriguez S., Martínez-Lamas L., Vasallo F.J., Regueiro B. and Lema J.M. 2020. The fate of SARS-CoV-2 in wastewater treatment plants points out the sludge line as a suitable spot for incidence monitoring. medRxiv 10.1101/2020.05.25.2011270610.1101/2020.05.25.20112706. - DOI - DOI - PMC - PubMed
-
- Becker M., Strengert M., Junker D., Kerrinnes T., Kaiser P.D., Traenkle B., Dinter H., Haering J., Zeck A., Weise F., Peter A., Hoerber S., Fink S., Ruoff F., Bakchoul T., Baillot A., Lohse S., Cornberg M., Illig T., Gottlieb J., Smola S., Karch A., Berger K., Rammensee H.-G., Schenke-Layland K., Nelde A., Maerklin M., Heitmann J.S., Walz J.S., Templin M.F., Joos T.O., Rothbauer U., Krause G. and Schneiderhan-Marra N. 2020. Going beyond clinical routine in SARS-CoV-2 antibody testing - A multiplex corona virus antibody test for the evaluation of cross-reactivity to endemic coronavirus antigens. medRxiv 2020.07.17.20156000.https://doi.org/2020.07.17.20156000.
Publication types
Grants and funding
LinkOut - more resources
Full Text Sources
Other Literature Sources
Miscellaneous