

This is a preprint.
Identifying bias in models that detect vocal fold paralysis from audio recordings using explainable machine learning and clinician ratings
- PMID: 33501466
- PMCID: PMC7836138
- DOI: 10.1101/2020.11.23.20235945
Identifying bias in models that detect vocal fold paralysis from audio recordings using explainable machine learning and clinician ratings
Update in
-
Identifying bias in models that detect vocal fold paralysis from audio recordings using explainable machine learning and clinician ratings.PLOS Digit Health. 2024 May 30;3(5):e0000516. doi: 10.1371/journal.pdig.0000516. eCollection 2024 May. PLOS Digit Health. 2024. PMID: 38814939 Free PMC article.
Abstract
Introduction: Detecting voice disorders from voice recordings could allow for frequent, remote, and low-cost screening before costly clinical visits and a more invasive laryngoscopy examination. Our goals were to detect unilateral vocal fold paralysis (UVFP) from voice recordings using machine learning, to identify which acoustic variables were important for prediction to increase trust, and to determine model performance relative to clinician performance.
Methods: Patients with confirmed UVFP through endoscopic examination (N=77) and controls with normal voices matched for age and sex (N=77) were included. Voice samples were elicited by reading the Rainbow Passage and sustaining phonation of the vowel "a". Four machine learning models of differing complexity were used. SHapley Additive explanations (SHAP) was used to identify important features.
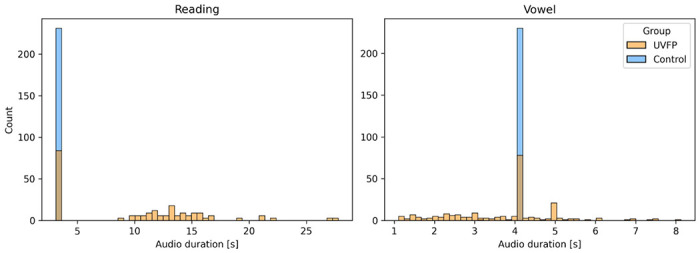
Results: The highest median bootstrapped ROC AUC score was 0.87 and beat clinician's performance (range: 0.74 - 0.81) based on the recordings. Recording durations were different between UVFP recordings and controls due to how that data was originally processed when storing, which we can show can classify both groups. And counterintuitively, many UVFP recordings had higher intensity than controls, when UVFP patients tend to have weaker voices, revealing a dataset-specific bias which we mitigate in an additional analysis.
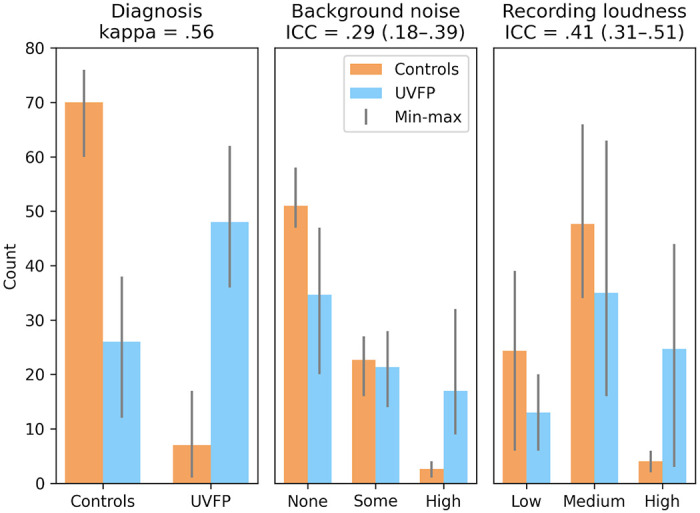
Conclusion: We demonstrate that recording biases in audio duration and intensity created dataset-specific differences between patients and controls, which models used to improve classification. Furthermore, clinician's ratings provide further evidence that patients were over-projecting their voices and being recorded at a higher amplitude signal than controls. Interestingly, after matching audio duration and removing variables associated with intensity in order to mitigate the biases, the models were able to achieve a similar high performance. We provide a set of recommendations to avoid bias when building and evaluating machine learning models for screening in laryngology.
Keywords: acoustic analysis; bias; explainability; interpretability; machine learning; speech; vocal fold paralysis; voice.
Figures


References
-
- Wroge TJ, Özkanca Y, Demiroglu C, Si D. Parkinson’s disease diagnosis using machine learning and voice. 2018 IEEE signal [Internet], 2018.
-
- Quatieri TF. Discrete-Time Speech Signal Processing: Principles and Practice. Pearson Education; 2008. 816 p.
-
- Molnar C. Interpretable Machine Learning. Lulu.com; 2019. 319 p.
-
- Stachler RJ, Francis DO, Schwartz SR, Damask CC, Digoy GP, Krouse HJ, et al. Clinical practice guideline: Hoarseness (dysphonia) (update). Otolaryngol Head Neck Surg. 2018. Mar;158(1_suppl):S1–42. - PubMed
Publication types
Grants and funding
LinkOut - more resources
Full Text Sources