. 2021 Apr;64(4):890-902.
doi: 10.1007/s00125-020-05357-4. Epub 2021 Jan 27.

Maternal obesity during pregnancy leads to adipose tissue ER stress in mice via miR-126-mediated reduction in Lunapark

Affiliations

Maternal obesity during pregnancy leads to adipose tissue ER stress in mice via miR-126-mediated reduction in Lunapark

Juliana de Almeida-Faria et al. Diabetologia. 2021 Apr.

Abstract

Aims/hypothesis: Levels of the microRNA (miRNA) miR-126-3p are programmed cell-autonomously in visceral adipose tissue of adult offspring born to obese female C57BL/6J mice. The spectrum of miR-126-3p targets and thus the consequences of its dysregulation for adipocyte metabolism are unknown. Therefore, the aim of the current study was to identify novel targets of miR-126-3p in vitro and then establish the outcomes of their dysregulation on adipocyte metabolism in vivo using a well-established maternal obesity mouse model.

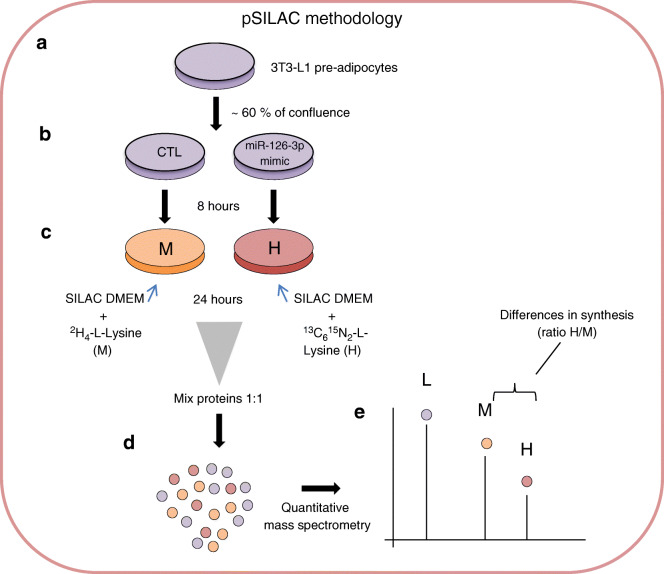
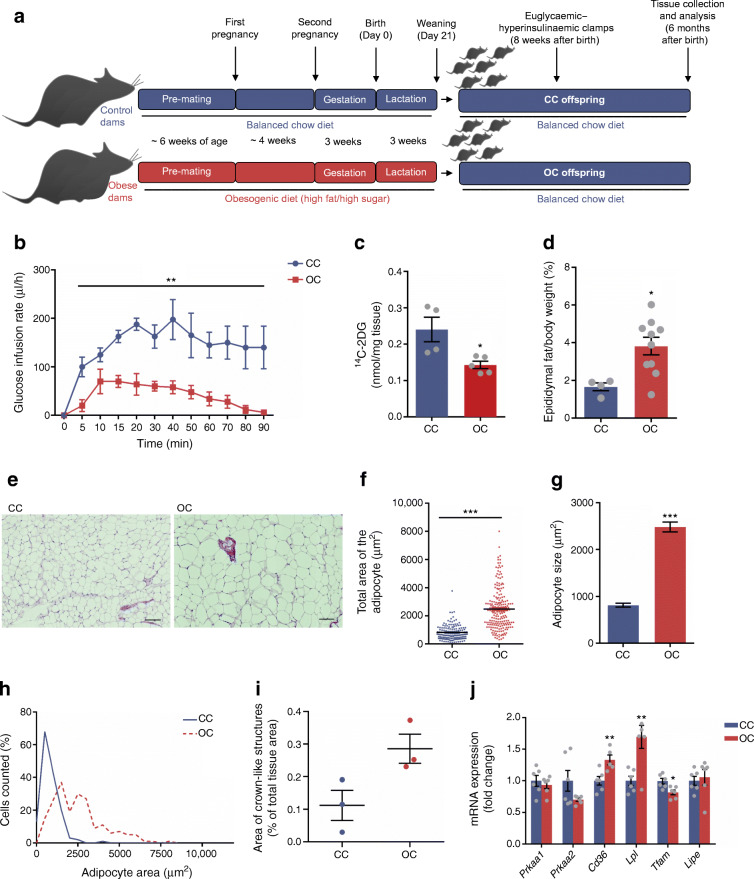
Methods: miR-126-3p overexpression in 3T3-L1 pre-adipocytes followed by pulsed stable isotope labelling by amino acids in culture (pSILAC) was performed to identify novel targets of the miRNA. Well-established bioinformatics algorithms and luciferase assays were then employed to confirm those that were direct targets of miR-126-3p. Selected knockdown experiments were performed in vitro to define the consequences of target dysregulation. Quantitative real-time PCR, immunoblotting, histology, euglycaemic-hyperinsulinaemic clamps and glucose tolerance tests were performed to determine the phenotypic and functional outcomes of maternal programmed miR-126-3p levels in offspring adipose tissue.

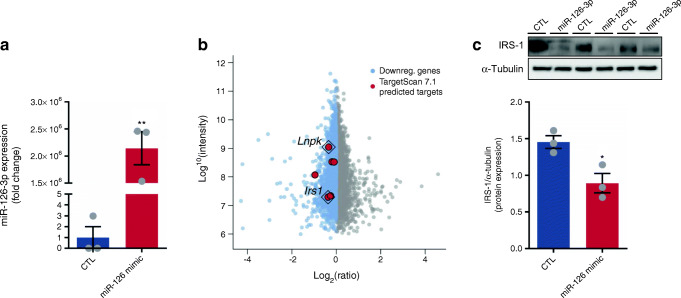
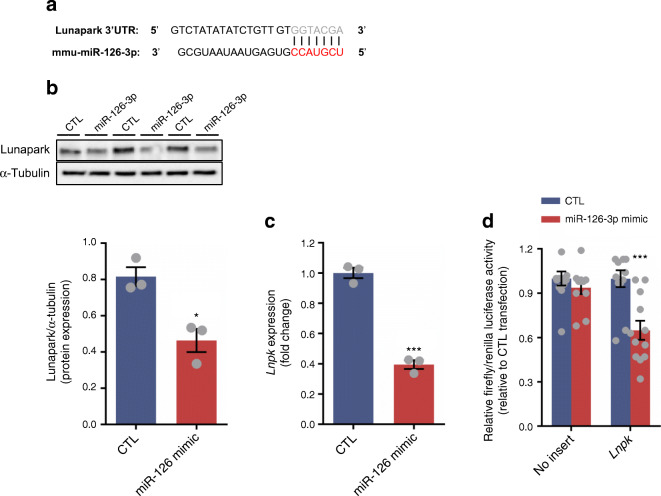
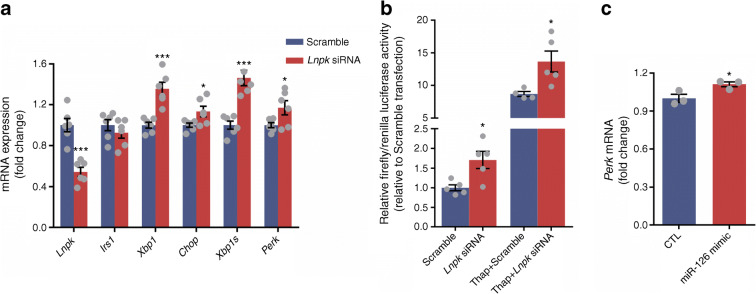
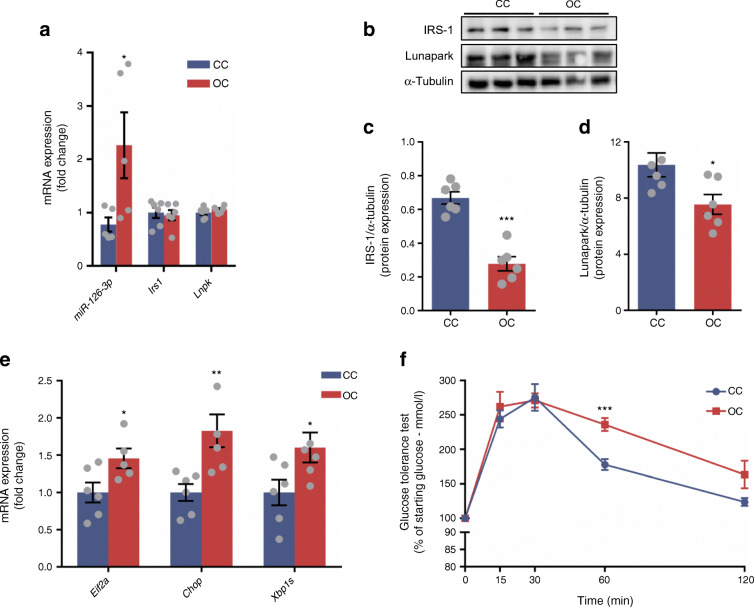
Results: The proteomic approach confirmed the identity of known targets of miR-126-3p (including IRS-1) and identified Lunapark, an endoplasmic reticulum (ER) protein, as a novel one. We confirmed by luciferase assay that Lunapark was a direct target of miR-126-3p. Overexpression of miR-126-3p in vitro led to a reduction in Lunapark protein levels and increased Perk (also known as Eif2ak3) mRNA levels and small interference-RNA mediated knockdown of Lunapark led to increased Xbp1, spliced Xbp1, Chop (also known as Ddit3) and Perk mRNA levels and an ER stress transcriptional response in 3T3-L1 pre-adipocytes. Consistent with the results found in vitro, increased miR-126-3p expression in adipose tissue from adult mouse offspring born to obese dams was accompanied by decreased Lunapark and IRS-1 protein levels and increased markers of ER stress. At the whole-body level the animals displayed glucose intolerance.

Conclusions/interpretation: Concurrently targeting IRS-1 and Lunapark, a nutritionally programmed increase in miR-126-3p causes adipose tissue insulin resistance and an ER stress response, both of which may contribute to impaired glucose tolerance. These findings provide a novel mechanism by which obesity during pregnancy leads to increased risk of type 2 diabetes in the offspring and therefore identify miR-126-3p as a potential therapeutic target.

Keywords: ER stress; Glucose metabolism; Lunapark; Maternal obesity; Nutritional programming; miR-126-3p.


Figures

Fig. 1
Fig. 1
miR-126-3p overexpression followed by pSILAC in 3T3-L1 pre-adipocytes to determine the general proteomic profile. (a) 3T3-L1 pre-adipocytes were grown in supplemented DMEM high-glucose media until they reached 60–70% confluence. From this point, (b) cells were transfected with scrambled (CTL) or miR-126-3p mimic for 8 h. (c) Later, normal DMEM media was replaced with SILAC DMEM containing medium lysine (M; for CTL) or heavy lysine (H; for miR-126-3p overexpression) for 24 h, the time required for 3T3-L1 cell turnover and incorporation of the respective amino acid. (d) CTL or miR-126-3p-mimic-treated cell protein extracts were combined at the same proportion (based on protein quantification) and (e) differences in protein expression were detected by quantitative mass spectrometry
Fig. 2
Fig. 2
Protein general profile after miR-126-3p overexpression. (a) miR-126-3p expression normalised by U6 housekeeping mRNA, n = 3 per group. (b) Scatter plot representing the general proteomic profile found for miR-126-3p-mimic-transfected 3T3-L1 pre-adipocytes. The normalised heavy (miR-126-3p)/medium (scrambled; CTL) ratio was used as the basis of the graph. (c) IRS-1 protein expression normalised by α-tubulin, n = 3 per group. Data were analysed by unpaired Student’s t test (a, c, CTL vs miR-126 mimic); *p < 0.05 and **p < 0.01. All the graphs represent mean ± SEM. Downreg., downregulated
Fig. 3
Fig. 3
miR-126-3p directly regulates Lunapark protein expression. (a) Lunapark 3′UTR and its respective region of interaction within mmu-miR-126-3p sequence (miRNA seed sequence presented in red characters). (b) Representative blots and graphical representation of Lunapark protein expression normalised to α-tubulin, n = 3 per group. (c) Lnpk mRNA expression normalised by cyclophilin, n = 3 per group. (d) Relative firefly luciferase normalised by renilla luciferase activity measured in cells transfected with either a pmiRGlo vector with no insert or a pmiRGlo vector containing Lnpk-3’ UTR sequence, n = 12 per group. Data were analysed by unpaired Student’s t test (b, c, scrambled [CTL] vs miR-126 mimic; d, CTL vs miR-126 mimic, with or without siRNA targeting Lnpk); *p < 0.05 and ***p < 0.001. All the graphs represent mean ± SEM
Fig. 4
Fig. 4
Lunapark inhibition activates ER stress response and miR-126-3p overexpression increases Perk mRNA expression in vitro. 3T3-L1 pre-adipocytes were transfected either with scrambled or Lnpk siRNA (a, b) or with scrambled (CTL) or miR-126-3p mimic (c) prior to the following measurements. (a) qPCR of Lnpk, Irs1 and the altered ER-related genes, n = 5–6 per group. (b) ER stress response element targeting transcription factor activity measured through luciferase activity, n = 5 per group. (c) qPCR of Perk mRNA levels, n = 3. Data were analysed by unpaired Student’s t test (a, Scramble vs Lnpk siRNA; b, Scramble vs Lnpk siRNA, with or without thapsigargin; c, CTL vs miR-126 mimic); *p < 0.05 and ***p < 0.001. All the graphs represent mean ± SEM. Thap, thapsigargin
Fig. 5
Fig. 5
Maternal obesity compromises adipocyte morphology and functionality of adult offspring. (a) Schematic representation of the animal model used in the current study. (b) Euglycaemic–hyperinsulinaemic glucose infusion rate during clamp and (c) 14C-2DG uptake into adipose tissue of 8-week-old male offspring, n = 4–5 per group. (d) Relative epididymal fat of 6-month-old male offspring, n = 4–10 per group. (e) Representative H&E images (scale bars, 100 μm; n = 3–4), (f) total area, (g) size and (h) frequency distribution of adipocytes of CC and OC offspring, n = 3–4 animals per group, 50 adipocytes/animal. (i) Area of crown-like structures (n = 3 per group, p = 0.05) and (j) relative expression of genes related to lipid metabolism, n = 5–6 per group. Data in (b) were analysed by two-way (repeated measures) ANOVA followed by Bonferroni’s multiple comparisons test. Data in (c, d, f, g, i, j) were analysed by unpaired Student’s t test (CC vs OC offspring); *p < 0.05, **p < 0.01 and ***p < 0.001. All the graphs represent mean ± SEM
Fig. 6
Fig. 6
Maternal obesity compromises glucose and ER homeostasis concomitantly through miR-126-3p programming in eWAT of adult offspring. (a) Normalised relative miR-126-3p, Irs1 and Lnpk expression (n = 5 per group). (b) Representative blots followed by normalised (c) IRS-1 and (d) Lunapark protein expression, n = 6 for both. (e) Altered relative expression of ER-related genes, n = 5–6 per group. (f) Percentage of starting glucose during glucose tolerance test, n = 6–7 per group. Data in (a, ce) were analysed by unpaired Student’s t test (CC vs OC offspring). Data in (f) were analysed by two-way (repeated measures) ANOVA followed by Bonferroni’s multiple comparisons test; *p < 0.05, **p < 0.01 and ***p < 0.001. All the graphs represent mean ± SEM

References

    1. WHO (2020) Obesity and overweight fact sheet. Available from http://www.who.int/mediacentre/factsheets/fs311/en/. Accessed 1 Apr 2020
    1. Kahn SE, Hull RL, Utzschneider KM. Mechanisms linking obesity to insulin resistance and type 2 diabetes. Nature. 2006;444(7121):840–846. doi: 10.1038/nature05482. - DOI - PubMed
    1. Jocken JW, Langin D, Smit E, et al. Adipose triglyceride lipase and hormone-sensitive lipase protein expression is decreased in the obese insulin-resistant state. J Clin Endocrinol Metab. 2007;92(6):2292–2299. doi: 10.1210/jc.2006-1318. - DOI - PubMed
    1. Bickerton AS, Roberts R, Fielding BA, et al. Adipose tissue fatty acid metabolism in insulin-resistant men. Diabetologia. 2008;51(8):1466–1474. doi: 10.1007/s00125-008-1040-x. - DOI - PubMed
    1. McQuaid SE, Hodson L, Neville MJ, et al. Downregulation of adipose tissue fatty acid trafficking in obesity: a driver for ectopic fat deposition? Diabetes. 2011;60(1):47–55. doi: 10.2337/db10-0867. - DOI - PMC - PubMed

Publication types

MeSH terms

LinkOut - more resources