. 2021 Mar;599(6):1885-1899.
doi: 10.1113/JP280856. Epub 2021 Feb 18.

The effect of time-of-day and circadian phase on vulnerability to seizure-induced death in two mouse models

Affiliations

The effect of time-of-day and circadian phase on vulnerability to seizure-induced death in two mouse models

Benton S Purnell et al. J Physiol. 2021 Mar.

Abstract

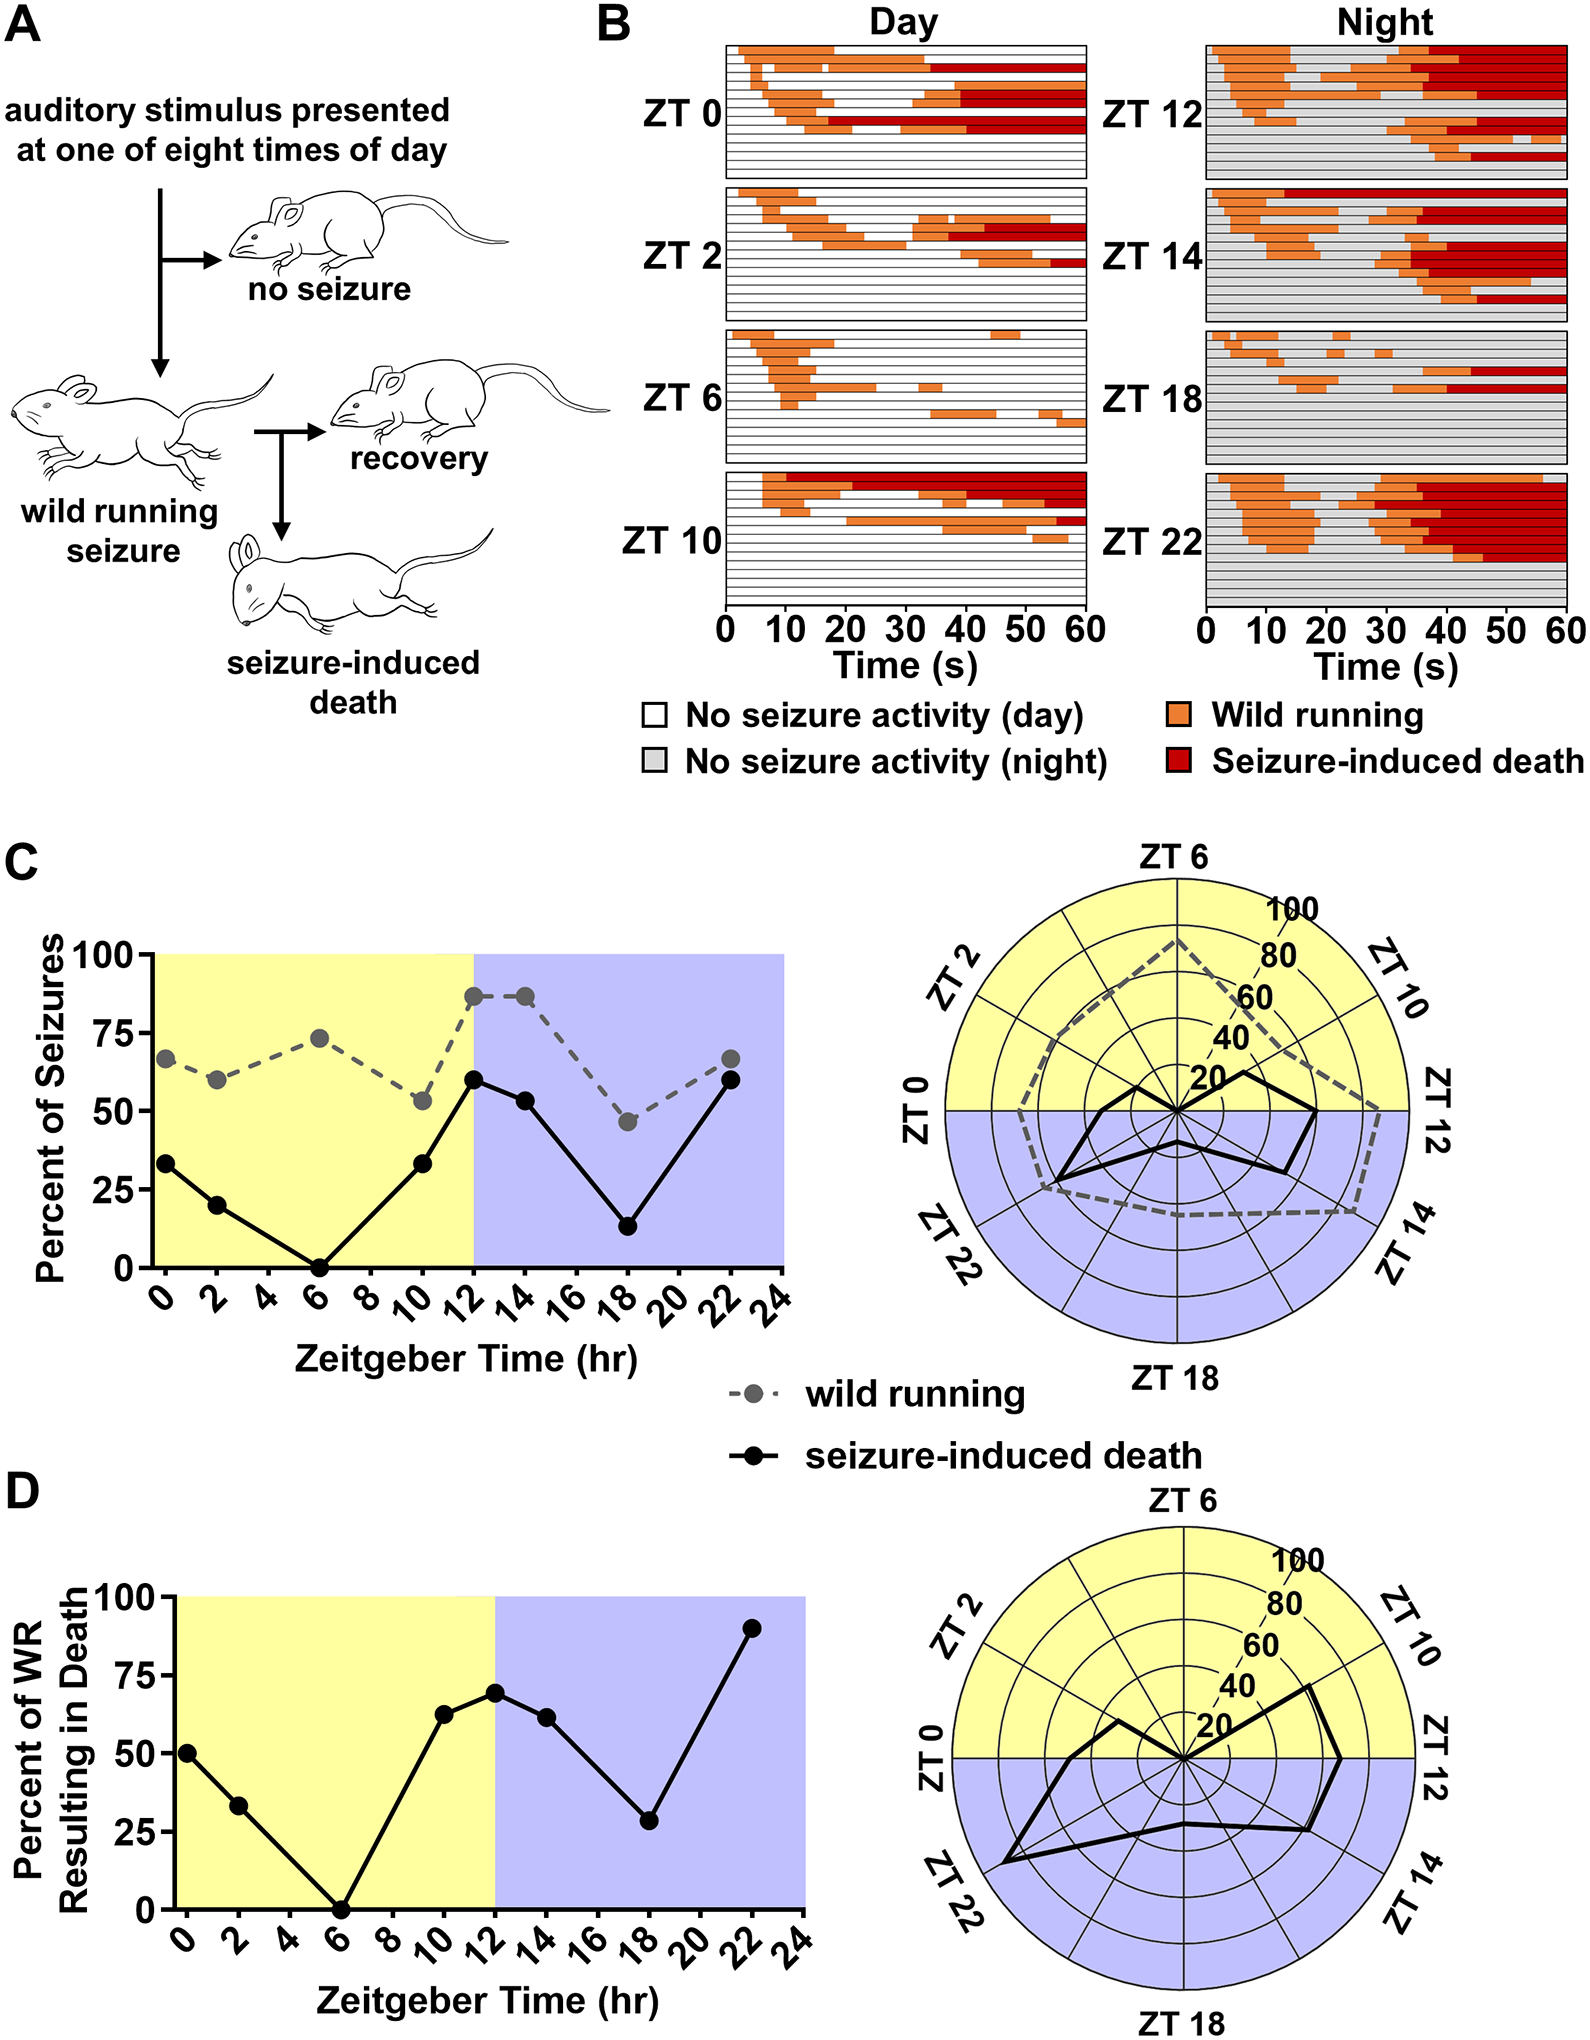
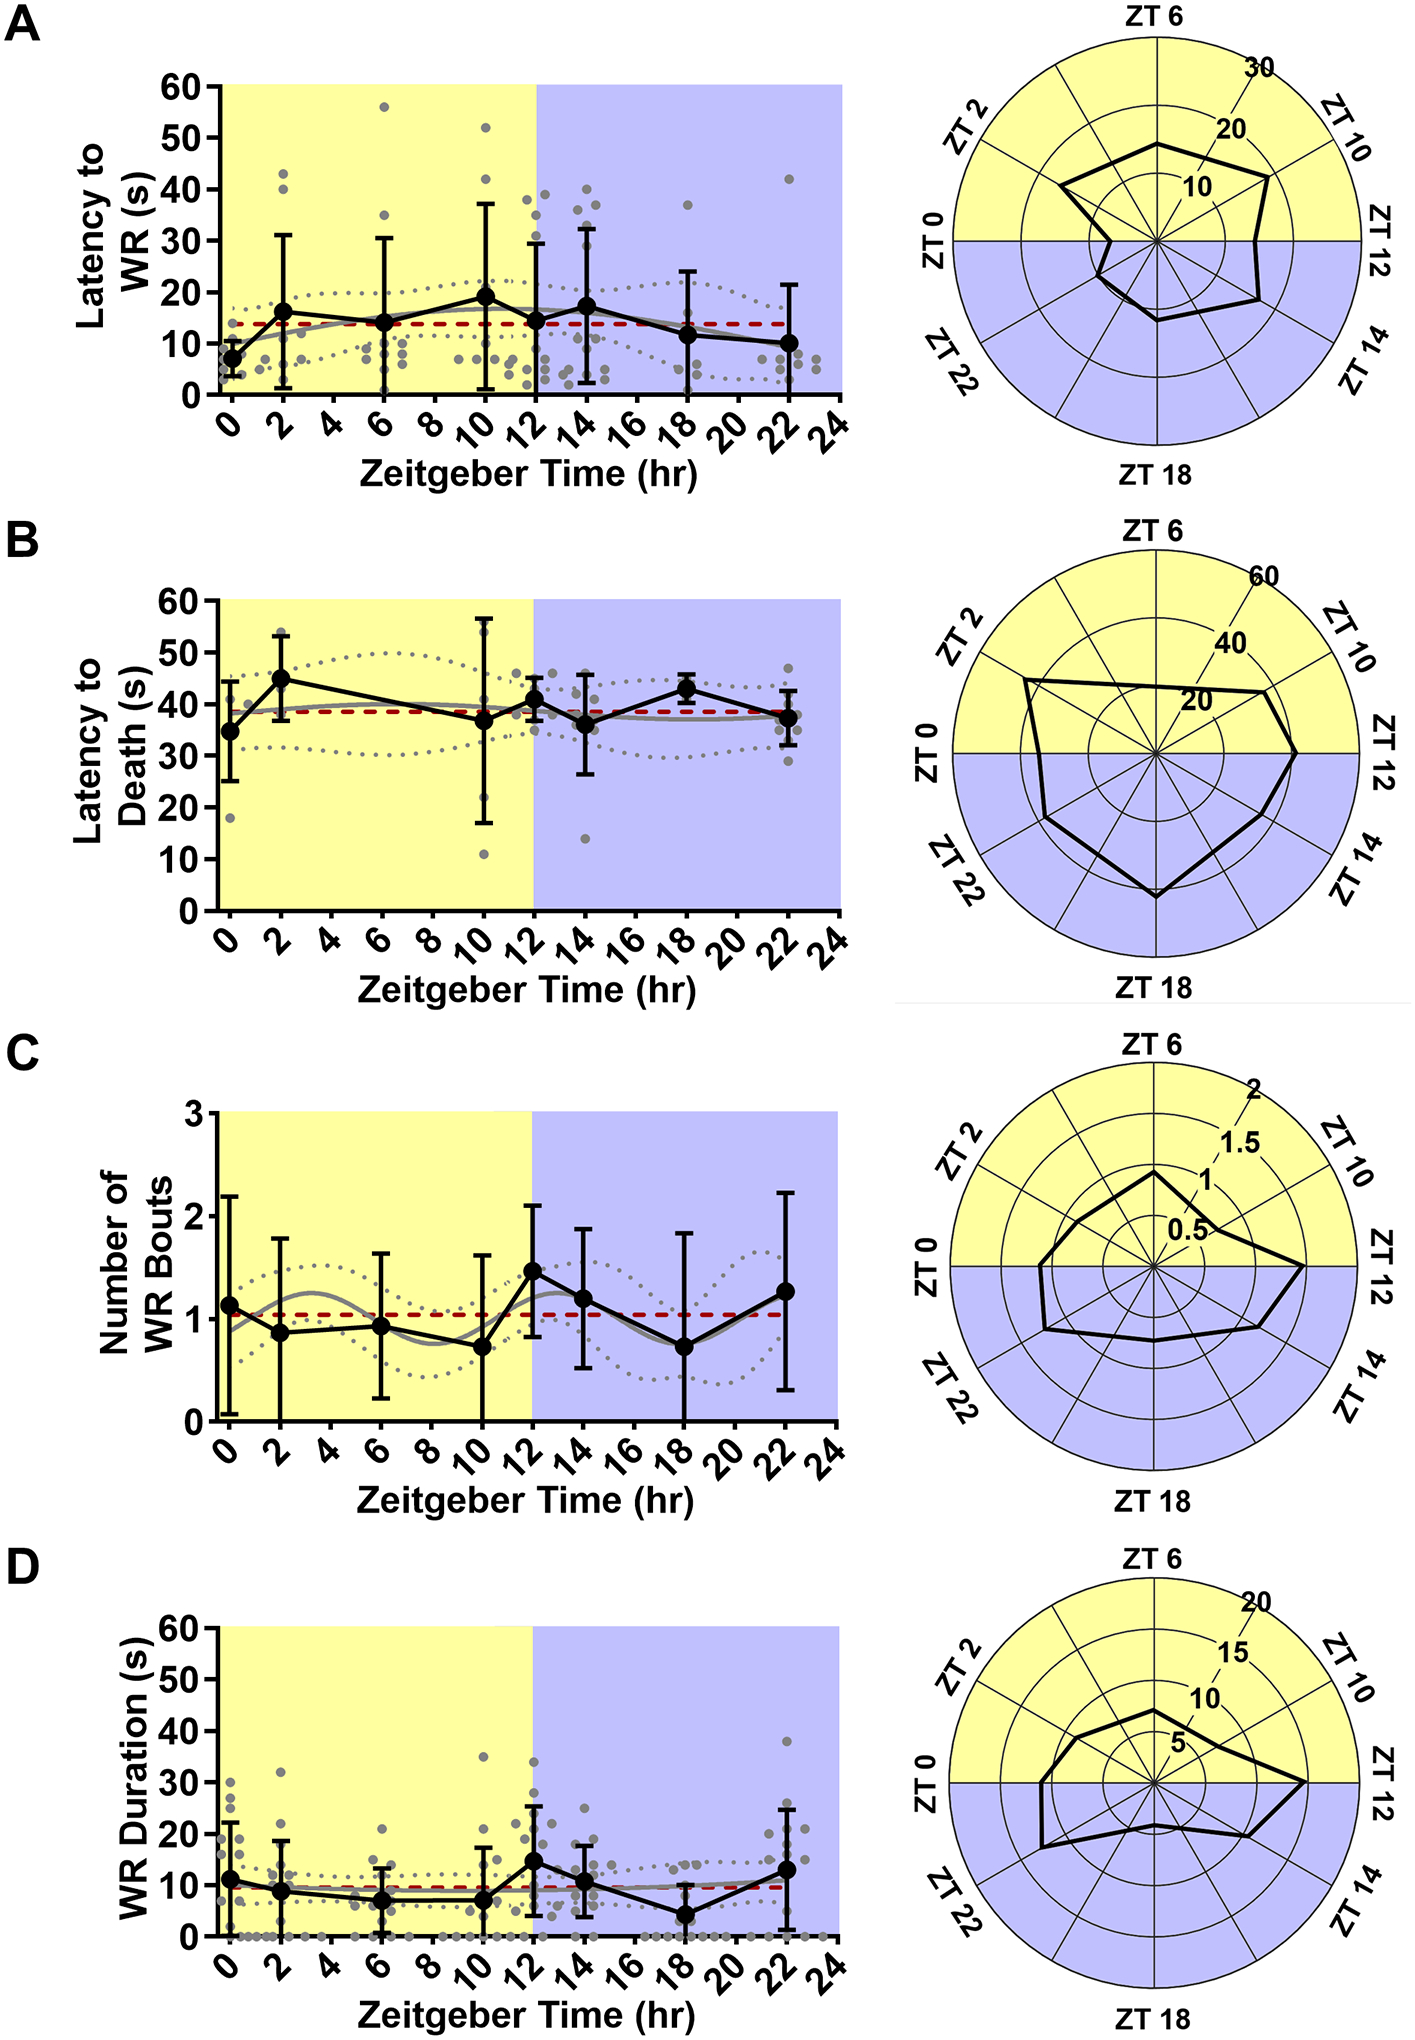
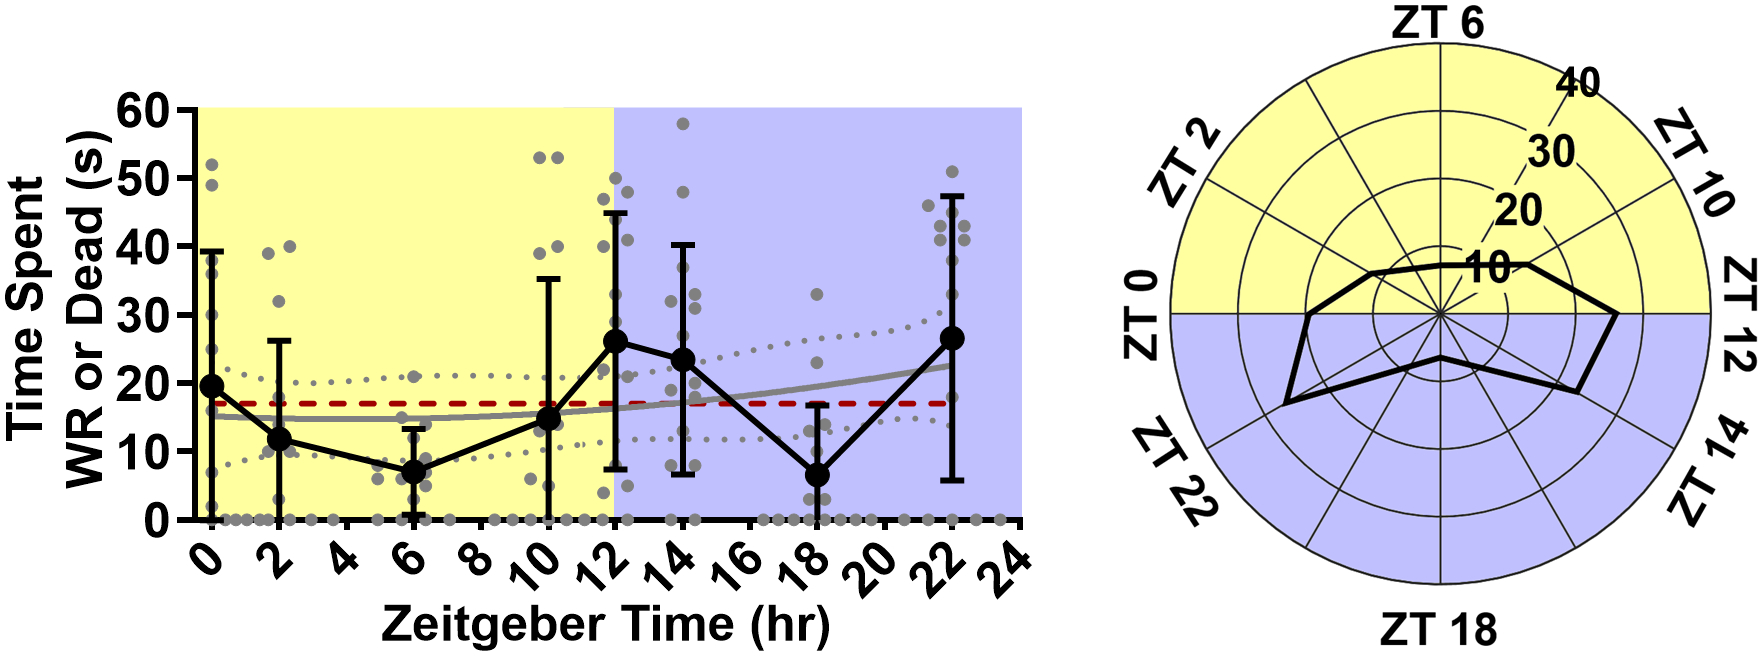
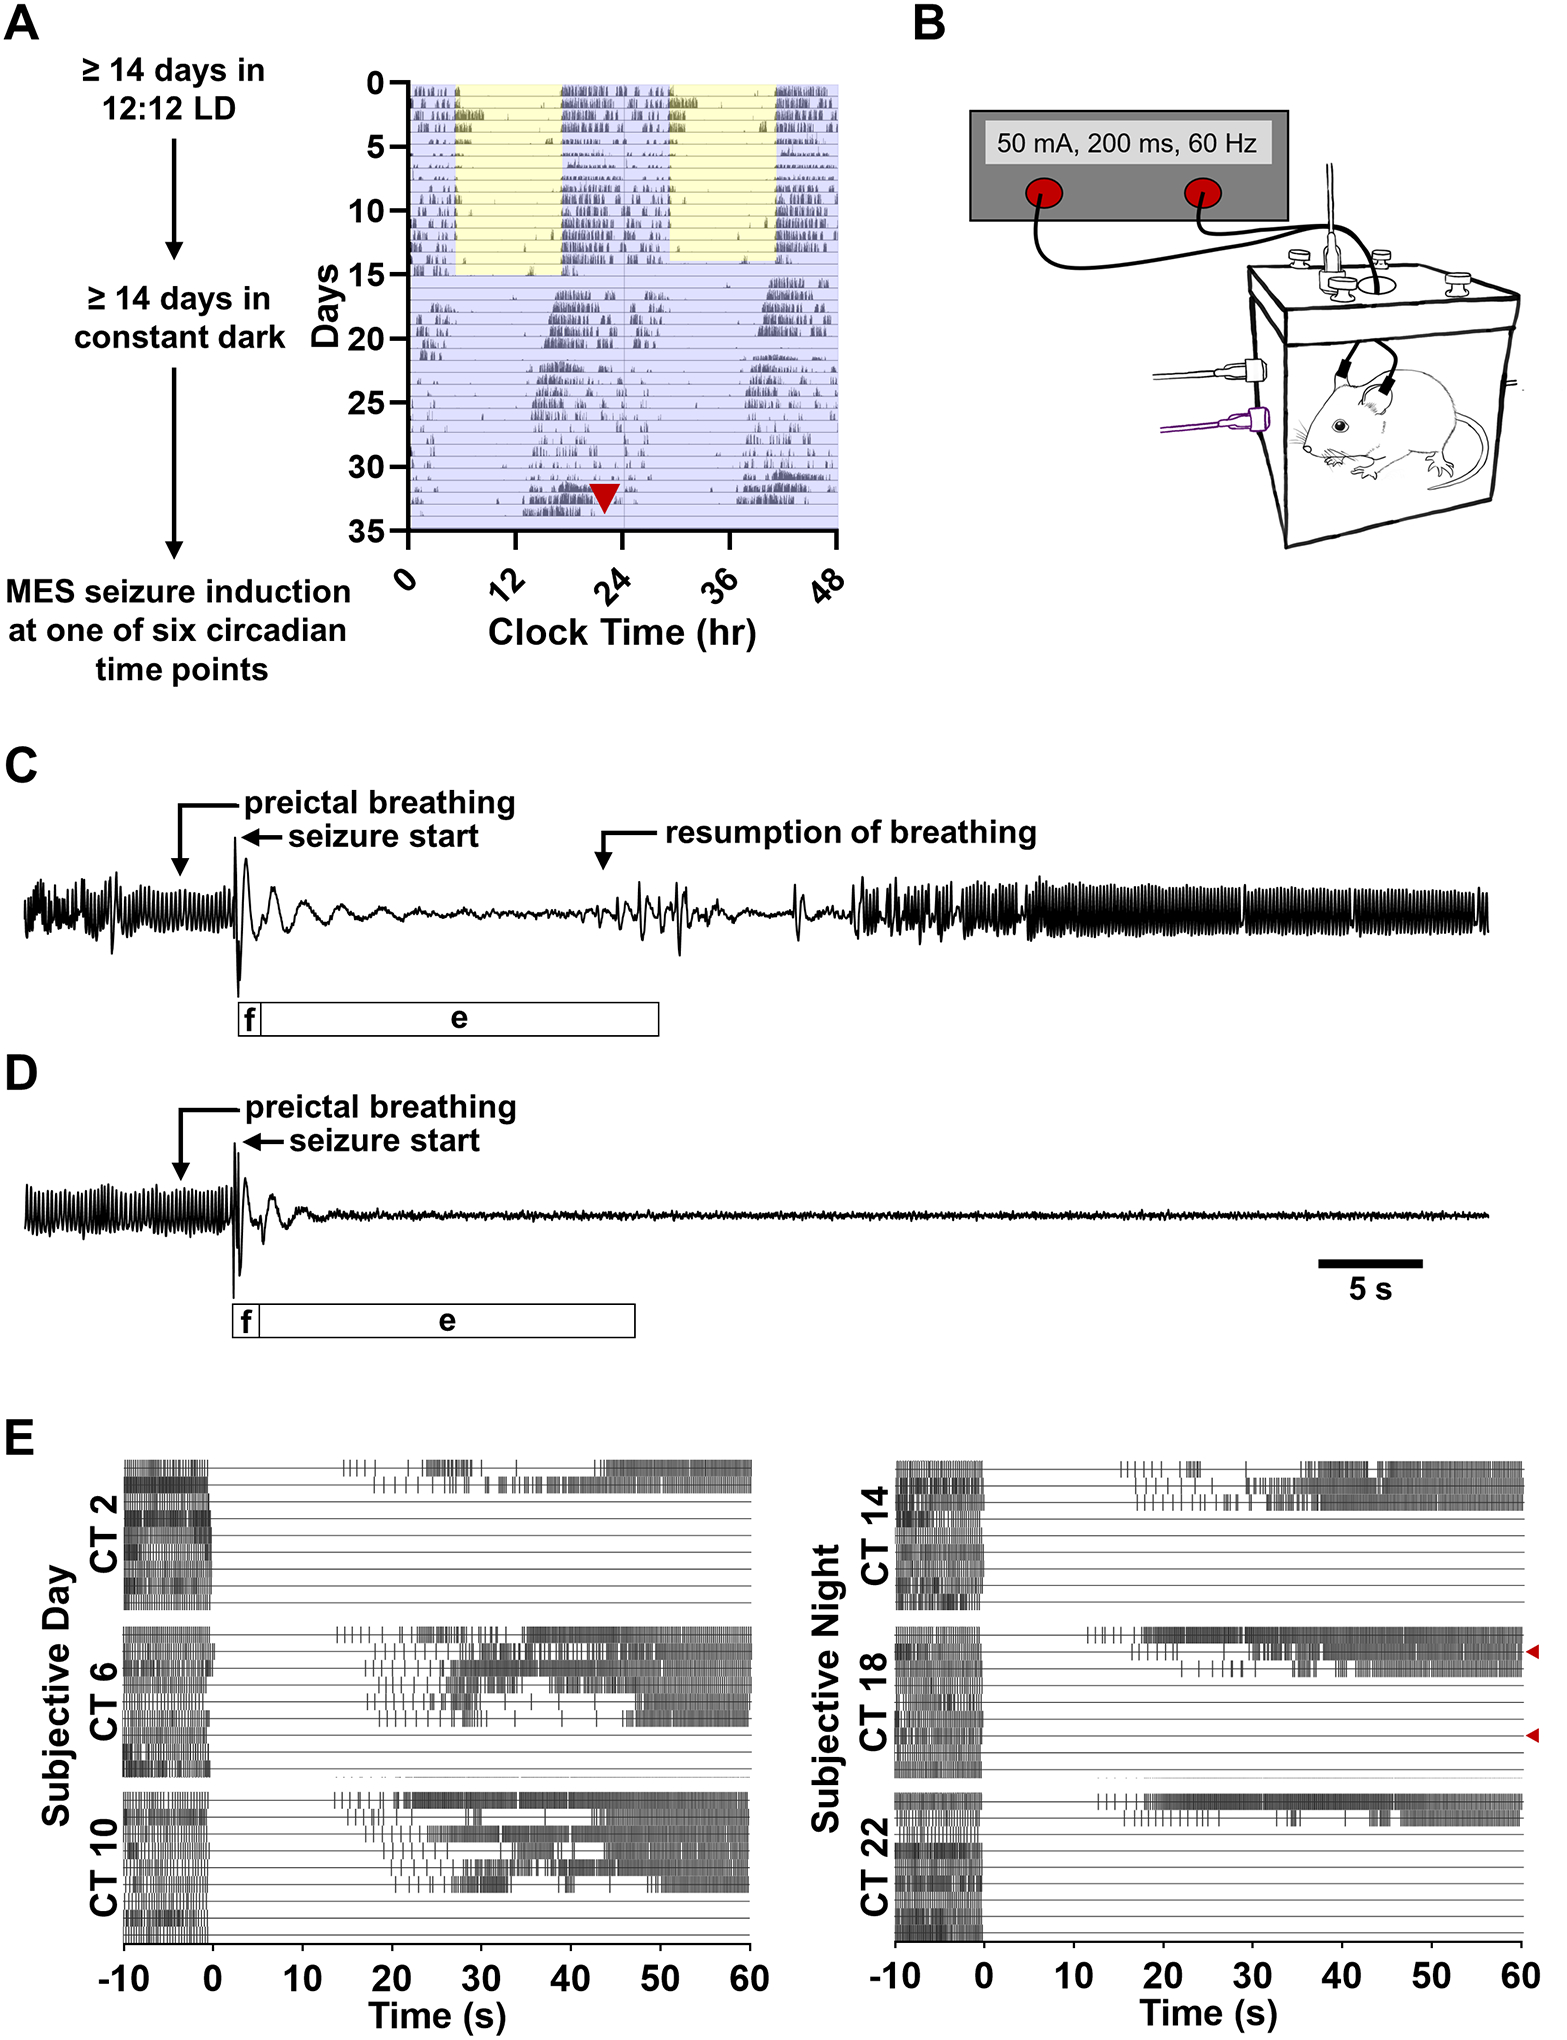
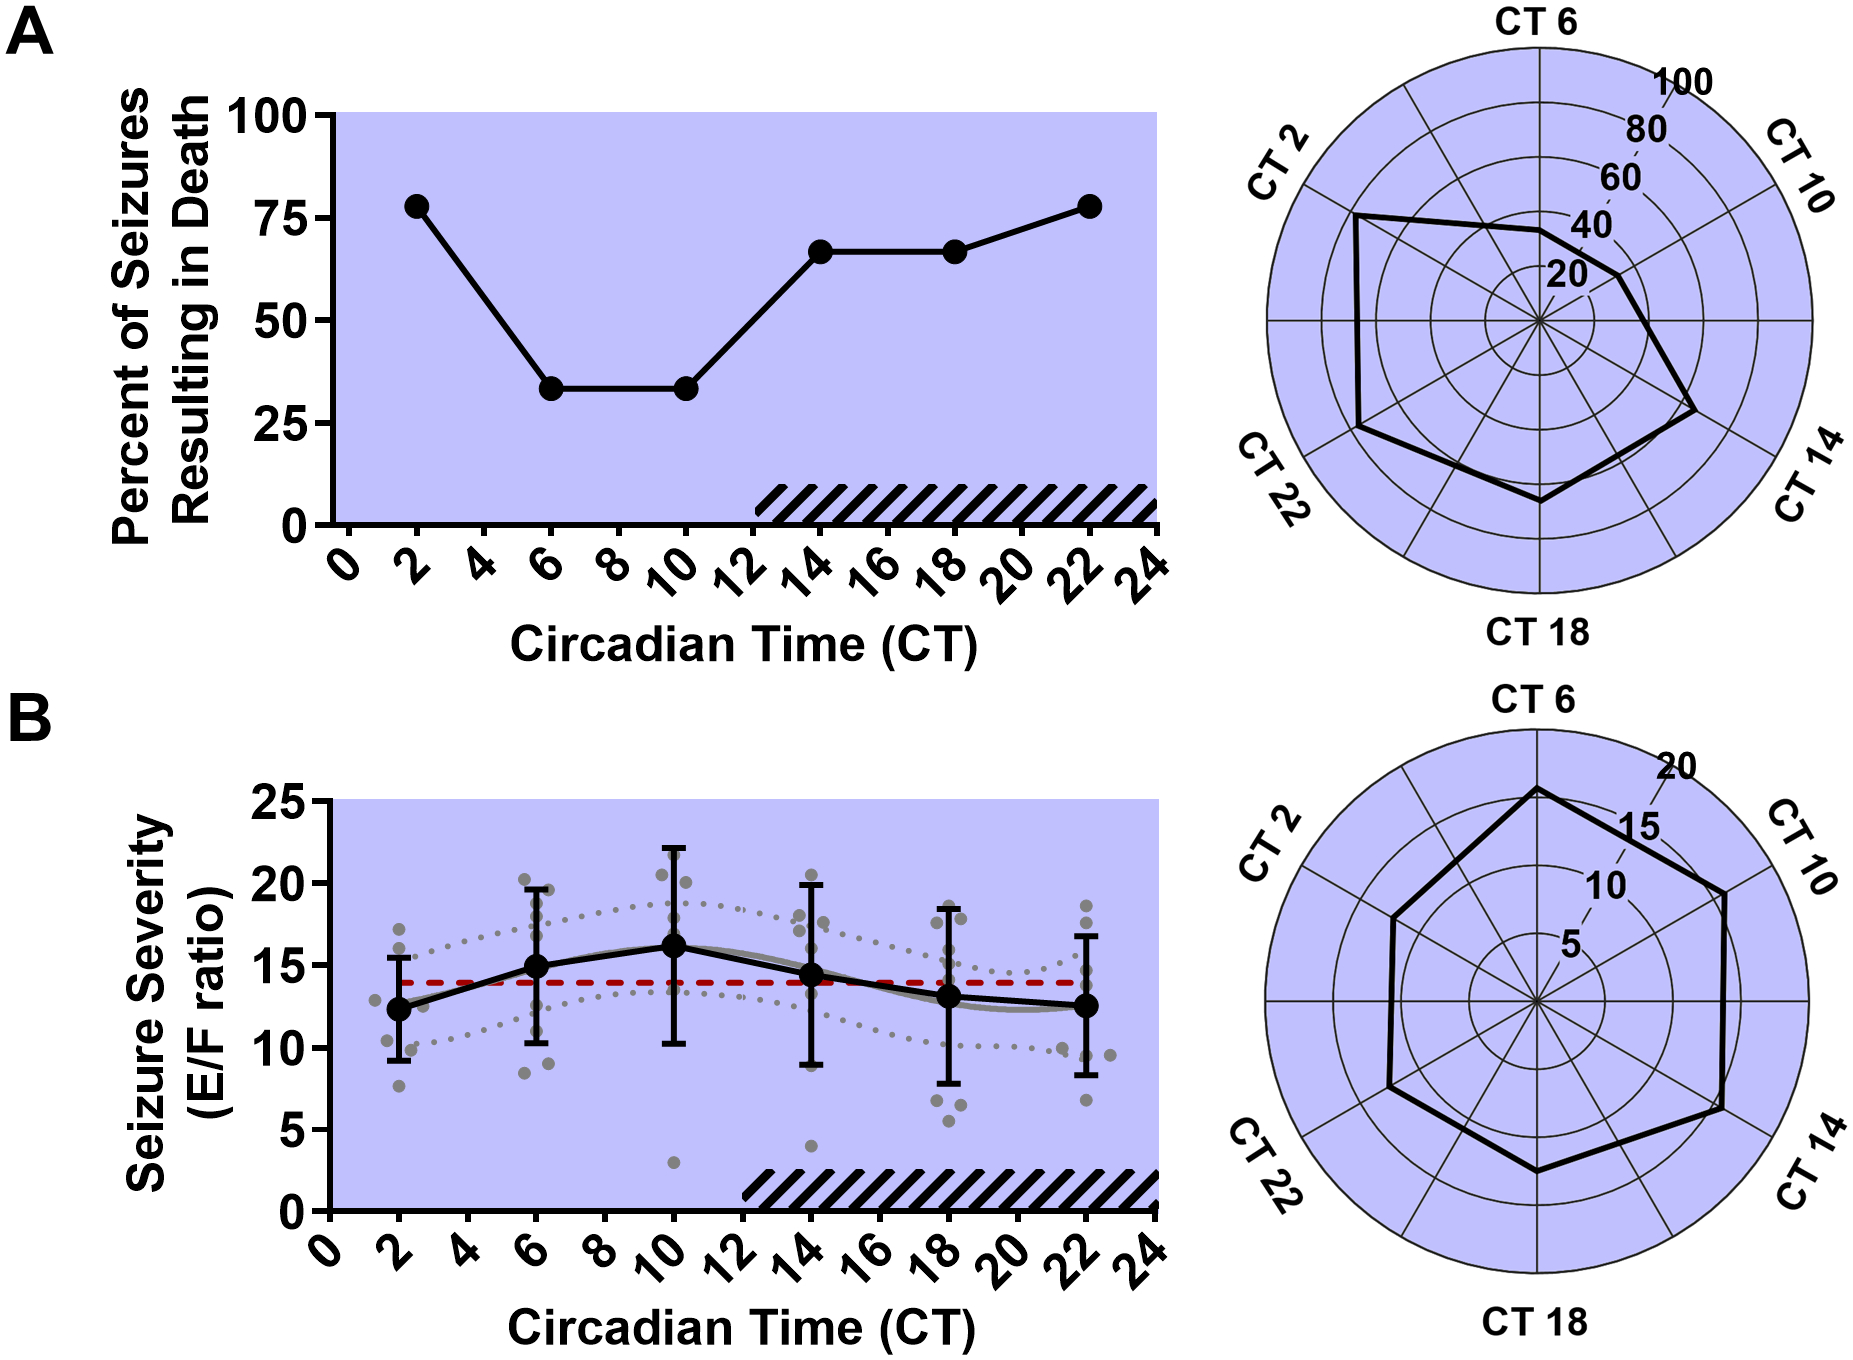
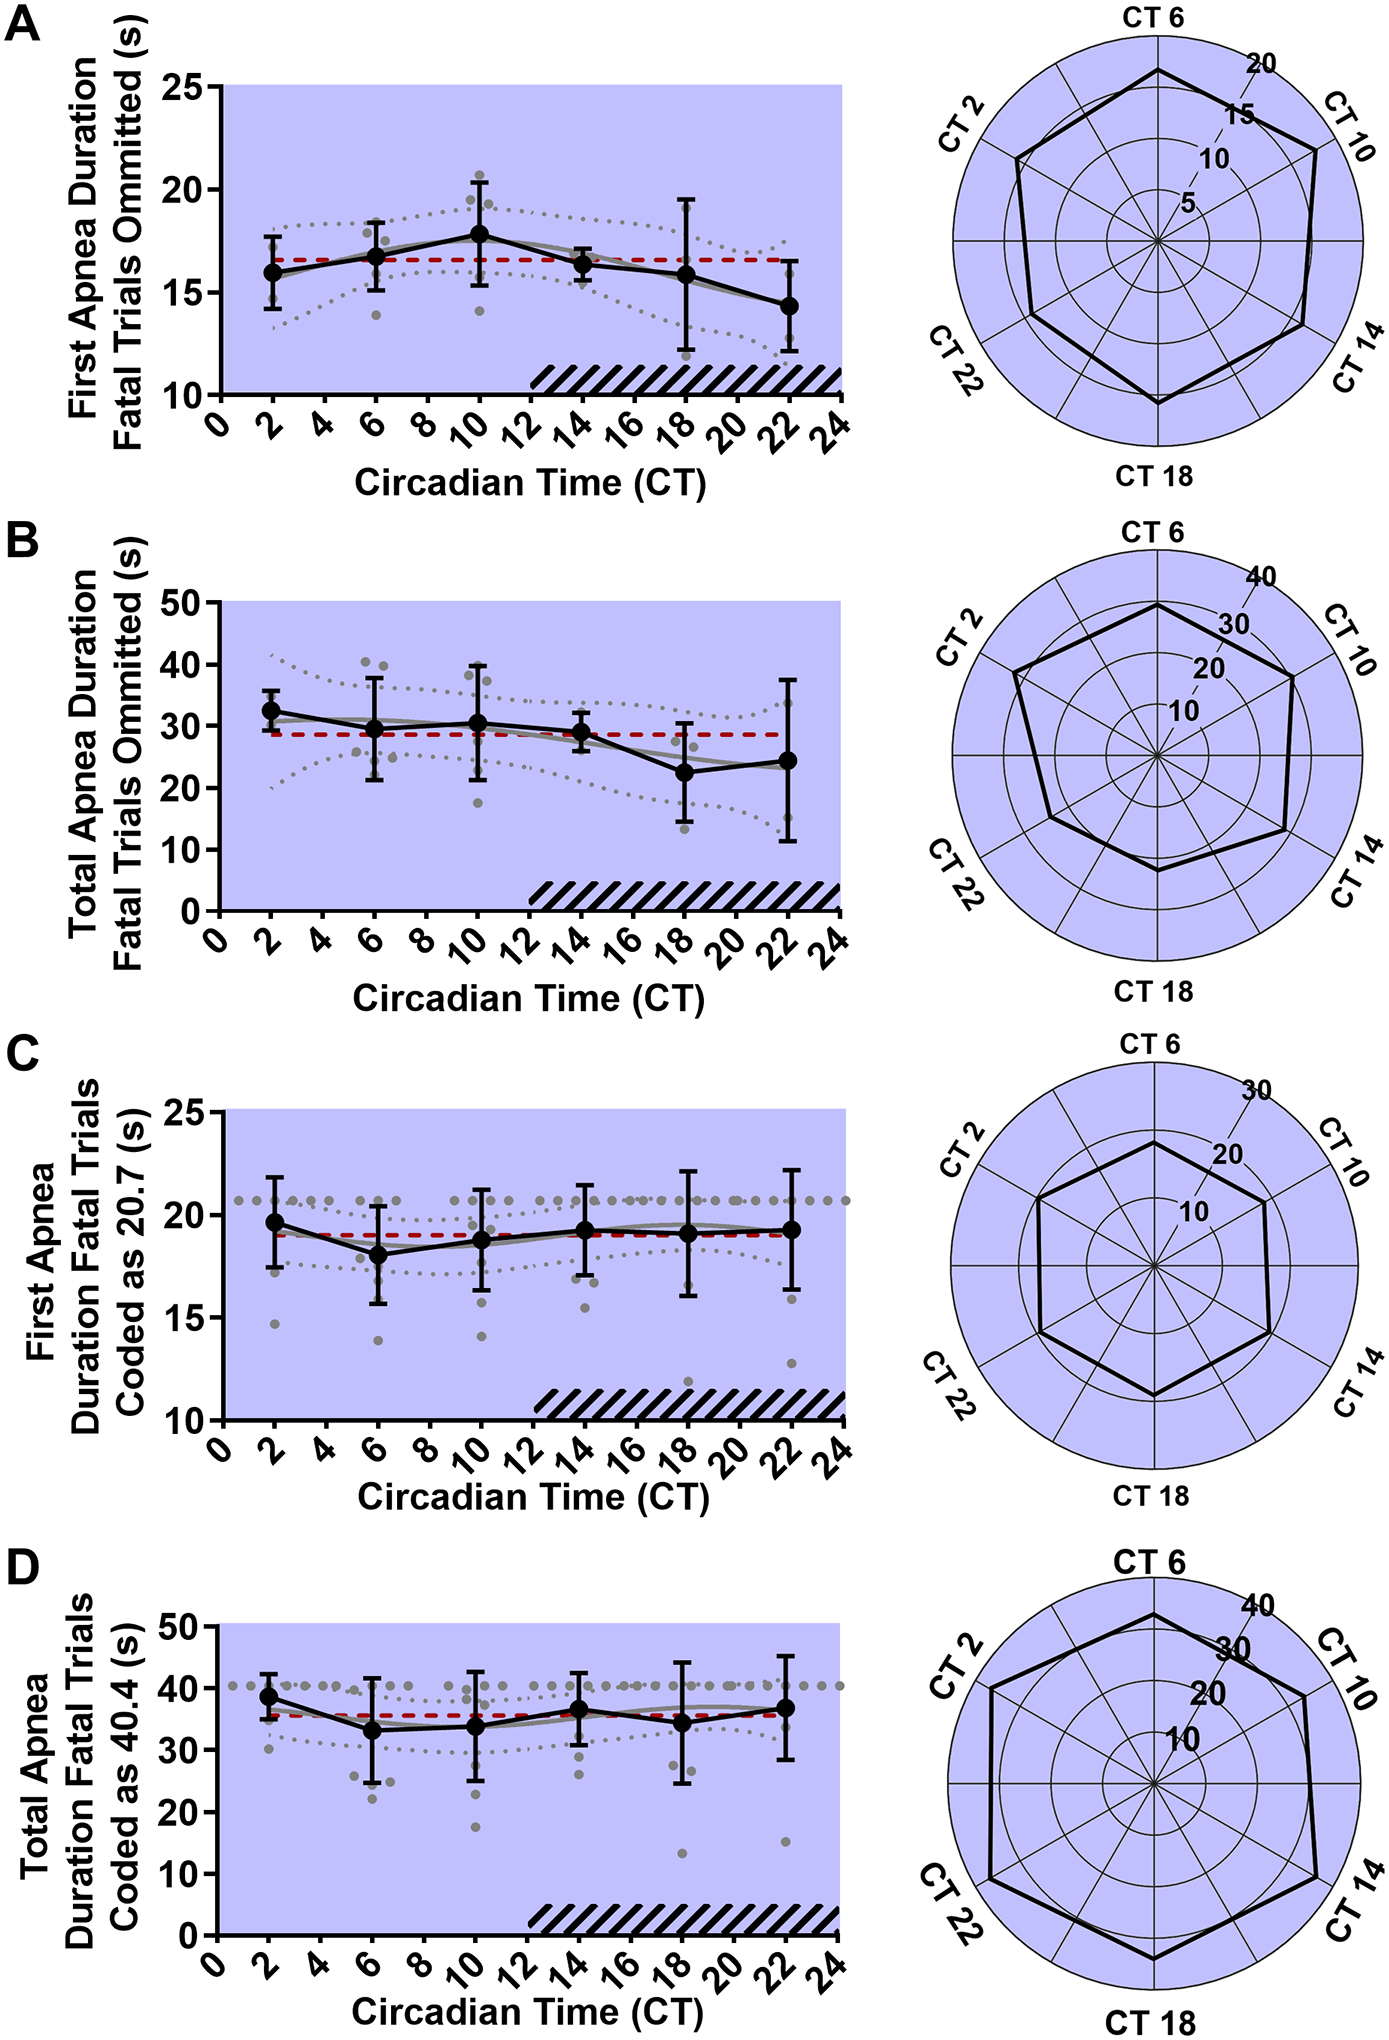
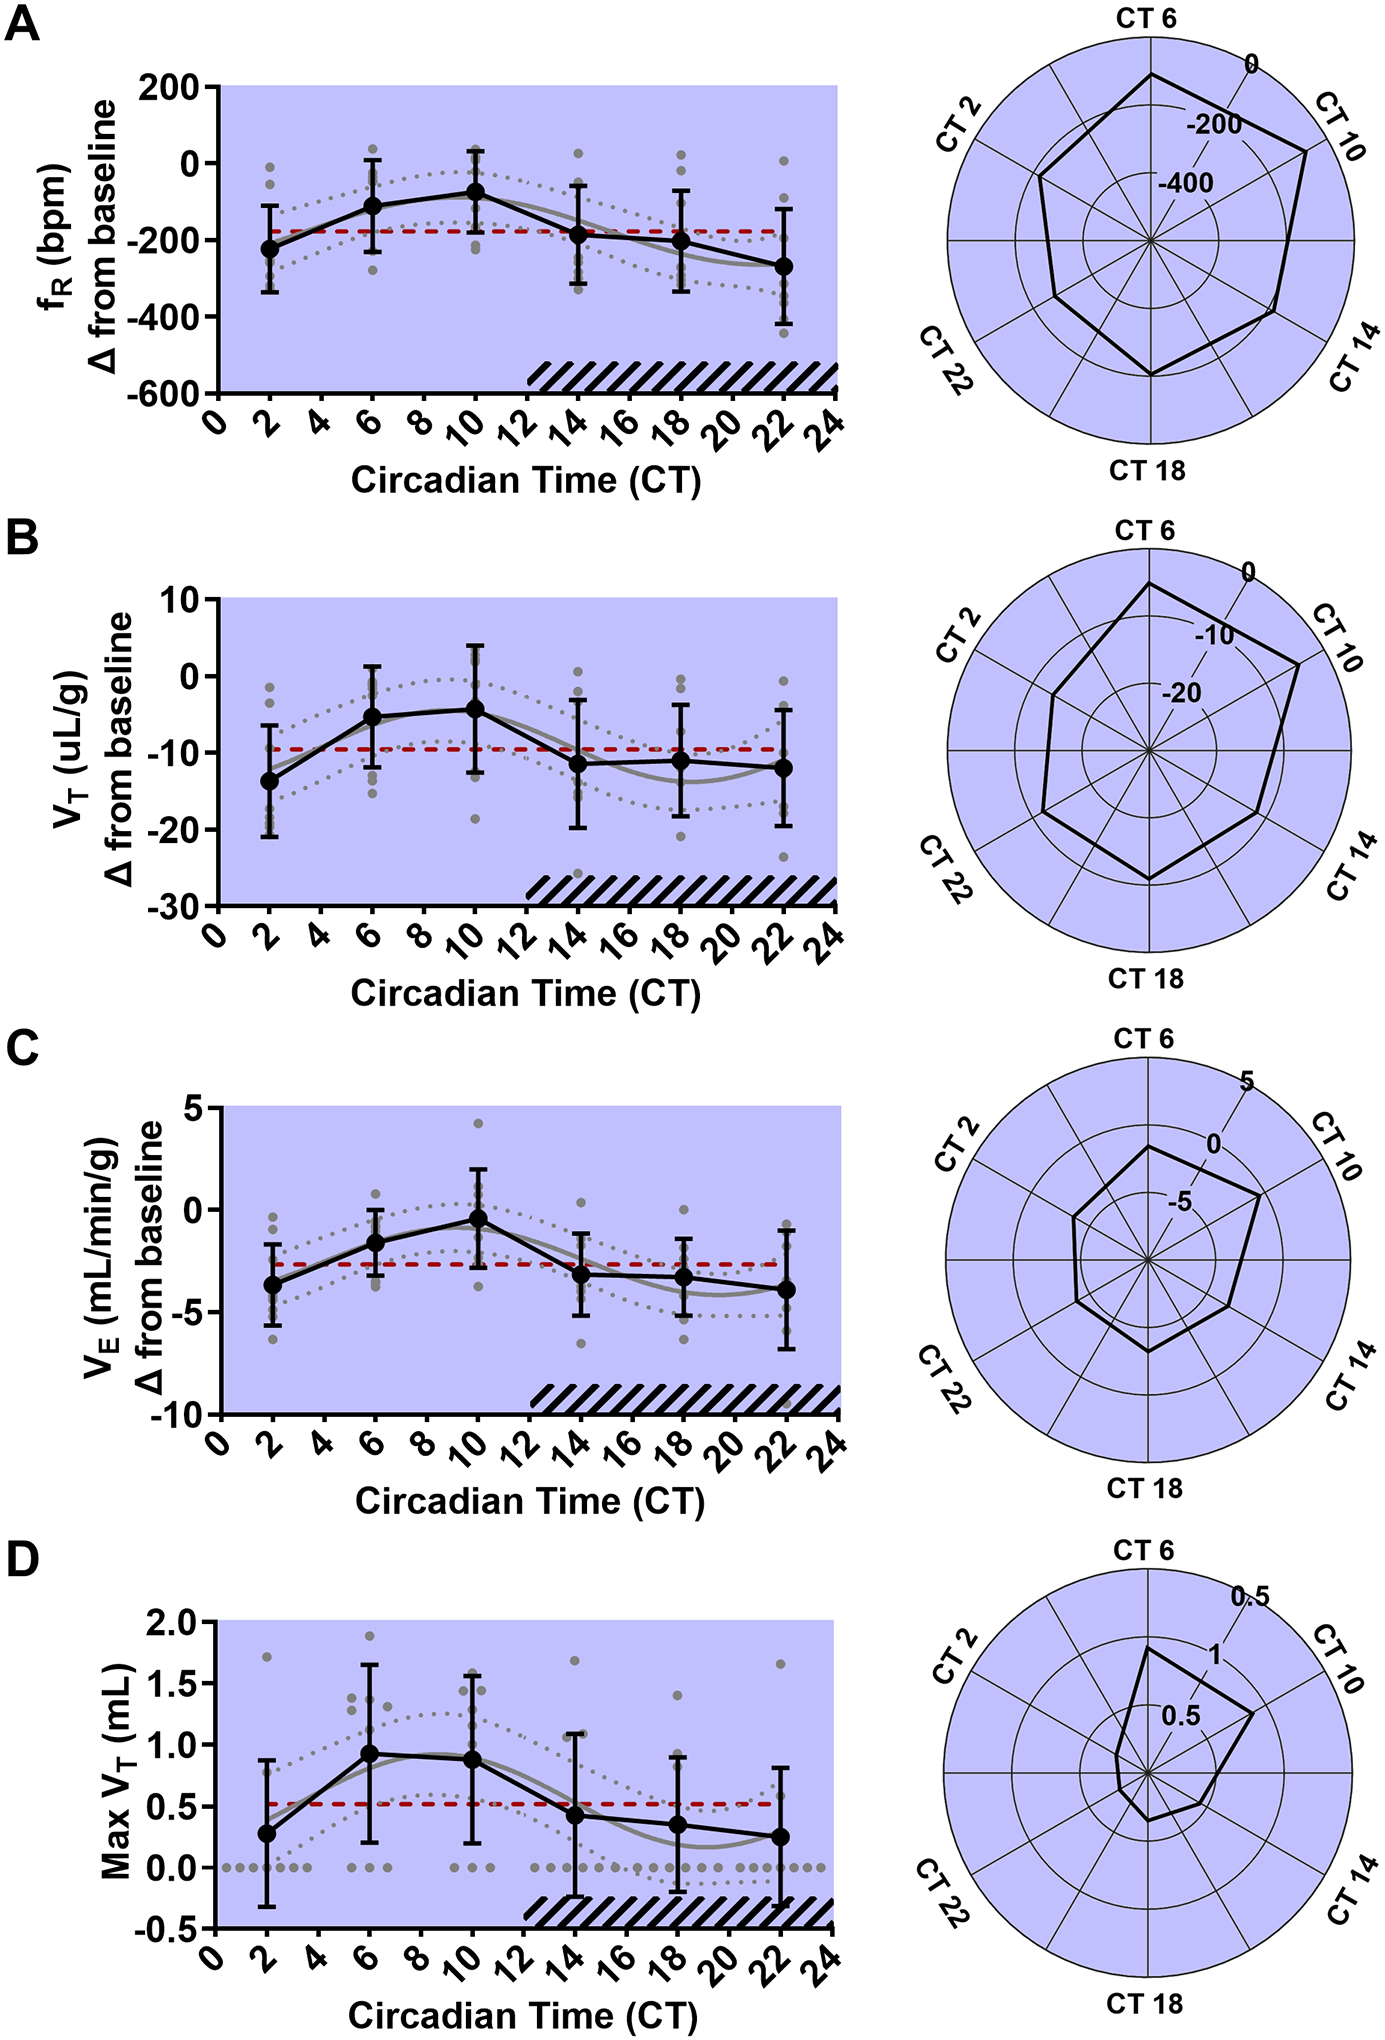
Sudden unexpected death in epilepsy (SUDEP) is the leading cause of premature death in patients with refractory epilepsy. SUDEP typically occurs during the night, although the reason for this is unclear. We found that, in normally entrained mice, time-of-day alters vulnerability to seizure-induced death. We found that, in free-running mice, circadian phase alters the vulnerability to seizure-induced death. These findings suggest that circadian rhythmicity may be responsible for the increased night-time prevalence of SUDEP ABSTRACT: Sudden unexpected death in epilepsy (SUDEP) is the leading cause of epilepsy-related death. SUDEP typically occurs during the night following a seizure. Many aspects of mammalian physiology are regulated by circadian rhythms in ways that might make seizures occuring during the night more dangerous. Using two mouse models of seizure-induced death, we demonstrate that time-of-day and circadian rhythms alter vulnerability to seizure-induced death. We exposed normally entrained DBA/1 mice to a potentially seizure-inducing acoustic stimulus at different times of day and compared the characteristics and outcomes of the seizures. Time-of-day did not alter the probability of a seizure but it did alter the probability of seizure-induced death. To determine whether circadian rhythms alter vulnerability to seizure-induced death, we induced maximal electroshock seizures in free-running C57BL/6J mice at different circadian time points at the same time as measuring breathing via whole body plethysmography. Circadian phase did not affect seizure severity but it did alter postictal respiratory outcomes and the probability of seizure-induced death. By contrast to our expectations, in entrained and free-running mice, vulnerability to seizure-induced death was greatest during the night and subjective night, respectively. These findings suggest that circadian rhythmicity may be responsible for the increased night-time prevalence of SUDEP and that the underlying mechanism is phase conserved between nocturnal and diurnal mammals. All of the seizures in the present study were induced during wakefulness, indicating that the effect of time point on vulnerability to seizure-induced death was not the result of sleep. Understanding why SUDEP occurs more frequently during the night may inform future preventative countermeasures.

Keywords: SUDEP; circadian rhythms; mortality; seizures.


Conflict of interest statement

Competing interests.

The authors declare that they have no competing interests.

Figures

Figure 1.
Figure 1.. Time-of-day alters the occurrence of seizure-induced death, but not wild running in DBA/1 mice.
(A) Diagrammatic representation of experiment 1. DBA/1 mice were exposed to a high intensity, broadband, acoustic stimulus for 60 s at one of eight times of day (ZT 0, 2, 6, 10, 12, 14, 18, and 22; n = 15 per time point). A subset of animals exhibited seizures characterized by wild running. A subset of animals which experienced seizures then underwent seizure-induced death characterized by tonic hindlimb extension while others recovered. (B) Timelines illustrating the progression of seizure trials in DBA/1 mice. Each horizontal line corresponds to an individual trial. Each horizontal section depicts seizure trials conducted at a specific zeitgeber time (ZT, n = 15 per time point). Segments of time are color coded in relation the animals behavior: no seizure activity, white (time points in light) or gray (time points in darkness); wild running, orange; seizure-induced death, red. Within each ZT section trials are arranged in order of wild running onset. (C) Line graph (left) and rose plot (right) depicting percent of total trials resulting in wild running (dashed gray line) or seizure-induced death (solid black line) at different times of day in animals entrained to normal light-dark conditions (A, n = 15 per time point). (D) Line graph (left) and rose plot (right) depicting percent of trials which resulted in a seizure that ended in seizure-induced death (B, n = 7–13 per time point).
Figure 2.
Figure 2.. Time-of-day does not affect latency to wild running, latency to seizure-induced death, number of wild running bouts, or wild running duration.
Line graph (left) and rose plot (right) depicting latency to wild running (A, n = 7–13 per time point). Line graph (left) and rose plot (right) depicting latency to seizure-induced death (B, n = 2–9 per time point). Line graph (left) and rose plot (right) depicting number of wild running episodes (C, n = 15 per time point). Line graph (left) and rose plot (right) depicting wild running duration (D, n = 15 per time point). All data is plotted as mean with standard deviation (black line), with individual values for continuous variables (grey circles). The cosinor line of best fit is depicted as a gray curve with 95% confidence intervals (dotted gray curves). The midline estimating statistic of rhythm (MESOR) is illustrated with a dashed red line.
Figure 3.
Figure 3.. Time-of-day does not affect time spent wild running and in respiratory arrest.
Line graph (left) and rose plot (right) depicting time spent wild running and in respiratory arrest. plotted as mean with standard deviation (black line), with individual values (grey circles, n = 15 per time point). The cosinor line of best fit is depicted as a gray curve with 95% confidence intervals (dotted gray curves). The midline estimating statistic of rhythm (MESOR) is illustrated with a dashed red line.
Figure 4.
Figure 4.. Maximal electroshock (MES) seizures result in seizure-induced respiratory arrest and death.
(A) Diagrammatic representation of experiment 2. C57BL/6J mice were normally entrained to 12:12 LD conditions for ≥ 14 days before being released into constant darkness. Mice free-ran for ≥ 14 days before a MES seizure trial in a plethysmography chamber at one of six circadian time points. Wheel running data was used to track the free-running rhythmicity of each animal so that seizures trials could be appropriately timed. Red arrowhead indicates the time at which the animal was removed from its home cage for the seizure trial. (B) Schematic of the experimental apparatus used to induce MES seizures concomitant to whole body plethysmography. Plethysmography traces depicting 10 s of preictal breathing followed by the respiratory sequelae of a non-fatal (C) and fatal (D) MES seizure. Labels above each trace highlight notable respiratory features ascertained from the plethysmography trace. Bars below each trace depict the duration of the flexion and extension components of the motor seizure ascertained from video, labeled ‘f’ and ‘e’ respectively. (E) Raster plots depicting the timing of breaths before and after MES seizure induction. Each horizontal line corresponds to an individual trial. Each horizontal section depicts seizure trials conducted at a specific circadian time (CT, n = 9 per time point). Each vertical hash-mark corresponds to a breath as detected by whole body plethysmography. Within each CT section trials are arranged in order of first postictal breath. Red arrowheads indicate the non-fatal and fatal seizure trials depicted in panels C-D.
Figure 5.
Figure 5.. Circadian phase alters the occurrence of seizure-induced death, but does not affect seizure severity following MES seizures.
Line graph (left) and rose plot (right) depicting percent of total trials resulting in seizure-induced death (solid black line) at different circadian phases in animals kept in free-running conditions (A, n = 9 per time point). Line graph (left) and rose plot (right) depicting seizure severity as measured by extension/flexion ratio plotted as mean with standard deviation (black line), with individual values for continuous variables (grey circles). The cosinor line of best fit is depicted as a gray curve with 95% confidence intervals (dotted gray curves). The midline estimating statistic of rhythm (MESOR) is illustrated with a dashed red line. Time points during the subjective night are indicated with diagonal hash-marks.
Figure 6.
Figure 6.. Circadian phase does not affect first apnea duration or total apnea duration following MES seizures.
Line graph (left) and rose plot (right) depicting first apnea duration of surviving animals (A, n = 2–6 per time point). Line graph (left) and rose plot (right) depicting total apnea duration of surviving animals (B, n = 2–6 per time point). Line graph (left) and rose plot (right) depicting first apnea duration of all animals. Fatal seizures have been coded as having a first apnea duration equal to largest of surviving animals of (20.7 s, C, n = 9 per time point). Line graph (left) and rose plot (right) depicting total apnea duration of all animals. Fatal seizures have been coded as having a total apnea duration equal to largest of surviving animals of (40.4 s, D, n = 9 per time point). Values are plotted as mean with standard deviation (black line), with individual values for continuous variables (grey circles). The cosinor line of best fit is depicted as a gray curve with 95% confidence intervals (dotted gray curves). The midline estimating statistic of rhythm (MESOR) is illustrated with a dashed red line. Time points during the subjective night are indicated with diagonal hash-marks.
Figure 7.
Figure 7.. Circadian phase alters postictal breathing following MES seizures.
Line graphs (left) and rose plots (right) depicting postictal changes in respiratory frequency (fR) in breaths per minute (bpm), tidal volume (VT), and ventilation (VE) at different circadian time points following MES seizures (A-C, n = 9 per time point). Line graphs (left) and rose plots (right) depicting the largest postictal breath. Values are plotted as mean with standard deviation (black line), with individual values for continuous variables (grey circles). The cosinor line of best fit is depicted as a gray curve with 95% confidence intervals (dotted gray curves). The midline estimating statistic of rhythm (MESOR) is illustrated with a dashed red line. Time points during the subjective night are indicated with diagonal hash-marks.

Comment in

References

    1. Ali A, Wu S, Issa NP, Rose S, Towle VL, Warnke P, Tao JX (2017) Association of sleep with sudden unexpected death in epilepsy. Epilepsy Behav 76:1–6. - PubMed
    1. Anderson RE, Howard RA, Woodbury DM (1986) Correlation between effects of acute acetazolamide administration to mice on electroshock seizure threshold and maximal electroshock seizure pattern, and on carbonic anhydrase activity in subcellular fractions of brain. Epilepsia 27:504–509. - PubMed
    1. Baud MO, Kleen JK, Mirro EA, Andrechak JC, King-Stephens D, Chang EF, Rao VR (2018) Multi-day rhythms modulate seizure risk in epilepsy. Nat Commun 9:88. - PMC - PubMed
    1. Bolles RC, Duncan PM (1969) Daily course of activity and subcutaneous body temperature in hungry and thirsty rats. Physiology & Behavior 4:87–89.
    1. Bou Assi E, Nguyen DK, Rihana S, Sawan M (2017) Towards accurate prediction of epileptic seizures: A review. Biomedical Signal Processing and Control 34:144–157.

Publication types