

Quantitative T2 -mapping magnetic resonance imaging for assessment of muscle motor unit recruitment patterns
- PMID: 33501678
- PMCID: PMC8053673
- DOI: 10.1002/mus.27186
Quantitative T2 -mapping magnetic resonance imaging for assessment of muscle motor unit recruitment patterns
Abstract
Introduction: In this study, we aimed to determine whether muscle transverse relaxation time (T2 ) magnetic resonance (MR) mapping results correlate with motor unit loss, as defined by motor unit recruitment patterns on electromyography (EMG).
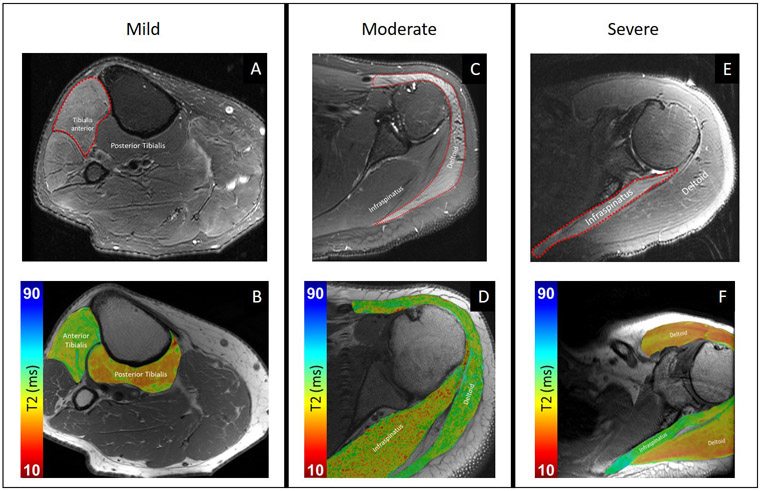
Methods: EMG and 3-Tesla MRI exams were acquired no more than 31 days apart in subjects referred for peripheral nerve MRI. Two musculoskeletal radiologists qualitatively graded T2 -weighted, fat-suppressed sequences for severity of muscle edema-like patterns and manually placed regions of interest within muscles to obtain T2 values from T2 -mapping sequences. Concordance was calculated between qualitative and quantitative MR grades and EMG recruitment categories (none, discrete, decreased) as well as interobserver agreement for both MR grades.
Results: Thirty-four muscles (21 abnormal, 13 control) were assessed in 13 subjects (5 females and 8 males; mean age, 46 years) with 14 EMG-MRI pairs. T2 -relaxation times were significantly (P < .001) increased in all EMG recruitment categories compared with control muscles. T2 differences were not significant between EMG grades of motor unit recruitment (P = .151-.702). T2 and EMG score concordance was acceptable (Harrell's concordance index [c index]: rater A, 0.71; 95% confidence interval [CI], 0.51-0.87; rater B, 0.77; 95% CI, 0.57-0.91). Qualitative MRI and EMG score concordance was poor to acceptable (c index: rater A, 0.60; 95% CI, 0.50-0.79; rater B, 0.72; 95% CI, 0.55-0.89). T2 values had moderate-to-substantial ability to distinguish between absent vs incomplete (ie, decreased or discrete) motor unit recruitment (c index: rater A, 0.78; 95% CI, 0.50-1.00; rater B, 0.86; 95% CI, 0.57-1.00).
Discussion: Quantitative T2 MR muscle mapping is a promising tool for noninvasive evaluation of the degree of motor unit recruitment loss.
Keywords: MRI; T2 mapping; electromyography; muscle; musculoskeletal.
© 2021 Wiley Periodicals LLC.
Conflict of interest statement
Figures
References
-
- Fuglsang-Frederiksen A, Johnsen B, Vingtoft S, et al. Variation in per- formance of the EMG examination at six European laboratories. Elec- troencephalogr Clin Neurophysiol. 1995;97:444–450. - PubMed
-
- McDonald CM, Carter GT, Fritz RC, Anderson MW, Abresch RT, Kilmer DD. Magnetic resonance imaging of denervated muscle: com- parison to electromyography. Muscle Nerve. 2000;23:1431–1434. - PubMed
-
- Polak JF, Jolesz FA, Adams DF. Magnetic resonance imaging of skele- tal muscle. Prolongation of T1 and T2 subsequent to denervation. Invest Radiol. 1988;23:365–369. - PubMed
-
- Kim SJ, Hong SH, Jun WS, et al. MR imaging mapping of skeletal mus- cle denervation in entrapment and compressive neuropathies. Radio- graphics. 2011;31:319–332. - PubMed
Publication types
MeSH terms
Grants and funding
LinkOut - more resources
Full Text Sources
Other Literature Sources
Medical
