. 2021 Feb 10;143(5):2304-2314.
doi: 10.1021/jacs.0c11382. Epub 2021 Jan 27.

Voltage Imaging with a NIR-Absorbing Phosphine Oxide Rhodamine Voltage Reporter

Voltage Imaging with a NIR-Absorbing Phosphine Oxide Rhodamine Voltage Reporter

Monica A Gonzalez et al. J Am Chem Soc. .

Abstract

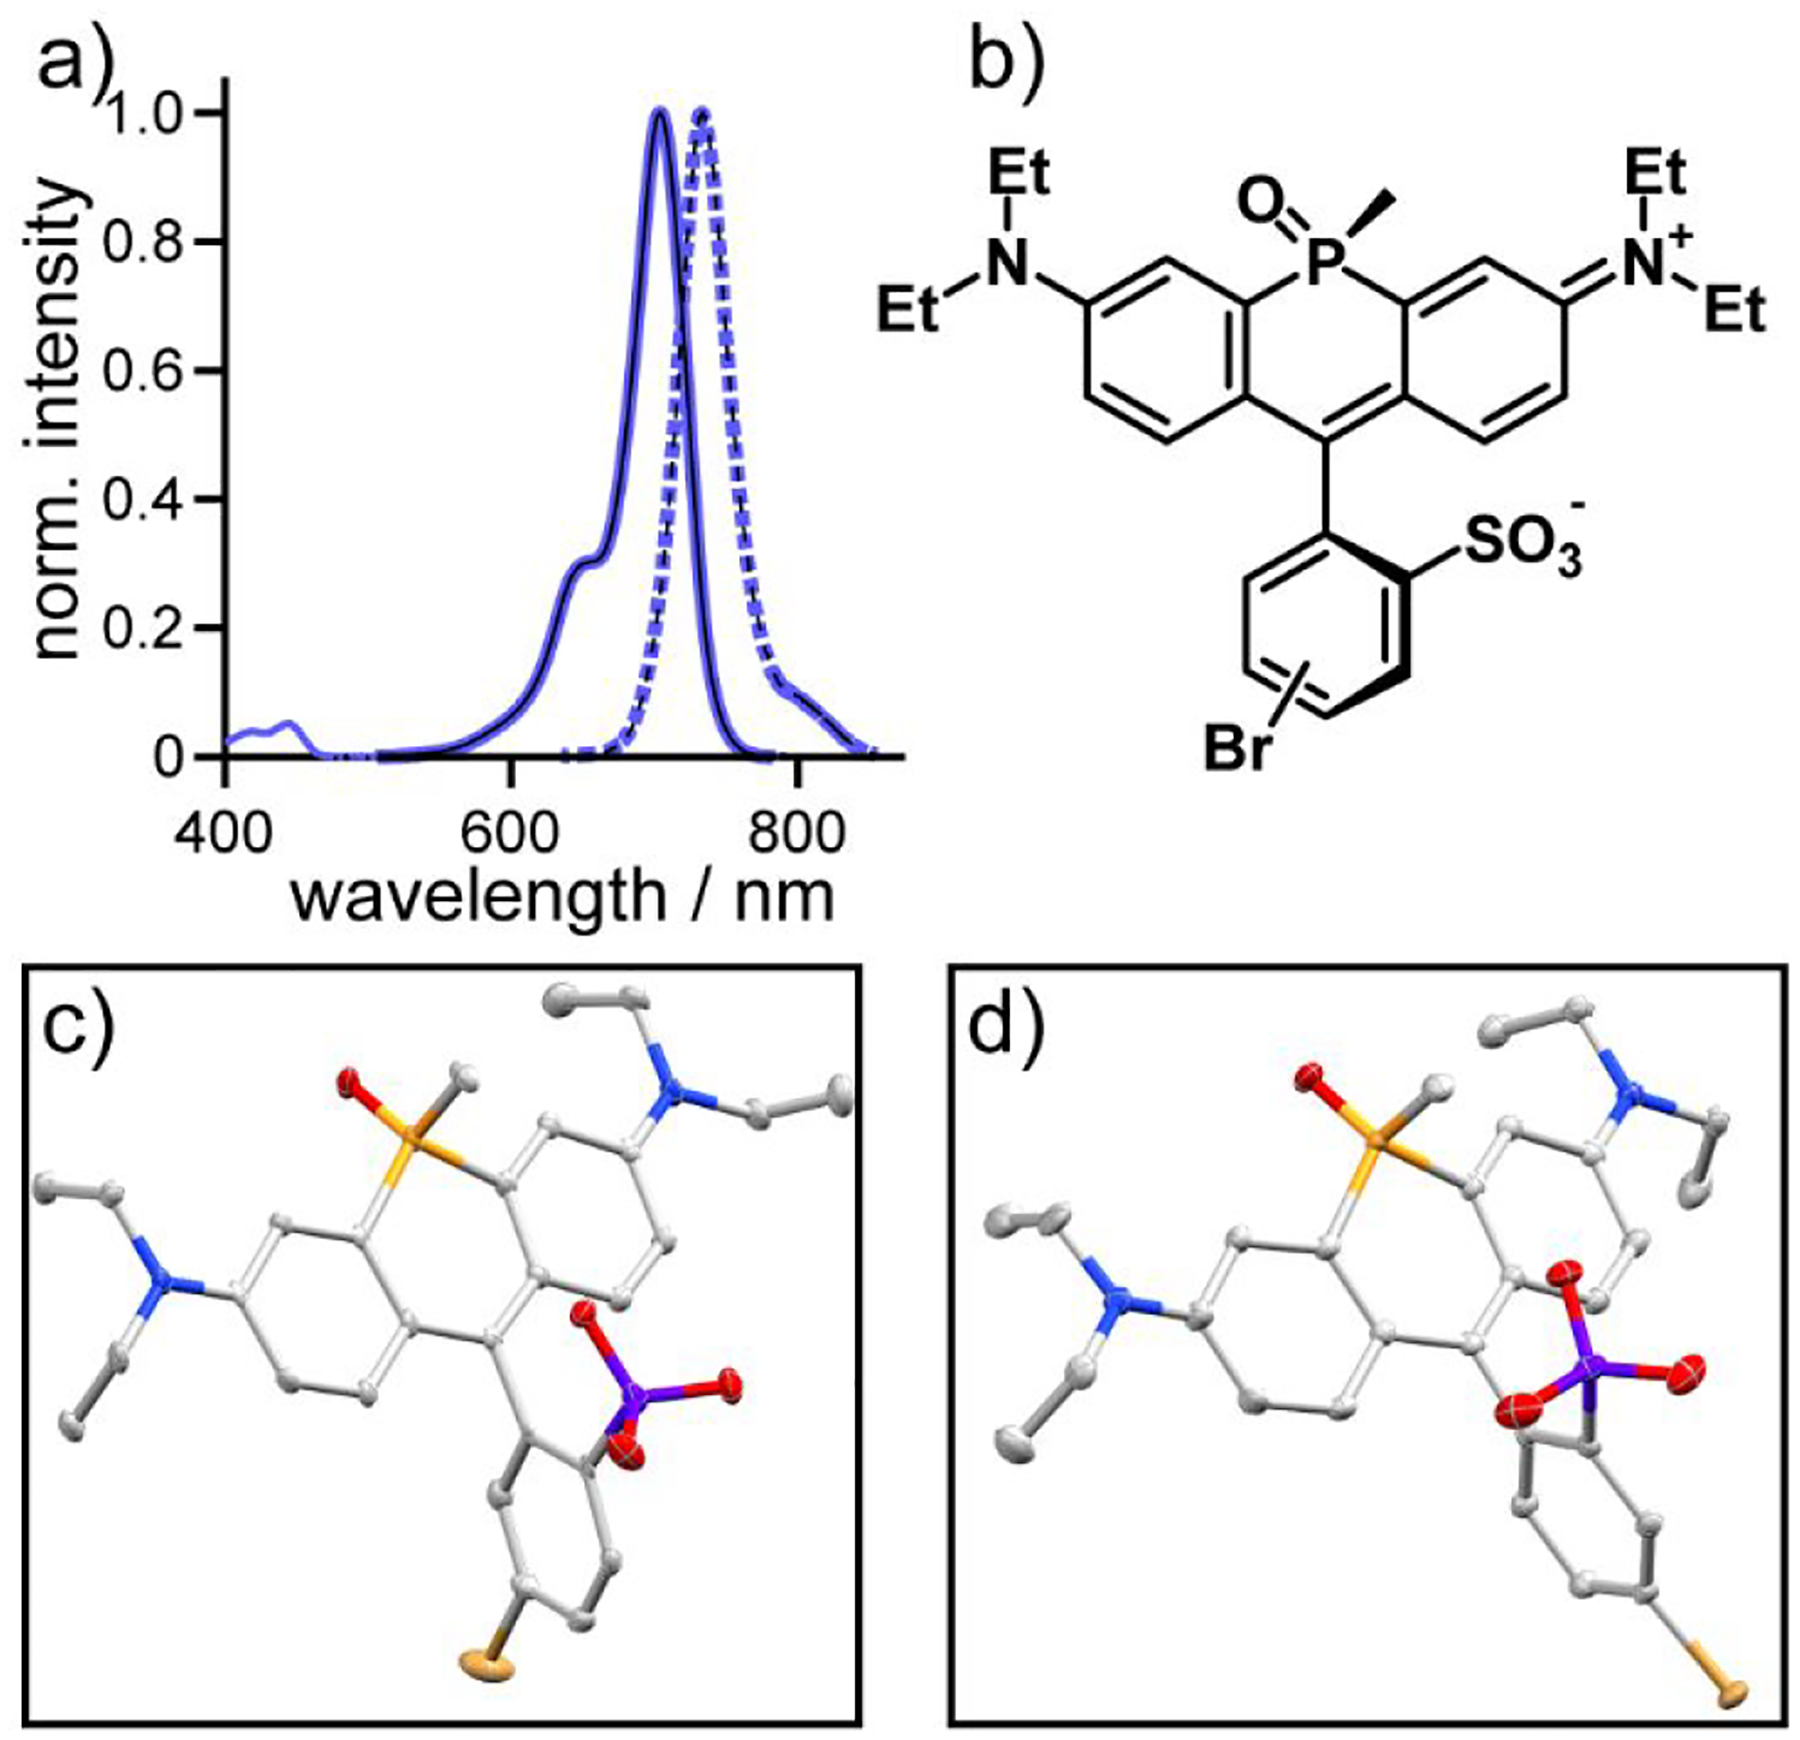
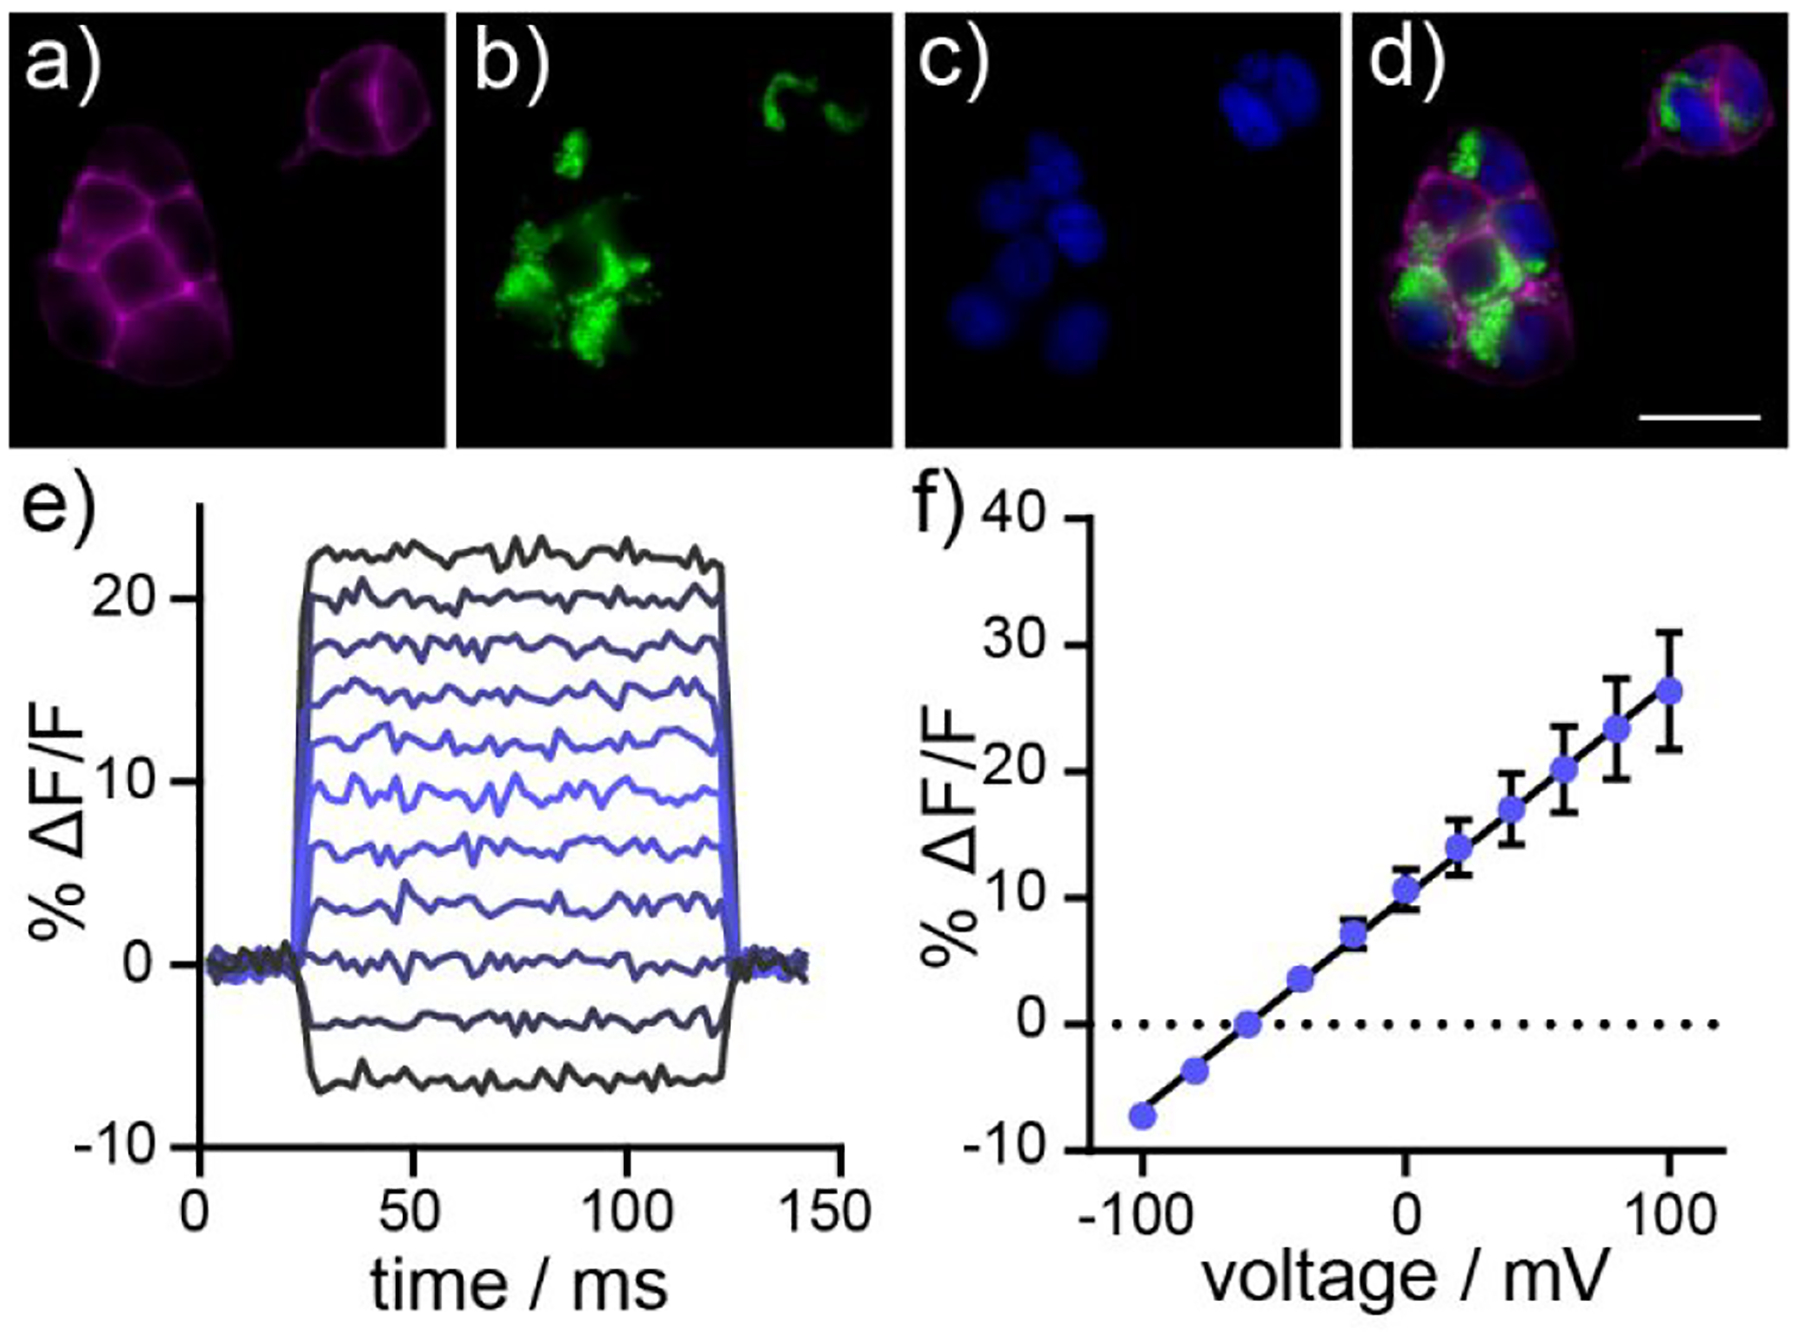
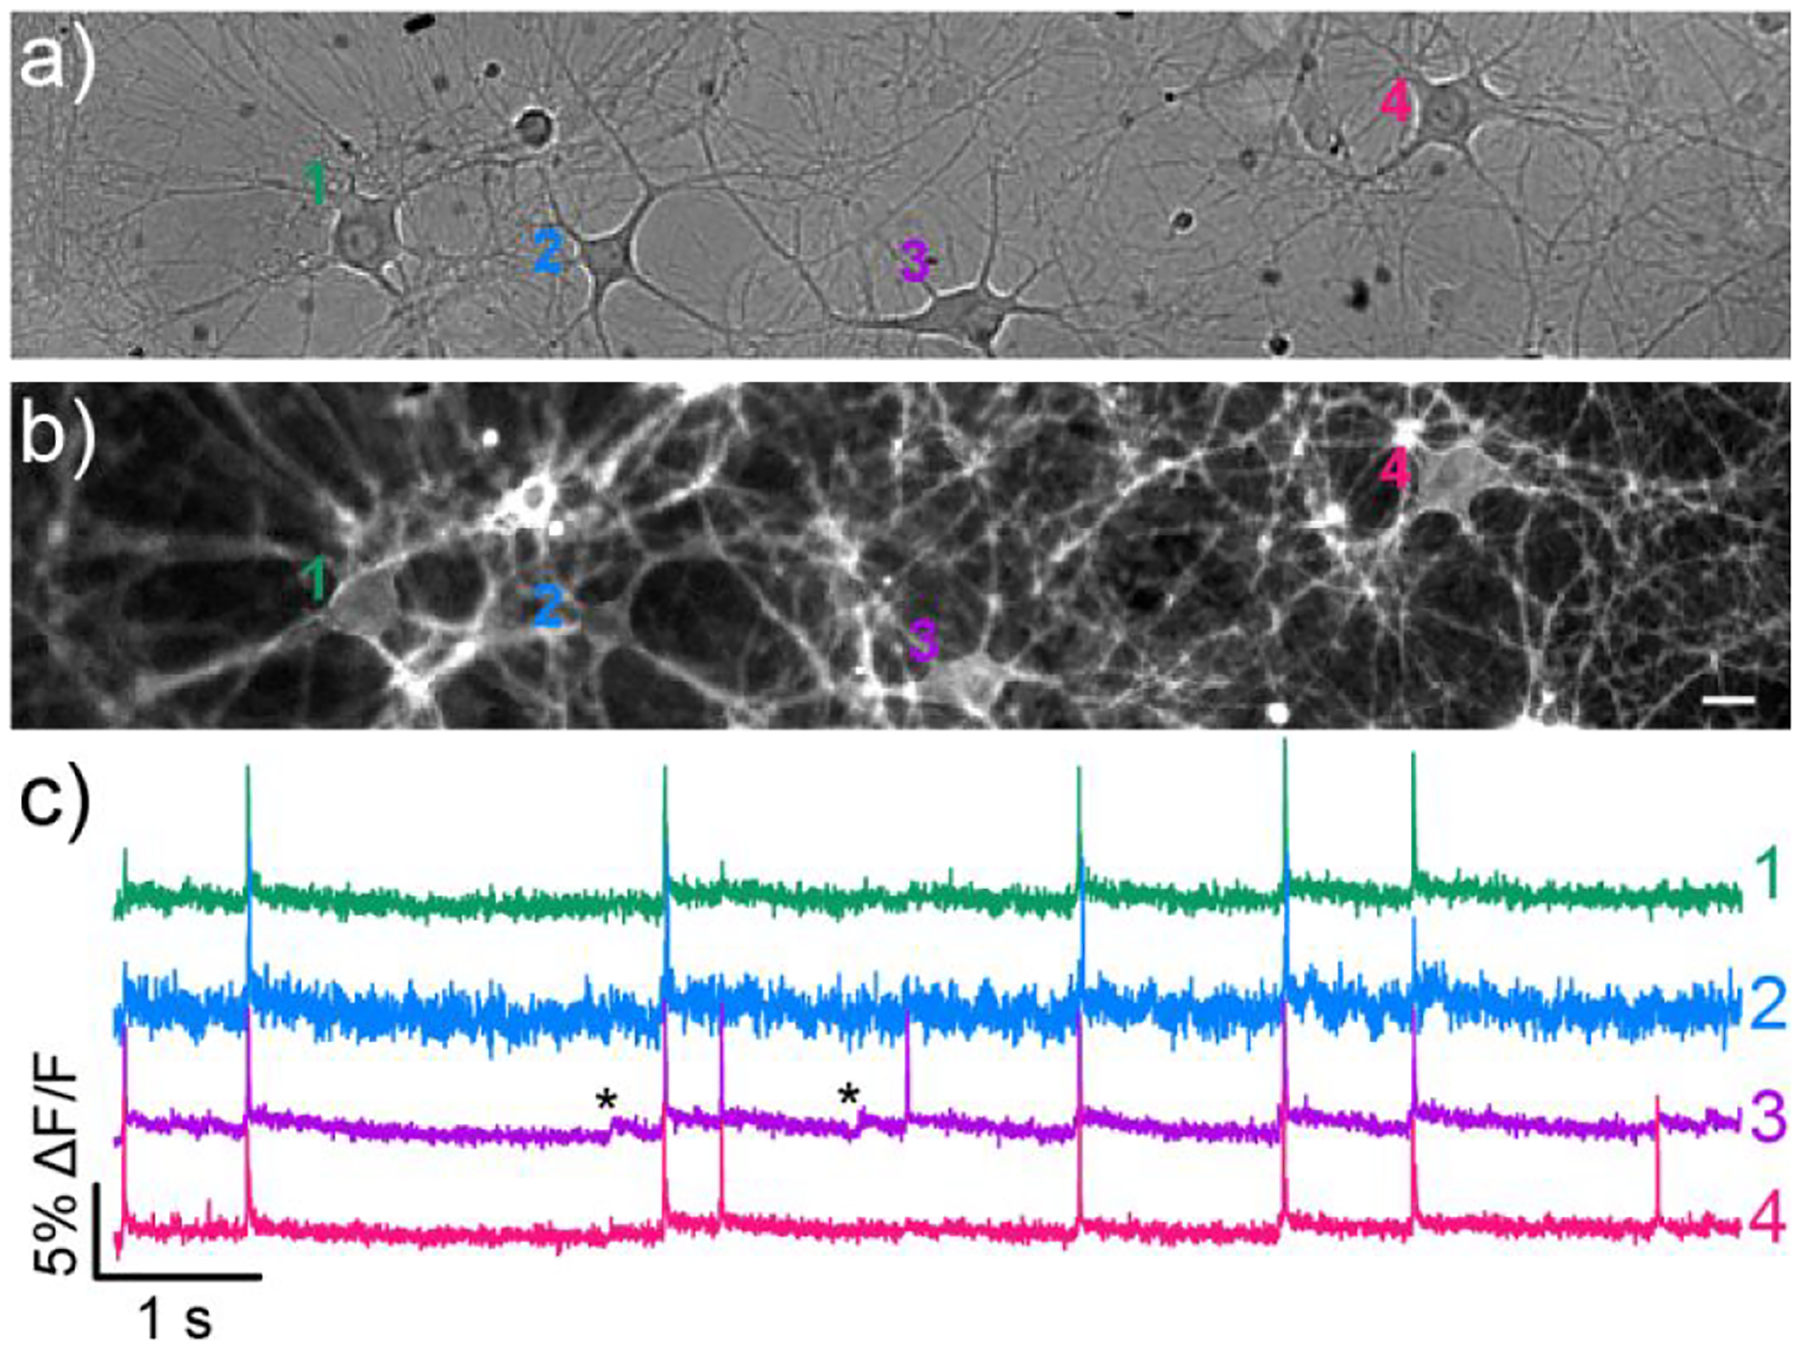
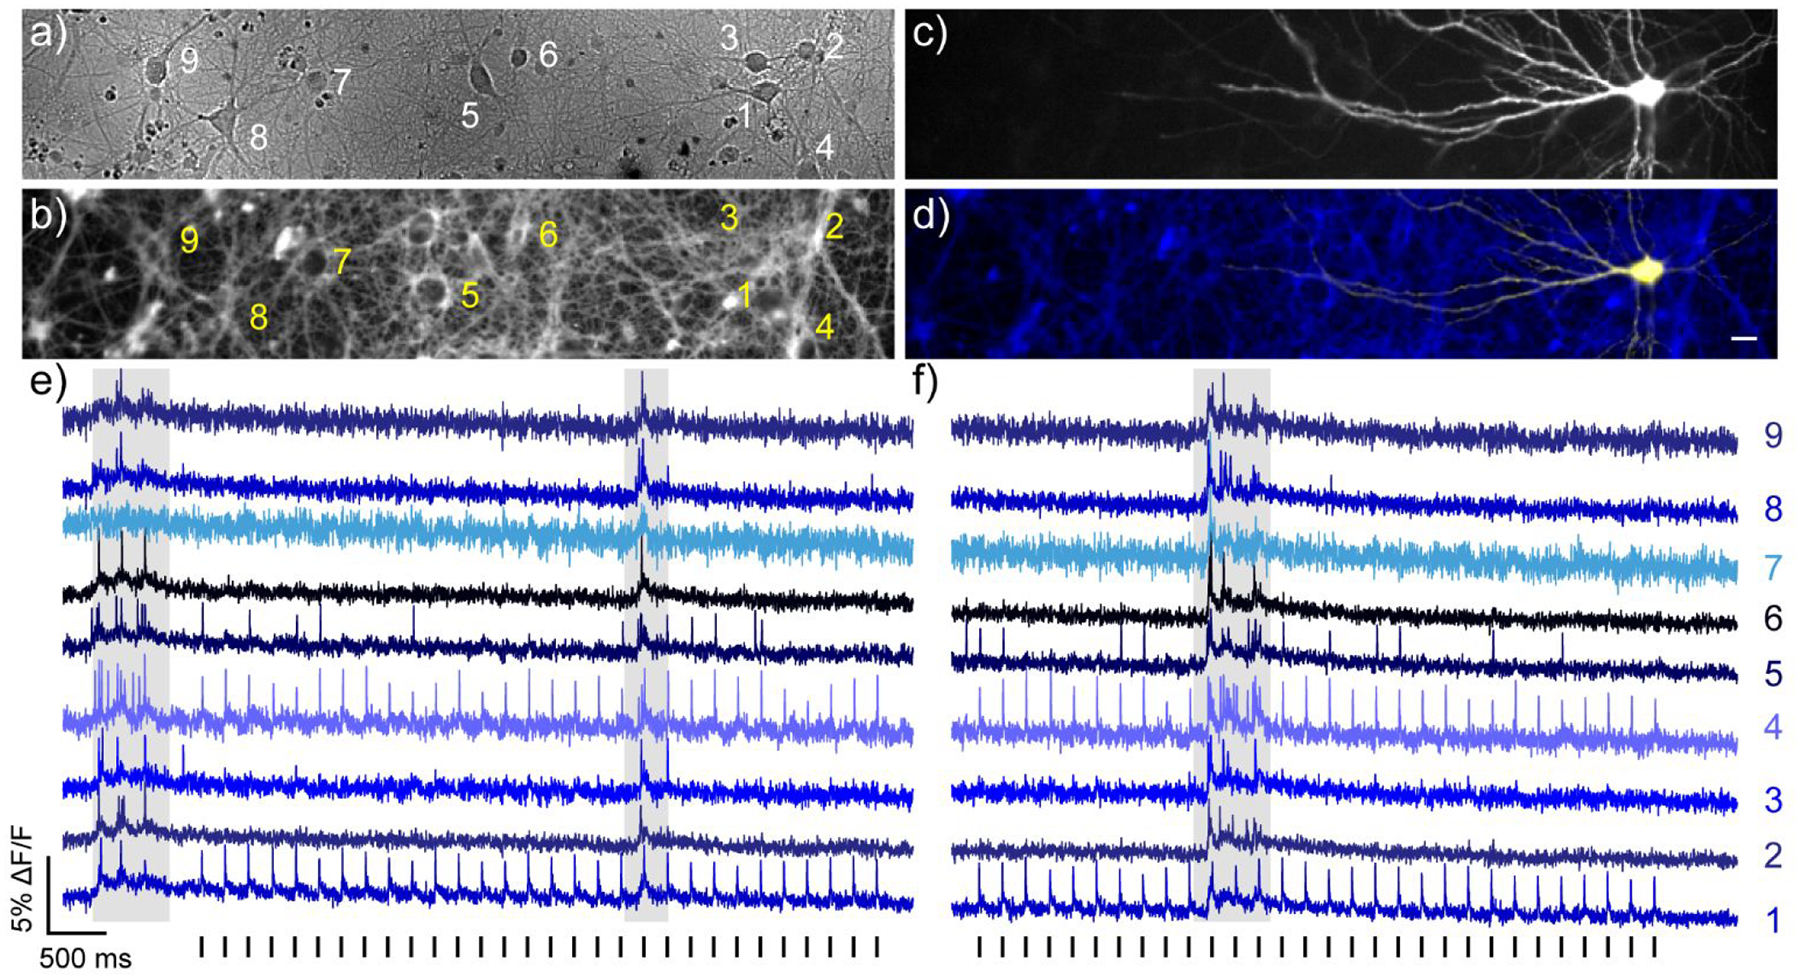
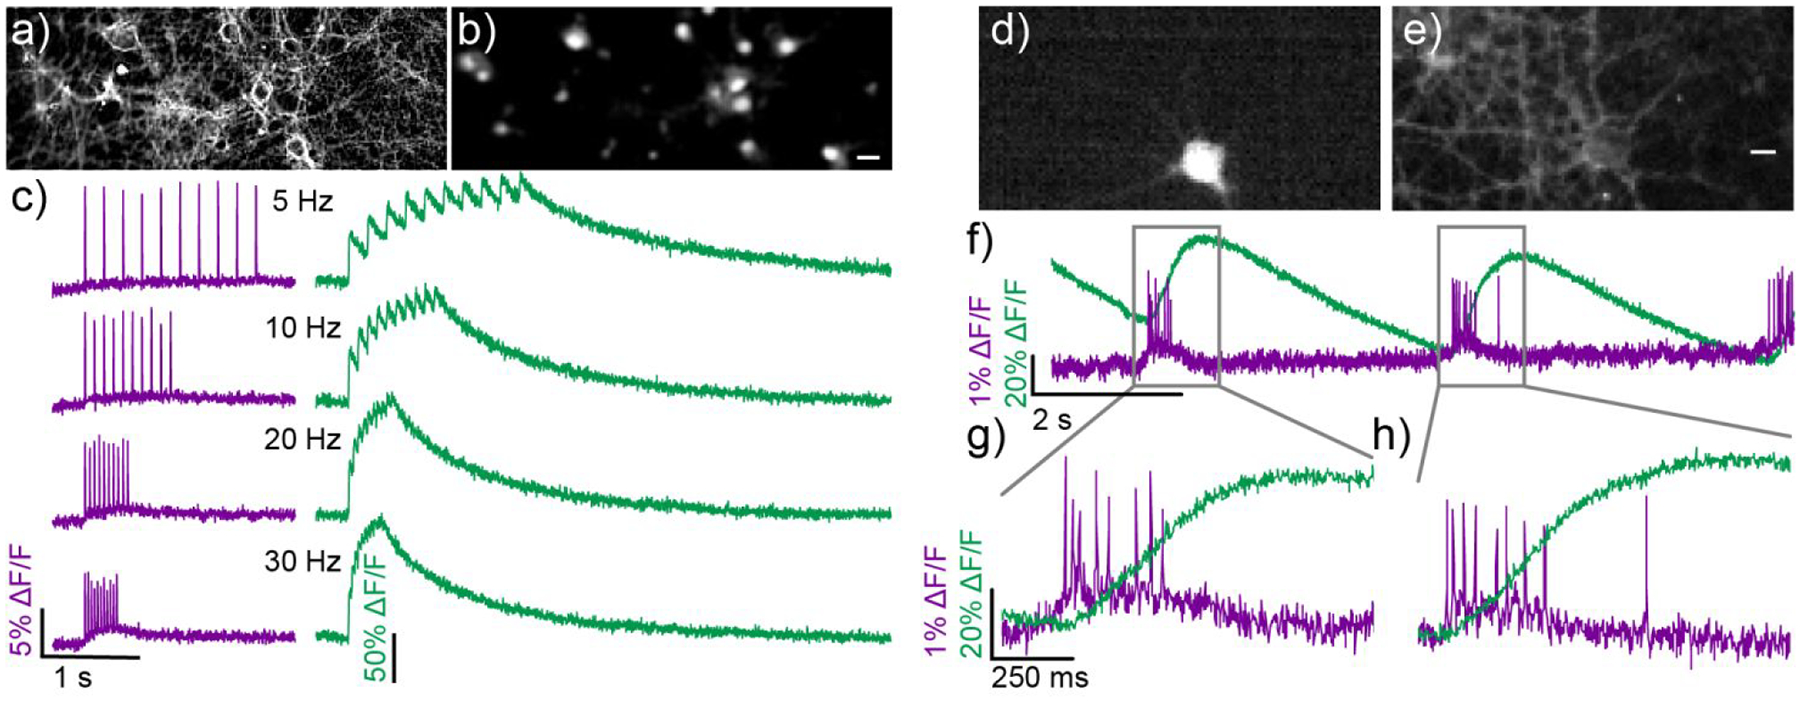
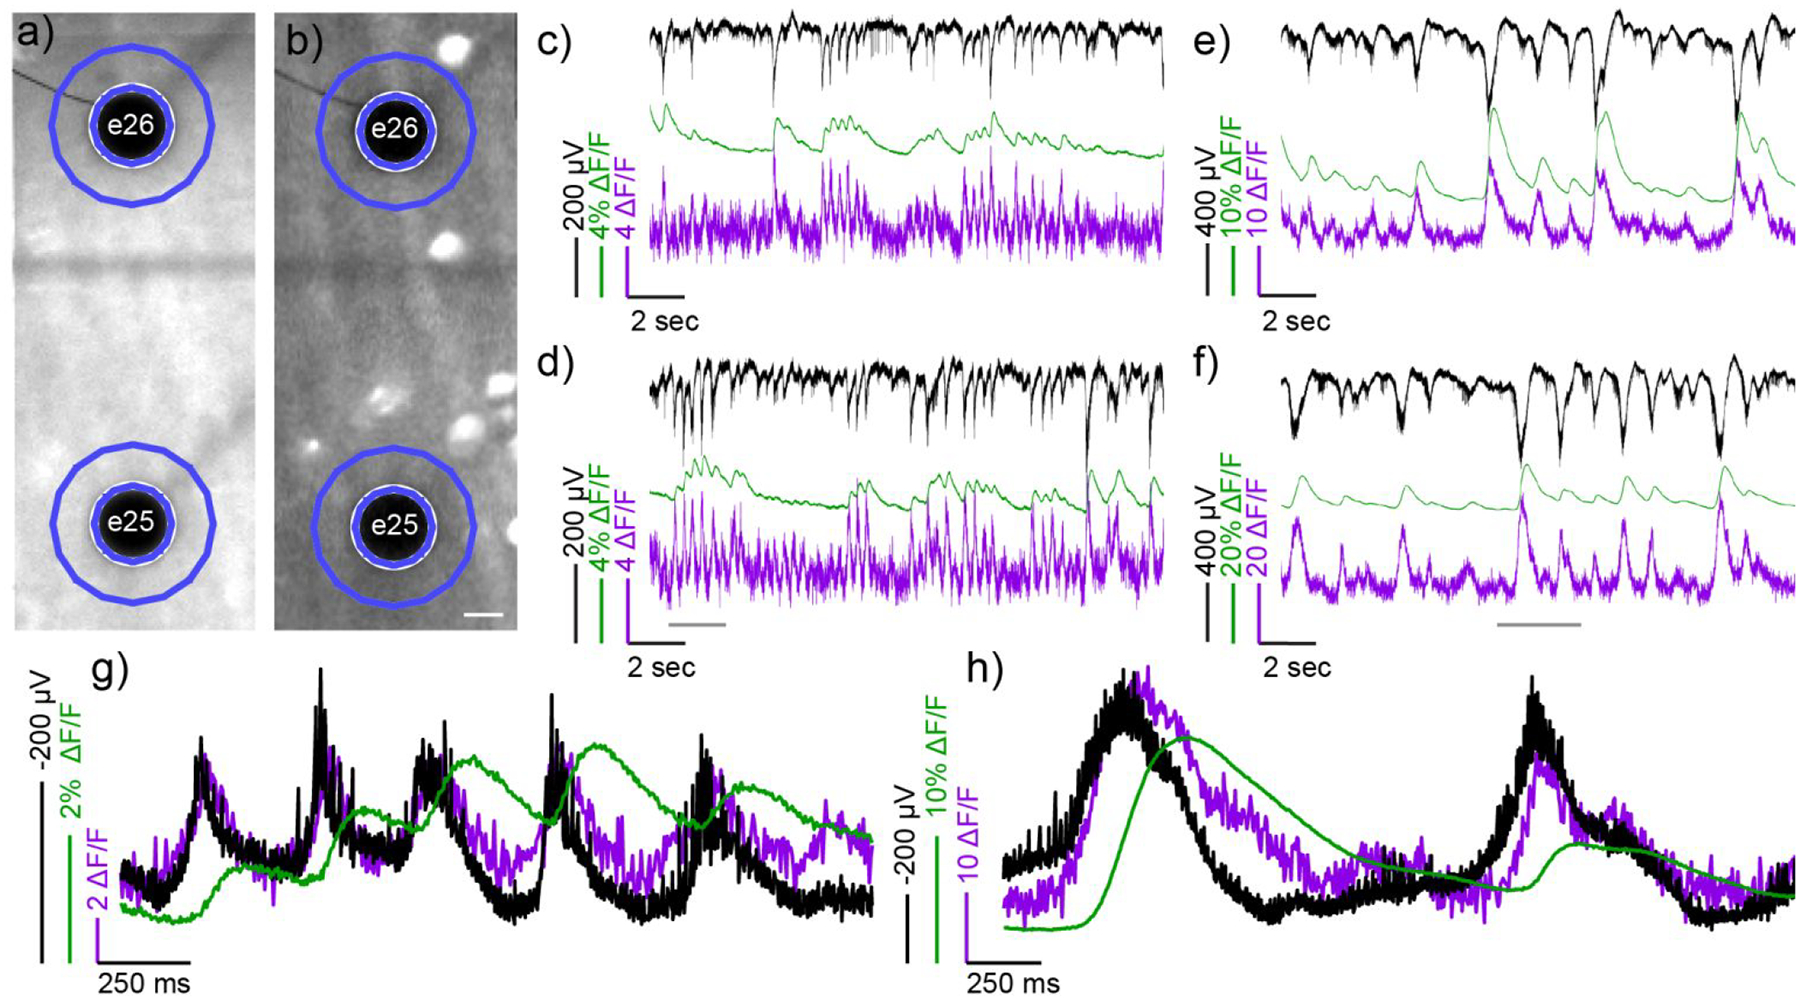
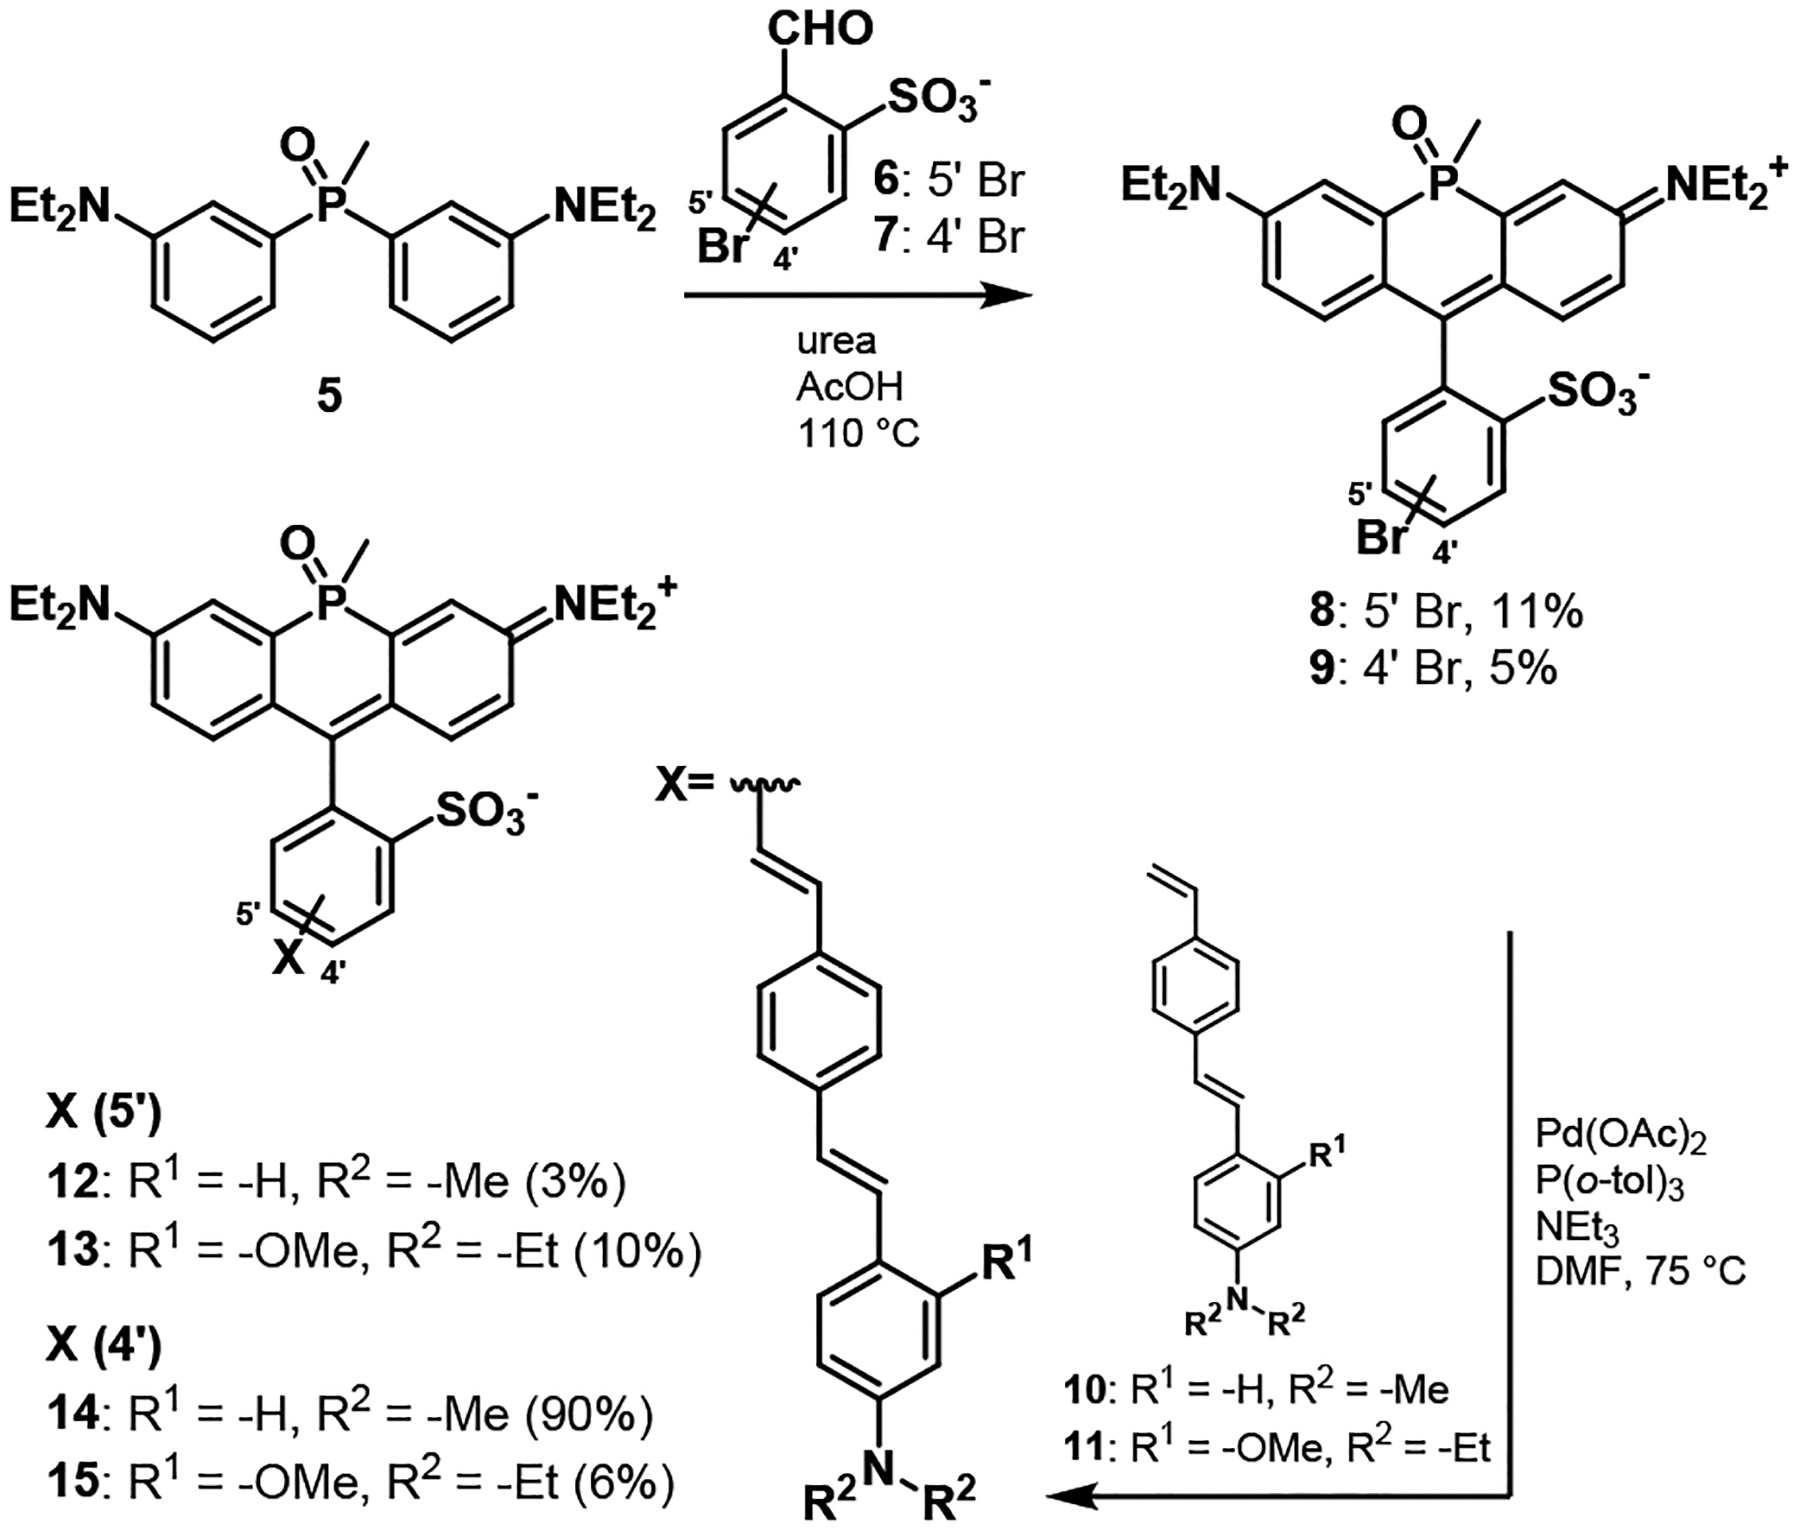
The development of fluorescent dyes that emit and absorb light at wavelengths greater than 700 nm and that respond to biochemical and biophysical events in living systems remains an outstanding challenge for noninvasive optical imaging. Here, we report the design, synthesis, and application of near-infrared (NIR)-absorbing and -emitting optical voltmeter based on a sulfonated, phosphine-oxide (po) rhodamine for voltage imaging in intact retinas. We find that po-rhodamine based voltage reporters, or poRhoVRs, display NIR excitation and emission profiles at greater than 700 nm, show a range of voltage sensitivities (13 to 43% ΔF/F per 100 mV in HEK cells), and can be combined with existing optical sensors, like Ca2+-sensitive fluorescent proteins (GCaMP), and actuators, like light-activated opsins ChannelRhodopsin-2 (ChR2). Simultaneous voltage and Ca2+ imaging reveals differences in activity dynamics in rat hippocampal neurons, and pairing poRhoVR with blue-light based ChR2 affords all-optical electrophysiology. In ex vivo retinas isolated from a mouse model of retinal degeneration, poRhoVR, together with GCaMP-based Ca2+ imaging and traditional multielectrode array (MEA) recording, can provide a comprehensive physiological activity profile of neuronal activity, revealing differences in voltage and Ca2+ dynamics within hyperactive networks of the mouse retina. Taken together, these experiments establish that poRhoVR will open new horizons in optical interrogation of cellular and neuronal physiology in intact systems.


Figures

Figure 1.
Figure 1.
Characterization of sulfonated phosphine-oxide rhodamine dyes 8 and 9. a) Plots of normalized absorbance (solid lines) and fluorescence intensity (dashed lines; excitation provided at 625 nm) of phosphine-oxide rhodamine 8 (thick blue lines) and 9 (black lines) in phosphate buffered saline (5 μM dye, 1% DMSO). b) Chemical structure of the cis isomers of 8 and 9. Thermal ellipsoid plots (50%) of c) 8 and d) 9. Hydrogen atoms, lattice solvent molecules and resolved disordered fragments have been omitted for clarity.
Figure 2.
Figure 2.
Cellular characterization of poRhoVR indicators in HEK cells. (a-d) Widefield, epifluorescence images of a) poRhoVR 14 (1 μM) in HEK cells. Cells are counter-stained with b) rhodamine 123 (1 μM) and c) Hoechst 33342 (1 μM) to visualize mitochondria and nuclei, respective. d) An overlay of poRhoVR 14, rhodamine 123, and Hoechst 33342. Scale bar for (a-d) is 20 μm. e) Plot of fractional change in fluorescence of poRhoVR 14 vs time for 40 ms hyper- and depolarizing voltage steps from a holding potential of −60 mV for a single HEK cell labeled with poRhoVR 14 (1 μM). f) Plot of ΔF/F vs membrane potential, summarizing data from n = 6 individual HEK cells. Error bars are ± S.D. If error bars are not visible, the error is smaller than the marker.
Figure 3.
Figure 3.
Voltage imaging in dissociated rat hippocampal neurons with poRhoVR 14. Transmitted light image of neurons loaded with a) poRhoVR 14 (500 nM). b) Epifluorescence image of neurons showing poRhoVR 14 staining. Scale bars are 20 μm. c) Plot of fractional change in poRhoVR 14 fluorescence (ΔF/F) vs time emanating from cells 1–4 in image (b). Optical sampling rate is 500 Hz. Asterisks indicate subthreshold voltage changes.
Figure 4.
Figure 4.
All-optical electrophysiology using poRhoVR 14 and ChR2. a) Transmitted light image of dissociated rat hippocampal neurons stained with poRhoVR 14 (500 nM). Scale bar is 20 μm. b) Epifluorescence image of neurons stained with poRhoVR 14. c) Epifluorescence image of neuron displaying YFP marker of ChR2 expression. d) Composite image depicting poRhoVR 14 labeling and ChR2-YFP expression. e) Recording of ΔF/F from the cell bodies of neurons indicated in panels a-d. f) Plot of ΔF/F from the cell bodies of neurons indicated in panels a-d, recorded 90 seconds after the data shown in panel e. Optical sampling rate was 500 Hz. The entire field was stimulated optically with flashes of cyan light (475 nm, 5 ms, 1.92 mW/mm2) as indicated by the vertical bars below the blue optical recording in panels e and f. Optical voltage recordings are single trials.
Figure 5.
Figure 5.
Simultaneous voltage and calcium imaging with poRhoVR 14. Epifluorescence image of neurons stained with both a) poRhoVR 14 (1 μM) and b) Oregon Green BAPTA 1 AM (OGB, 1 μM). c) Plots of ΔF/F for voltage (poRhoVR 14, purple) and Ca2+ transients (OGB, green) in response to field stimulation driven at 5, 10, 20, and 30 Hz. d) Epifluorescence image of a neuron transfected with GCaMP6s. e) This same GCaMP6s (+) neuron is also stained with poRhoVR 14 and imaged simultaneously. Scale bar is 10 μm. f) Simultaneously recorded traces of voltage and calcium activity from neuron in panels d and e. Activity was evoked using field stimulation at a rate of 16 Hz. g) The insets show that the onset and decay of voltage signals imaged with poRhoVR 14 precede that of the calcium signal visualized from the same cell with GCaMP6s.
Figure 6.
Figure 6.
Simultaneous mapping of electrical and Ca2+ activity using poRhoVR, GCaMP6f and multi-electrode arrays (MEA) in ex vivo retinas from rd1 mice. Widefield fluorescence micrographs of retina stained with a) poRhoVR 14; the retinal ganglion cells (RGCs) express b) GCaMP6f. The black dots are MEA electrodes, labeled numerically, underneath the retina. Scale bar is 20 μm. Recordings c-f depict MEA, GCaMP6f, and poRhoVR 14 signals vs. time. Traces are as follows: raw MEA electrical signal (black), bleach corrected poRhoVR ΔF/F (arbitrary units) (magenta), and GCaMP6f ΔF/F (%) (green). Optical signals are from the regions of interest (ROIs) indicated in blue in panels a and b. Panels c and d depict the spontaneous activity in the retina prior to addition of synaptic blockers. Panels e and f show MEA, GCaMP6f, and poRhoVR 14 signals 15 min. after the addition of synaptic blockers. Panels c and e correspond to signals associated with electrode 26 (e26), and panels d and f correspond to signals associated with electrode 25 (e25). Panels g and h show zoomed-in regions of e25, from the time period indicated by a grey bar in panel d and f, respectively. In panels g and h, the MEA signal (black) is inverted to facilitate comparison with optical voltage recordings with poRhoVR (magenta).
Scheme 1.
Scheme 1.
Synthesis of sulfonated phosphine oxide rhodamine voltage reporters (poRhoVRs)

Similar articles

Cited by

References

    1. Huang B; Babcock H; Zhuang X, Breaking the Diffraction Barrier: Super-Resolution Imaging of Cells. Cell 2010, 143 (7), 1047–1058. - PMC - PubMed
    1. Power RM; Huisken J, A guide to light-sheet fluorescence microscopy for multiscale imaging. Nature Methods 2017, 14, 360. - PubMed
    1. Richardson DS; Lichtman JW, Clarifying Tissue Clearing. Cell 2015, 162 (2), 246–257. - PMC - PubMed
    1. Hirayama T; Van de Bittner GC; Gray LW; Lutsenko S; Chang CJ, Near-infrared fluorescent sensor for in vivo copper imaging in a murine Wilson disease model. Proceedings of the National Academy of Sciences 2012, 109 (7), 2228–2233. - PMC - PubMed
    1. Chung K; Wallace J; Kim S-Y; Kalyanasundaram S; Andalman AS; Davidson TJ; Mirzabekov JJ; Zalocusky KA; Mattis J; Denisin AK; Pak S; Bernstein H; Ramakrishnan C; Grosenick L; Gradinaru V; Deisseroth K, Structural and molecular interrogation of intact biological systems. Nature 2013, 497, 332. - PMC - PubMed

Publication types

LinkOut - more resources