

Redlines and Greenspace: The Relationship between Historical Redlining and 2010 Greenspace across the United States
- PMID: 33502254
- PMCID: PMC7839347
- DOI: 10.1289/EHP7495
Redlines and Greenspace: The Relationship between Historical Redlining and 2010 Greenspace across the United States
Abstract
Introduction: Redlining, a racist mortgage appraisal practice of the 1930s, established and exacerbated racial residential segregation boundaries in the United States. Investment risk grades assigned ago through security maps from the Home Owners' Loan Corporation (HOLC) are associated with current sociodemographics and adverse health outcomes. We assessed whether historical HOLC investment grades are associated with 2010 greenspace, a health-promoting neighborhood resource.
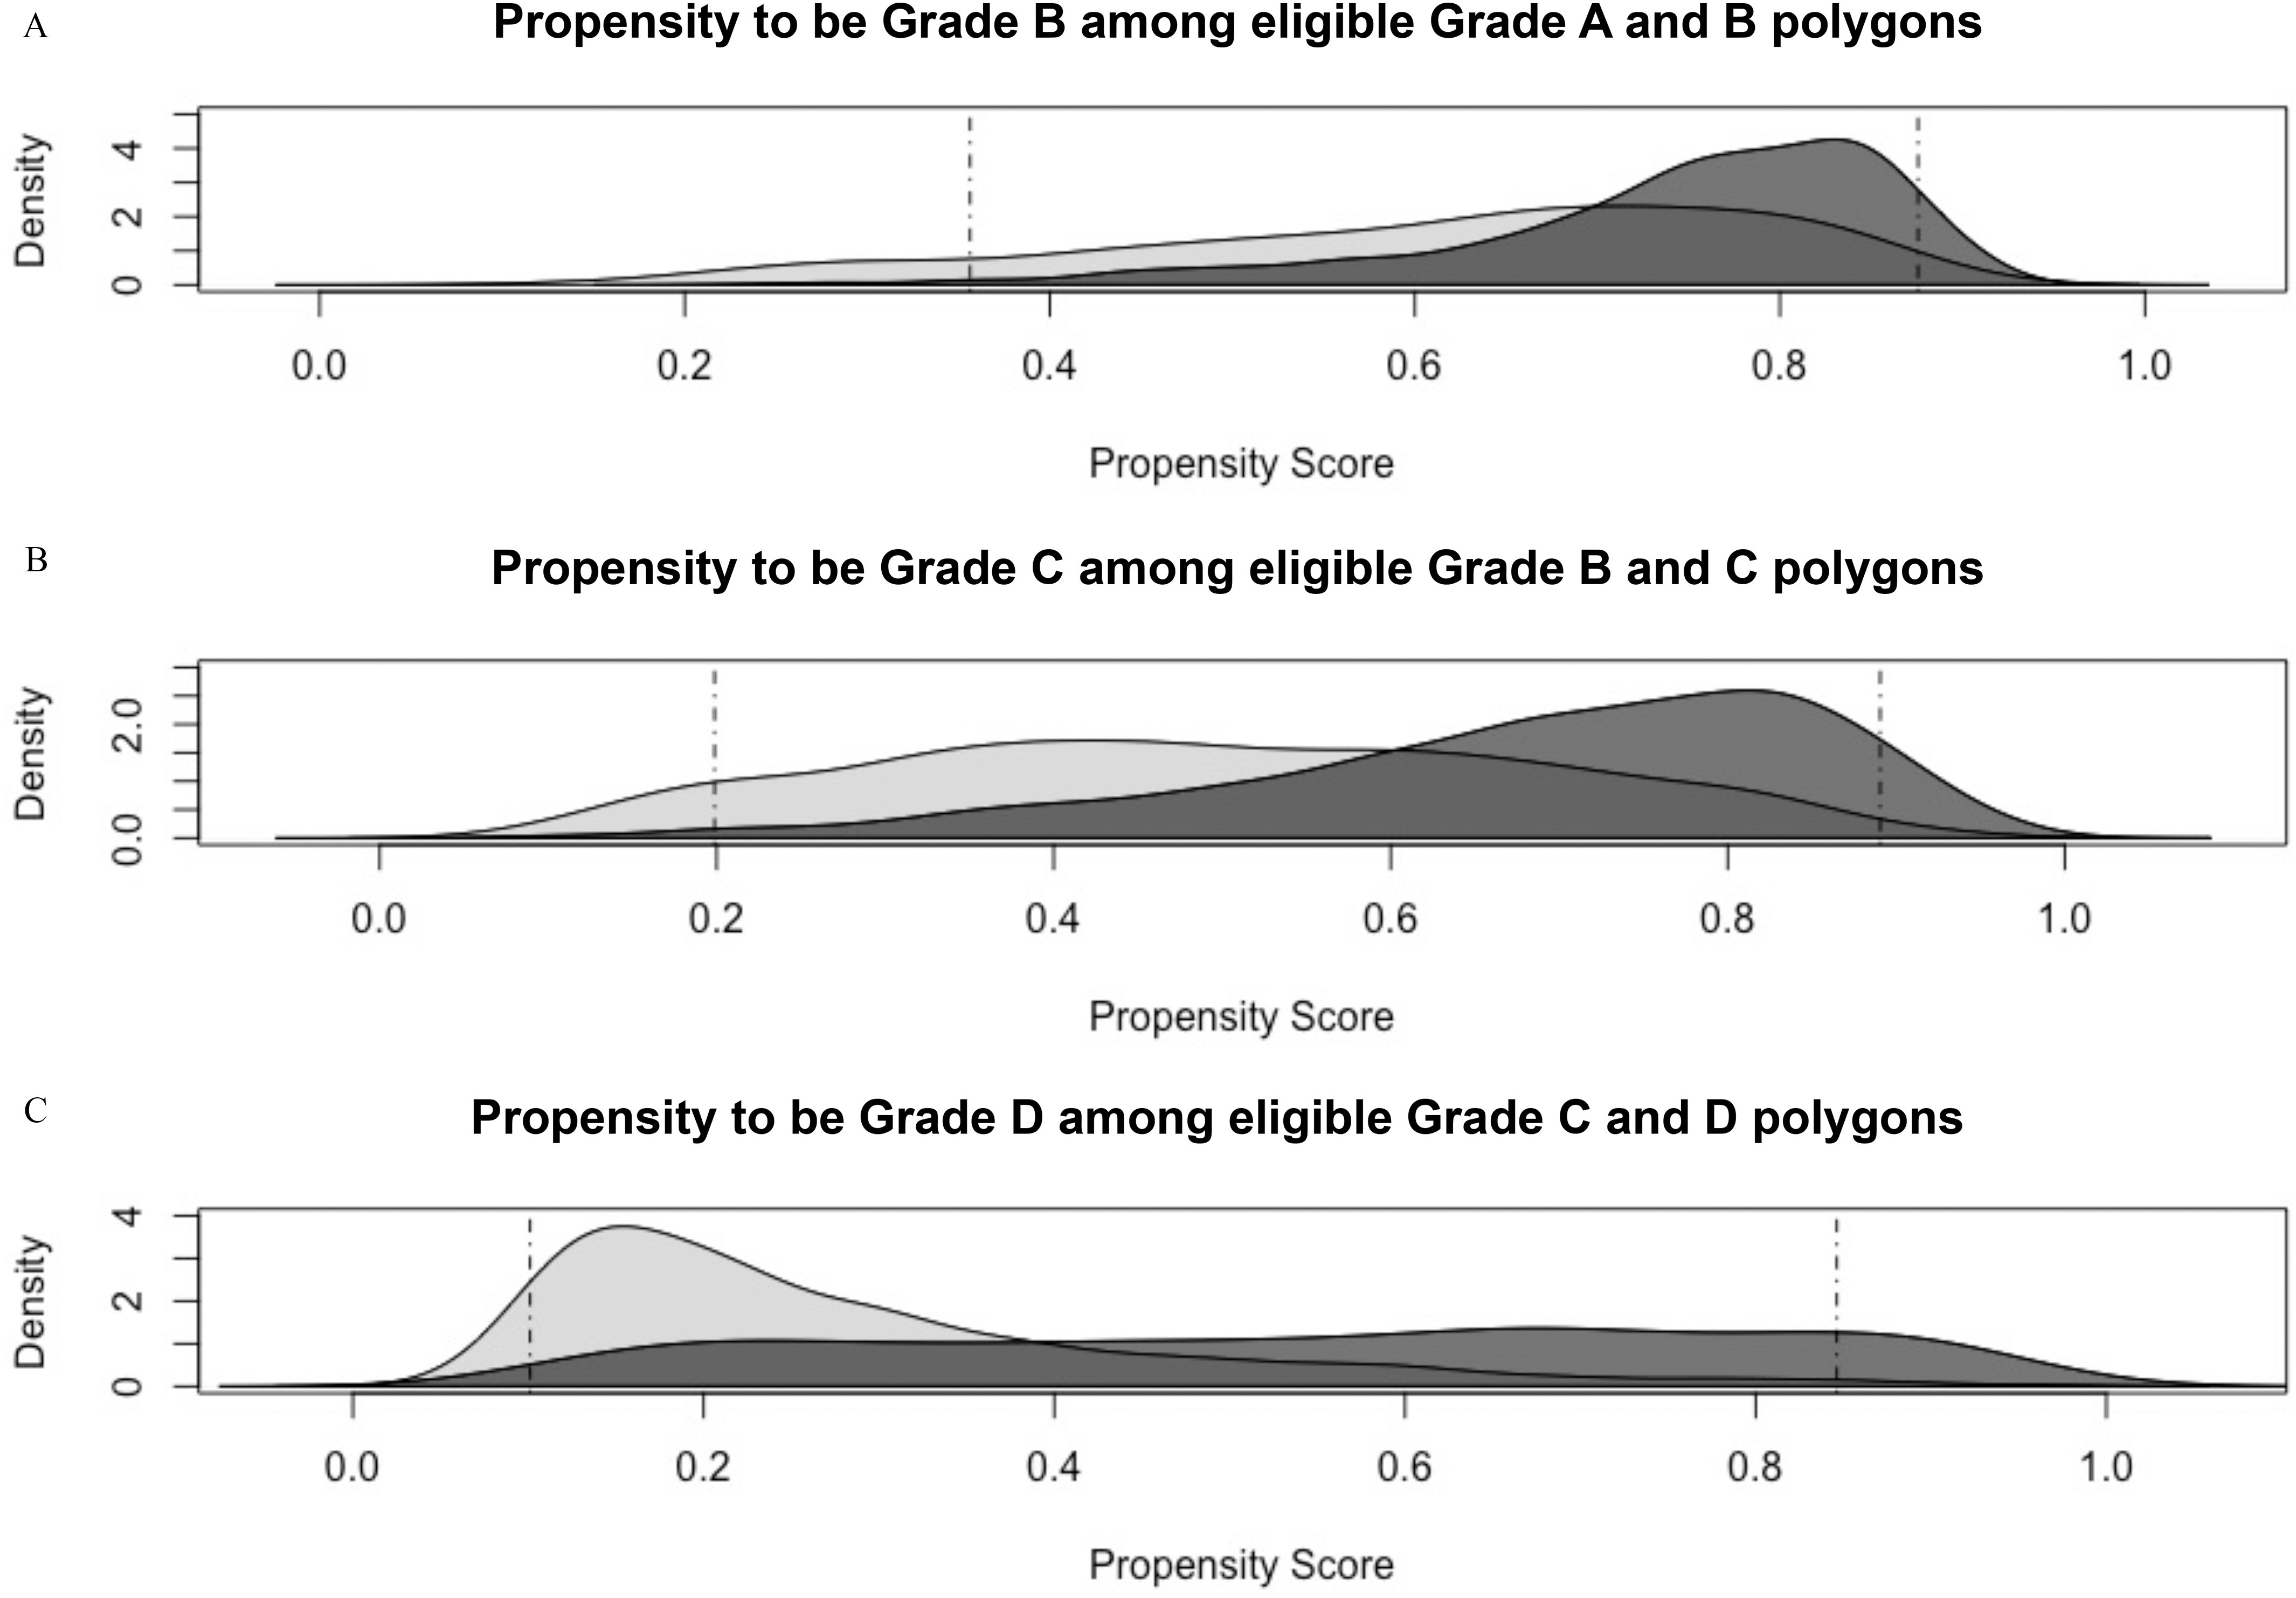
Objectives: We compared 2010 normalized difference vegetation index (NDVI) across previous HOLC neighborhood grades using propensity score restriction and matching.
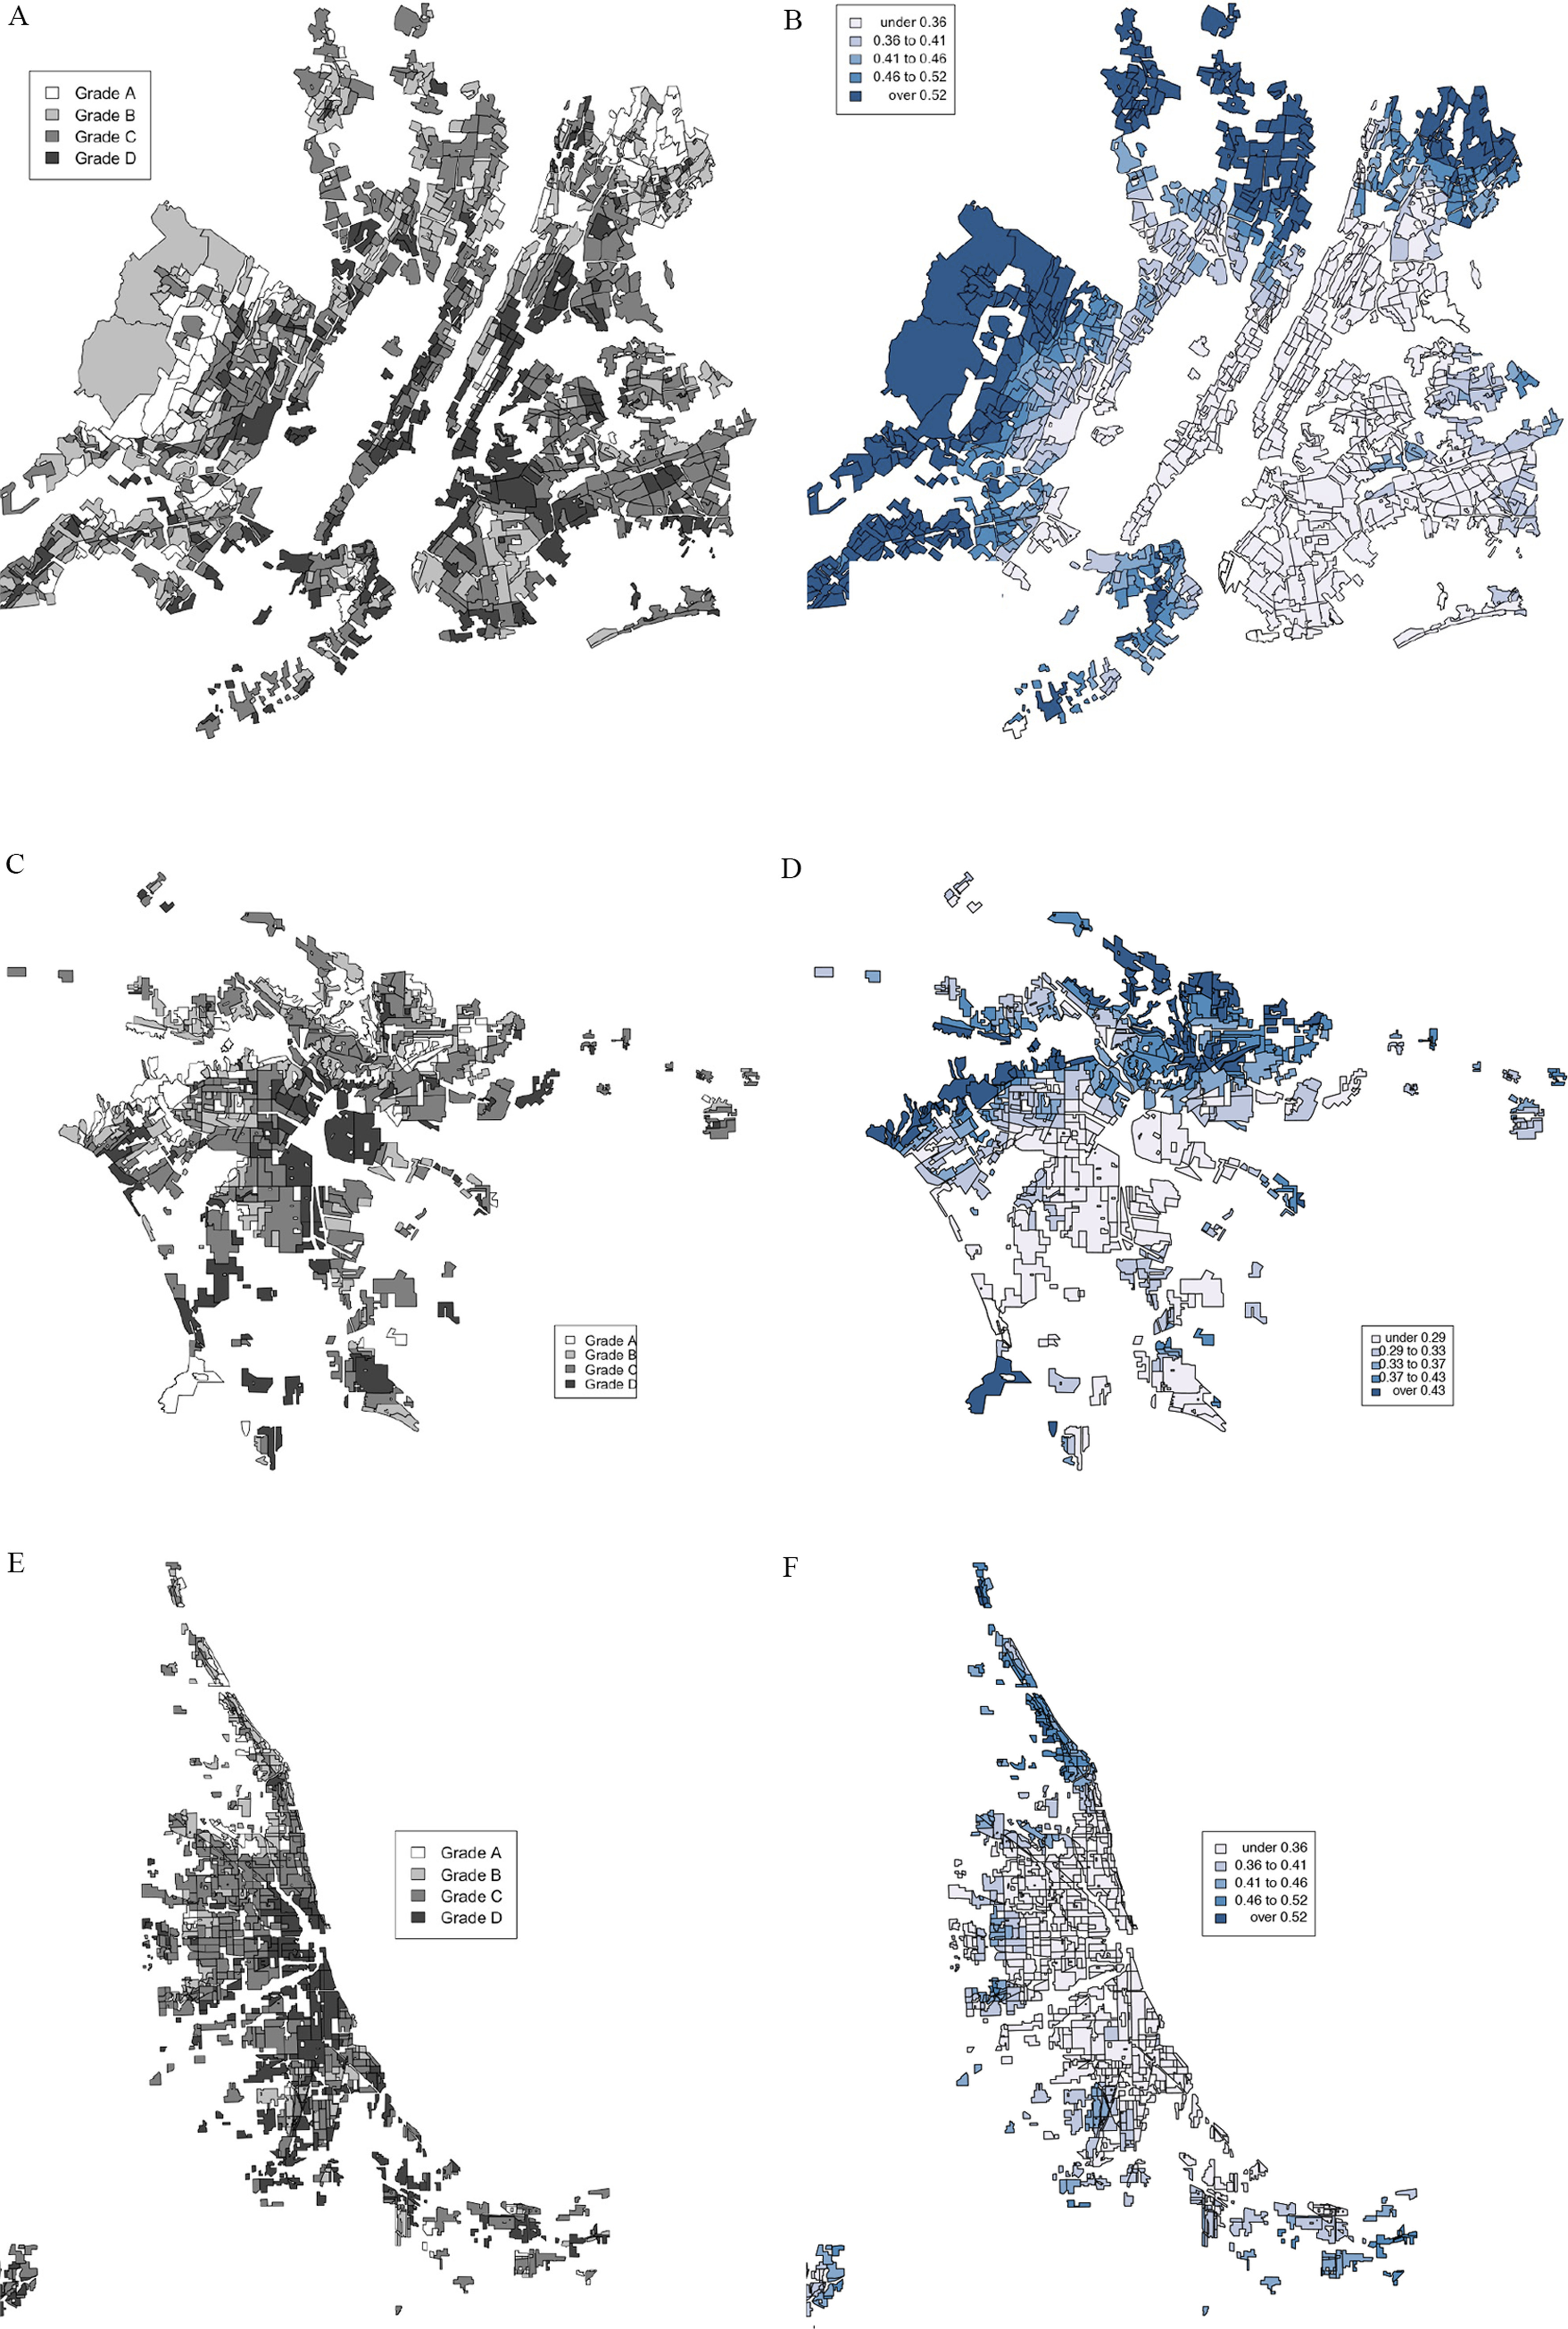
Methods: Security map shapefiles were downloaded from the Mapping Inequality Project. Neighborhood investment risk grades included A (best, green), B (blue), C (yellow), and D (hazardous, red, i.e., redlined). We used 2010 satellite imagery to calculate the average NDVI for each HOLC neighborhood. Our main outcomes were 2010 annual average NDVI and summer NDVI. We assigned areal-apportioned 1940 census measures to each HOLC neighborhood. We used propensity score restriction, matching, and targeted maximum likelihood estimation to limit model extrapolation, reduce confounding, and estimate the association between HOLC grade and NDVI for the following comparisons: Grades B vs. A, C vs. B, and D vs. C.
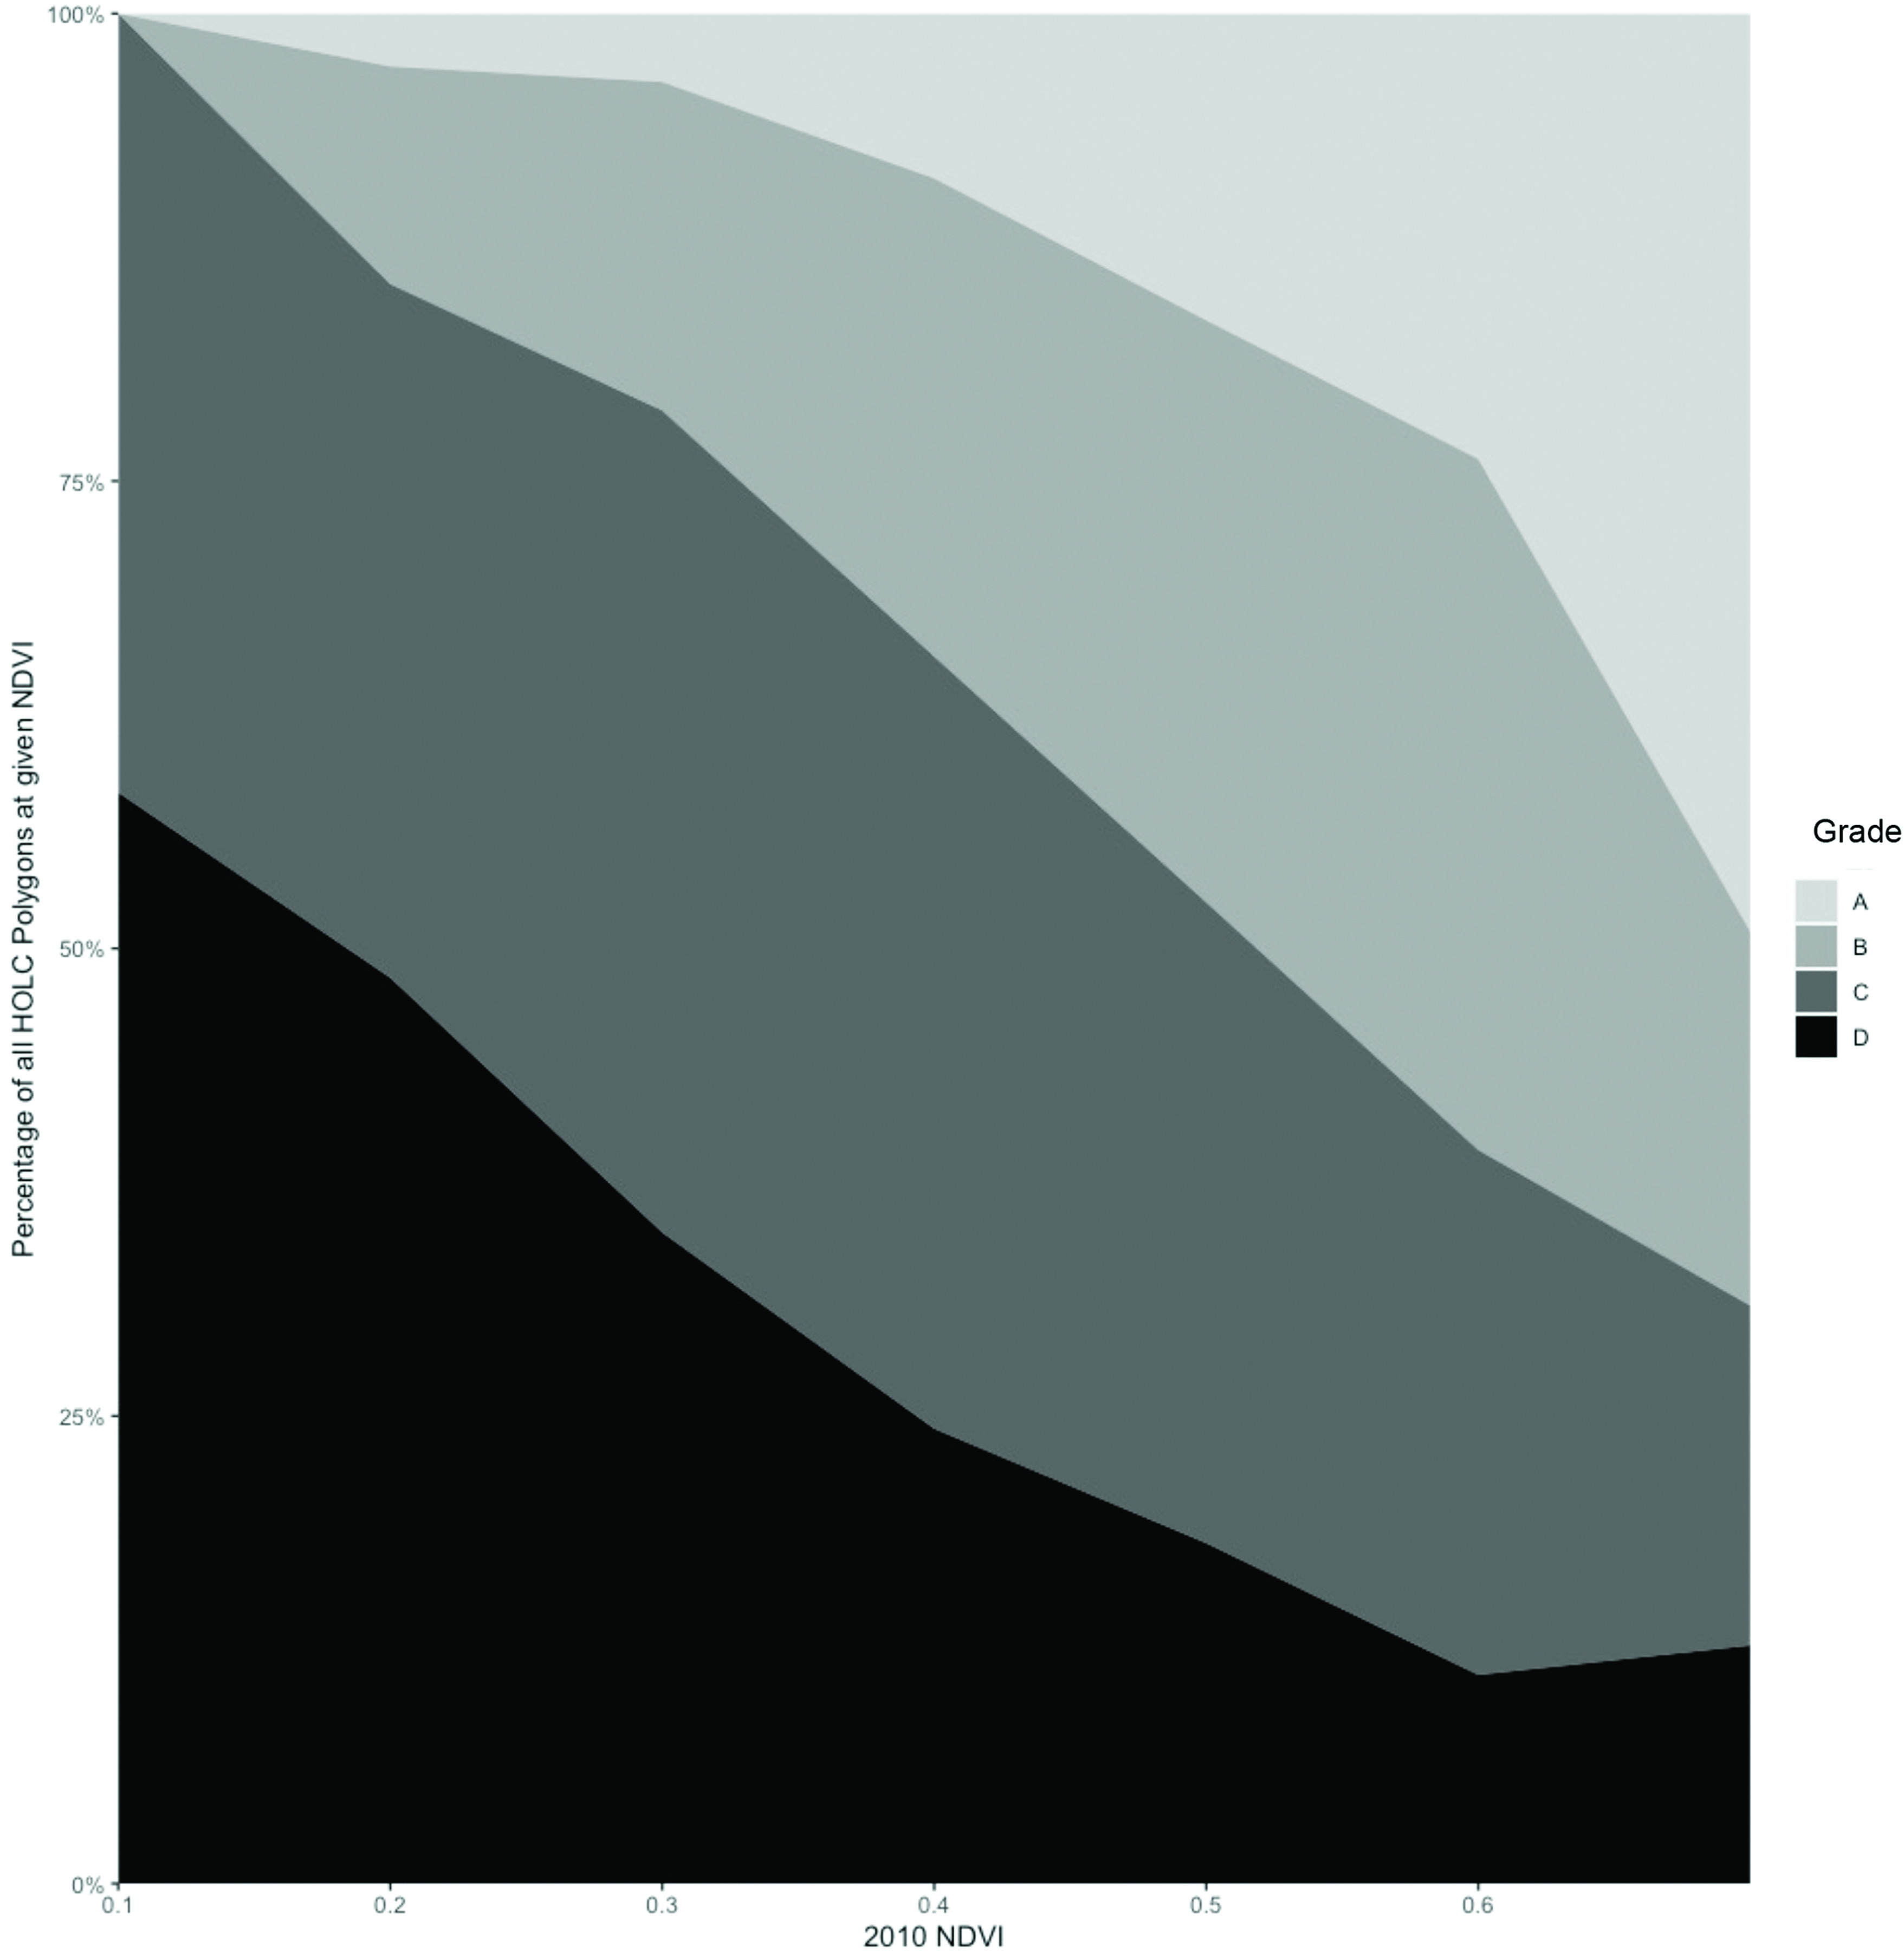
Results: Across 102 urban areas (4,141 HOLC polygons), annual average 2010 NDVI was 0.47 (), 0.43 (), 0.39 (), and 0.36 () in Grades A-D, respectively. In analyses adjusted for current ecoregion and census region, 1940s census measures, and 1940s population density, annual average NDVI values in 2010 were estimated at (95% CI: , ), (95% CI: , ), and (95% CI: , ) for Grades B vs. A, C vs. B, and D vs. C, respectively, in the 1930s.
Discussion: Estimates adjusted for historical characteristics indicate that neighborhoods assigned worse HOLC grades in the 1930s are associated with reduced present-day greenspace. https://doi.org/10.1289/EHP7495.
Figures
Comment in
-
Walking on a Redline: Did Discriminatory U.S. Housing Policies Affect Greenspace Development?Environ Health Perspect. 2021 Mar;129(3):34004. doi: 10.1289/EHP9033. Epub 2021 Mar 31. Environ Health Perspect. 2021. PMID: 33788615 Free PMC article.
References
-
- Aaronson D, Hartley D, Mazumder B. 2019. The Effects of the 1930s “Redlining” Maps. Working paper, No. 2017-12. Chicago, IL: Federal Reserve Bank of Chicago.
-
- Bravo MA, Anthopolos R, Bell ML, Miranda ML. 2016. Racial isolation and exposure to airborne particulate matter and ozone in understudied US populations: environmental justice applications of downscaled numerical model output. Environ Int 92–93:247–255, PMID: 27115915, 10.1016/j.envint.2016.04.008. - DOI - PubMed
Publication types
MeSH terms
Grants and funding
LinkOut - more resources
Full Text Sources
Other Literature Sources