

Use of Shotgun Metagenomics and Metabolomics to Evaluate the Impact of Glyphosate or Roundup MON 52276 on the Gut Microbiota and Serum Metabolome of Sprague-Dawley Rats
- PMID: 33502259
- PMCID: PMC7839352
- DOI: 10.1289/EHP6990
Use of Shotgun Metagenomics and Metabolomics to Evaluate the Impact of Glyphosate or Roundup MON 52276 on the Gut Microbiota and Serum Metabolome of Sprague-Dawley Rats
Abstract
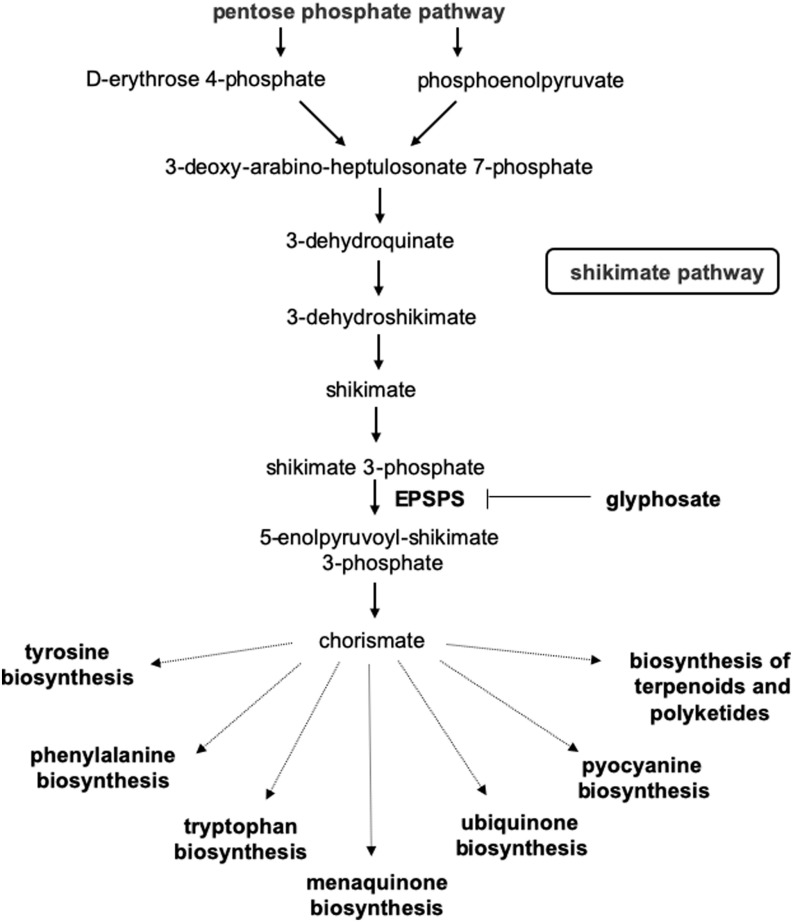
Background: There is intense debate on whether glyphosate can inhibit the shikimate pathway of gastrointestinal microorganisms, with potential health implications.
Objectives: We tested whether glyphosate or its representative EU herbicide formulation Roundup MON 52276 affects the rat gut microbiome.
Methods: We combined cecal microbiome shotgun metagenomics with serum and cecum metabolomics to assess the effects of glyphosate [0.5, 50, ] or MON 52276 at the same glyphosate-equivalent doses, in a 90-d toxicity test in rats.
Results: Glyphosate and MON 52276 treatment resulted in ceca accumulation of shikimic acid and 3-dehydroshikimic acid, suggesting inhibition of 5-enolpyruvylshikimate-3-phosphate synthase of the shikimate pathway in the gut microbiome. Cysteinylglycine, , and valylglycine levels were elevated in the cecal microbiome following glyphosate and MON 52276 treatments. Altered cecum metabolites were not differentially expressed in serum, suggesting that the glyphosate and MON 52276 impact on gut microbial metabolism had limited consequences on physiological biochemistry. Serum metabolites differentially expressed with glyphosate treatment were associated with nicotinamide, branched-chain amino acid, methionine, cysteine, and taurine metabolism, indicative of a response to oxidative stress. MON 52276 had similar, but more pronounced, effects than glyphosate on the serum metabolome. Shotgun metagenomics of the cecum showed that treatment with glyphosate and MON 52276 resulted in higher levels of Eggerthella spp., Shinella zoogleoides, Acinetobacter johnsonii, and Akkermansia muciniphila. Shinella zoogleoides was higher only with MON 52276 exposure. In vitro culture assays with Lacticaseibacillus rhamnosus strains showed that Roundup GT plus inhibited growth at concentrations at which MON 52276 and glyphosate had no effect.
Discussion: Our study highlights the power of multi-omics approaches to investigate the toxic effects of pesticides. Multi-omics revealed that glyphosate and MON 52276 inhibited the shikimate pathway in the rat gut microbiome. Our findings could be used to develop biomarkers for epidemiological studies aimed at evaluating the effects of glyphosate herbicides on humans. https://doi.org/10.1289/EHP6990.
Figures
![Figure 3 is a set of fourteen error bar graphs plotting shikimate, ranging from negative 1.5 to 0.5 in increments of 0.5; solanidine, ranging from negative 0.4 to 0.0 in increments of 0.2; 3-dehydroshikimate, ranging from negative 1.0 to 0.5 in increments of 0.5; 2-isopropylmalate, ranging from negative 0.50 to 0.50 in increments of 0.25; glyphosate, ranging from negative 1 to 2 in increments of 0.1; linolenoylcarnitine, ranging from negative 0.5 to 0.0 in increments of 0.5; carotene diol, ranging from negative 0.4 to 0.2 in increments of 0.2; glutarate, ranging from negative 1.00 to 0.25 in increments of 0.25; pimelate, ranging from negative 0.50 to 0.25 in increments of 0.25; cysteinylglycine, ranging from negative 0.5 to 0.5 in increments of 0.5; prolyglycine, ranging from negative 0.50 to 0.50 in increments of 0.25; valylglycine, ranging from negative 0.8 to 0.4 in increments of 0.4; N-accetylputrescine, ranging from negative 0.4 to 0.2 in increments of 0.2; and OH-trimethyllysine, ranging from negative 0.2 to 0.2 (y-axis) across a (control), b [Glyphosate (0.5 milligrams per kilogram body weight per day)], c [Glyphosate (50 milligrams per kilogram body weight per day)], d [Glyphosate (175 milligrams per kilogram body weight per day)], e [MON 52276 (0.5 milligrams per kilogram body weight per day)], f [MON 52276 (50 milligrams per kilogram body weight per day)], and g [MON 52276 (175 milligrams per kilogram body weight per day)] (x-axis) for adjusted lowercase p equals 7.1E-32; 2.1E-14; 2.1E-14; 4.0E-02; 9.3E-22; 8.5E-08; 1.6E-7; 0.04; 0.04; 2.1E-06; 0.003; 0.03; 0.03; and 0.04, respectively.](https://cdn.ncbi.nlm.nih.gov/pmc/blobs/2927/7839352/cd31de78f577/ehp6990_f3.jpg)
![Figure 4 is a set of thirty-three error bar graphs plotting glyphosate, ranging from negative 0.5 to 0.5 in increments of 0.5; 1-methylnicotinamide, ranging from negative 0.50 to 0.25 in increments of 0.25; 3-methylglutaconate, ranging from negative 0.2 to 0.4 in increments of 0.2; N-accetylisoleucine, ranging from negative 0.2 to 0.2 in increments of 0.2; 2,3-dihydroxy-5-methylthio-4-pentenoate, ranging from negative 0.1 to 0.1 in increments of 0.1, glutarate, ranging from negative 0.4 to 0.2 in increments of 0.2; 1-methylnicotinamide, ranging from negative 0.50 to 0.25 in increments of 0.25; ectoine, ranging from negative 0.50 to 0.25 in increments of 0.25; citrate, ranging from negative 0.10 to 0.15 in increments of 0.05; xanthurenate, ranging from negative 0.5 to 0.5 in increments of 0.5; leucine, ranging from negative 0.10 to 0.05 in increments of 0.05; taurine, ranging from negative 0.10 to 0.05 in increments of 0.05; glycerate, ranging from negative 0.3 to 0.2 in increments of 0.1; isoleucine, ranging from negative 0.10 to 0.05 in increments of 0.05; methionine sulfoxide, ranging from negative 0.2 to 0.2 in increments of 0.2; N-accetylmethionine sulfoxide, ranging from negative 0.5 to 0.5 in increments of 0.5; N-accetylhomocitrulline, ranging from negative 0.2 to 0.2 in increments of 0.1; deoxycholate, ranging from negative 0.5 to 1.0 in increments of 0.5; 3-acetylphenol sulfate, ranging from negative 0.50 to 0.50 in increments of 0.25; 4-hydroxycoumarin, ranging from negative 0.5 to 0.5 increments of 0.5; alpha-ketoglutarae, ranging from negative 0.2 to 0.1 in increments of 0.1; 3-hydroxybutyrate, ranging from negative 0.3 to 0.6 in increments of 0.3; 4-hydroxycinnamate, ranging from negative 0.4 to 0.4 in increments of 0.4; phosphate, ranging from negative 0.2 to 0.4 increments of 0.2; N-acetyl-1-methylhistidine, ranging from negative 0.2 to 0.4 in increments of 0.2; 1-methylguanidine, ranging from negative 0.5 to 1.0 increments of 0.5; glutamate, ranging from negative 0.2 to 0.1 in increments of 0.1; guanidinoacetate, ranging from negative 0.4 to 0.2 in increments of 0.2; alpha-hydroxyisocaproate, ranging from negative 0.2 to 0.4 in increments of 0.2; ribitol, ranging from negative 0.2 to 0.2 increments of 0.1; ribonate, ranging from negative 0.2 to 0.2 in increments of 0.1; kynurenine, ranging from negative 0.3 to 0.2 in increments of 0.1, and azelate, ranging from negative 0.3 to 0.6 in increments of 0.3 (y-axis) across a (control), b [Glyphosate (0.5 milligrams per kilogram body weight per day)], c [Glyphosate (50 milligrams per kilogram body weight per day)], d [Glyphosate (175 milligrams per kilogram body weight per day)], e [MON 52276 (0.5 milligrams per kilogram body weight per day)], f [MON 52276 (50 milligrams per kilogram body weight per day)], and g [MON 52276 (175 milligrams per kilogram body weight per day)] (x-axis) for adjusted lowercase p equals 6.5E-26, 0.004; 0.002; 0.002; 0.002; 0.002; 0.002; 0.005; 0.005; 0.01; 0.01; 0.01; 0.01; 0.02; 0.02; 0.02; 0.02; 0.02; 0.02; 0.02; 0.03; 0.03; 0.03; 0.03; 0.04; 0.04; 0.04; 0.04; 0.04; 0.05; 0.05; 0.05; and 0.05, respectively.](https://cdn.ncbi.nlm.nih.gov/pmc/blobs/2927/7839352/0a4dff4af4c0/ehp6990_f4.jpg)
![Figure 5A is an error bar graph plotting alpha diversity (Shannon Index), ranging from 5.2 to 6.0 in increments of 0.2 (y-axis) across a (control), b [Glyphosate (0.5 milligrams per kilogram body weight per day)], c [Glyphosate (50 milligrams per kilogram body weight per day)], d [MON 52276 (0.5 milligrams per kilogram body weight per day)], and e [MON 52276 (50 milligrams per kilogram body weight per day)] (x-axis). Figure 5B nonmetric multidimensional scaling 2, negative 0.1 to 0.1 in increments of 0.1 (y-axis) across nonmetric multidimensional scaling 1, ranging from negative 0.1 to 0.2 in increments of 0.1 (x-axis) for a (control), b [Glyphosate (0.5 milligrams per kilogram body weight per day)], c [Glyphosate (50 milligrams per kilogram body weight per day)], d [MON 52276 (0.5 milligrams per kilogram body weight per day)], and e [MON 52276 (50 milligrams per kilogram body weight per day).](https://cdn.ncbi.nlm.nih.gov/pmc/blobs/2927/7839352/c37dc8d559f0/ehp6990_f5.jpg)
![Figure 6A is a set of five stacked area graphs titled control, Glyphosate (0.5 milligrams per kilogram body weight per day), Glyphosate (50 milligrams per kilogram body weight per day), MON 52276 (0.5 milligrams per kilogram body weight per day), and MON 52276 (50 milligrams per kilogram body weight per day) plotting Abundance (percentage), 0 to 100 in increments of 25 (y-axis) for Firmicutes, Bacteriodetes, Proteoacteria, Actinobacteria, Spirochetes, Euryarchaeota, Fusobacteria, Cyanobacteria, and others. Figure 6B is a set of five stacked area graphs titled control, Glyphosate (0.5 milligrams per kilogram body weight per day), Glyphosate (50 milligrams per kilogram body weight per day), MON 52276 (0.5 milligrams per kilogram body weight per day), and MON 52276 (50 milligrams per kilogram body weight per day), plotting Abundance (percentage), 0 to 30 in increments 10 (y-axis) for Bacteroides capillosus, Ruminococcaceae bacterium D16, Eubacterium rectale, Clostridium phytofermentans, Clostridium proteoclasticum, Clostridium saccharolyticum, Prevotella ruminicola, and Ruminococcus albus, respectively. Figures 6C to 6F are error bar graphs plotting Shinella zoogleoides (percentage), ranging from 0.000 to 0.075 in increments of 0.025; Eggerthellaceae H G M 04355, ranging from 0.0 to 2.0 in increments of 0.5; Acinetobacter johnsonii (percentage), ranging from 0.002 to 0.006 in increments of 0.002; and Akkermansia muciniphila (percentage), ranging from 0.06 to 0.12 in increments of 0.02 (y-axis) across a (control), b [Glyphosate (0.5 milligrams per kilogram body weight per day)], c [Glyphosate (50 milligrams per kilogram body weight per day)], d [MON 52276 (0.5 milligrams per kilogram body weight per day)], and e [MON 52276 (50 milligrams per kilogram body weight per day)], respectively. Figure 6G is a set of eight error bar graphs plotting metC cyc-S-conjugate lyase (counts per million), ranging from 30 to 90 in increments of 30; K00870 protein kinase (counts per million), ranging from 0 to 150 in increments of 50; acetoacetyl-CoA reduction (counts per million), ranging from 0 to 60 in increments of 20; rihA ribonucleoside hydrolase (counts per million), ranging from 0 to 60 in increments of 20, pseC transaminase (counts per million), ranging from 0 to 125 in increments of 25; M G L L acylglycerol lipase (counts per million), ranging from 50 to 150 in increments of 50; rifL oxidoreductase (counts per million), 0 to 120 in increments of 30; and buk; butyrate kinase (counts per million), ranging from 40 to 160 in increments of 40 (y-axis) across a (control), b [Glyphosate (0.5 milligrams per kilogram body weight per day)], c [Glyphosate (50 milligrams per kilogram body weight per day)], d [MON 52276 (0.5 milligrams per kilogram body weight per day)], and e [MON 52276 (50 milligrams per kilogram body weight per day)], respectively.](https://cdn.ncbi.nlm.nih.gov/pmc/blobs/2927/7839352/95850810c3f0/ehp6990_f6.jpg)
Similar articles
-
The glyphosate formulation Roundup® LB plus influences the global metabolome of pig gut microbiota in vitro.Sci Total Environ. 2020 Nov 25;745:140932. doi: 10.1016/j.scitotenv.2020.140932. Epub 2020 Jul 17. Sci Total Environ. 2020. PMID: 32731069
-
The Ramazzini Institute 13-week pilot study on glyphosate and Roundup administered at human-equivalent dose to Sprague Dawley rats: effects on the microbiome.Environ Health. 2018 May 29;17(1):50. doi: 10.1186/s12940-018-0394-x. Environ Health. 2018. PMID: 29843725 Free PMC article.
-
Glyphosate and glyphosate-based herbicide exposure during the peripartum period affects maternal brain plasticity, maternal behaviour and microbiome.J Neuroendocrinol. 2019 Sep;31(9):e12731. doi: 10.1111/jne.12731. Epub 2019 May 26. J Neuroendocrinol. 2019. PMID: 31066122
-
Impact of glyphosate (RoundupTM) on the composition and functionality of the gut microbiome.Gut Microbes. 2023 Dec;15(2):2263935. doi: 10.1080/19490976.2023.2263935. Epub 2023 Oct 6. Gut Microbes. 2023. PMID: 38099711 Free PMC article. Review.
-
Safety evaluation and risk assessment of the herbicide Roundup and its active ingredient, glyphosate, for humans.Regul Toxicol Pharmacol. 2000 Apr;31(2 Pt 1):117-65. doi: 10.1006/rtph.1999.1371. Regul Toxicol Pharmacol. 2000. PMID: 10854122 Review.
Cited by
-
Associations between urine glyphosate levels and metabolic health risks: insights from a large cross-sectional population-based study.Environ Health. 2024 Jun 27;23(1):58. doi: 10.1186/s12940-024-01098-8. Environ Health. 2024. PMID: 38926689 Free PMC article.
-
Glyphosate-based herbicide metabolic profiles in human urine samples through proton nuclear magnetic resonance analysis.ADMET DMPK. 2024 Dec 8;12(6):957-970. doi: 10.5599/admet.2476. eCollection 2024. ADMET DMPK. 2024. PMID: 39713254 Free PMC article.
-
Metabolomics and lipidomics strategies in modern drug discovery and development.Drug Discov Today. 2023 Oct;28(10):103751. doi: 10.1016/j.drudis.2023.103751. Epub 2023 Aug 26. Drug Discov Today. 2023. PMID: 37640150 Free PMC article. Review.
-
Urinary Glyphosate Concentrations among Pregnant Participants in a Randomized, Crossover Trial of Organic and Conventional Diets.Environ Health Perspect. 2023 Jul;131(7):77005. doi: 10.1289/EHP12155. Epub 2023 Jul 26. Environ Health Perspect. 2023. PMID: 37493357 Free PMC article. Clinical Trial.
-
Impacts of dietary exposure to pesticides on faecal microbiome metabolism in adult twins.Environ Health. 2022 May 3;21(1):46. doi: 10.1186/s12940-022-00860-0. Environ Health. 2022. PMID: 35501856 Free PMC article.
References
-
- Abraham W, inventor; Monsanto Technology LLC, assignee. Glyphosate formulations and their use for the inhibition of 5-enolpyruvylshikimate-3-phosphate synthase. US patent 7,771,736. 10 August 2010.
-
- Adam A, Marzuki A, Abdul Rahman H, Abdul Aziz M. 1997. The oral and intratracheal toxicities of ROUNDUP and its components to rats. Vet Hum Toxicol 39(3):147–151, PMID: 9167243. - PubMed
-
- Aristilde L, Reed ML, Wilkes RA, Youngster T, Kukurugya MA, Katz V, et al. 2017. Glyphosate-induced specific and widespread perturbations in the metabolome of soil Pseudomonas species. Front Environ Sci 5:34, 10.3389/fenvs.2017.00034. - DOI
Publication types
MeSH terms
Substances
Supplementary concepts
LinkOut - more resources
Full Text Sources
Other Literature Sources
Medical
Miscellaneous
