. 2021 Feb 1;153(2):e202012687.
doi: 10.1085/jgp.202012687.

Loss of the K+ channel Kv2.1 greatly reduces outward dark current and causes ionic dysregulation and degeneration in rod photoreceptors

Affiliations

Loss of the K+ channel Kv2.1 greatly reduces outward dark current and causes ionic dysregulation and degeneration in rod photoreceptors

Christopher Fortenbach et al. J Gen Physiol. .

Abstract

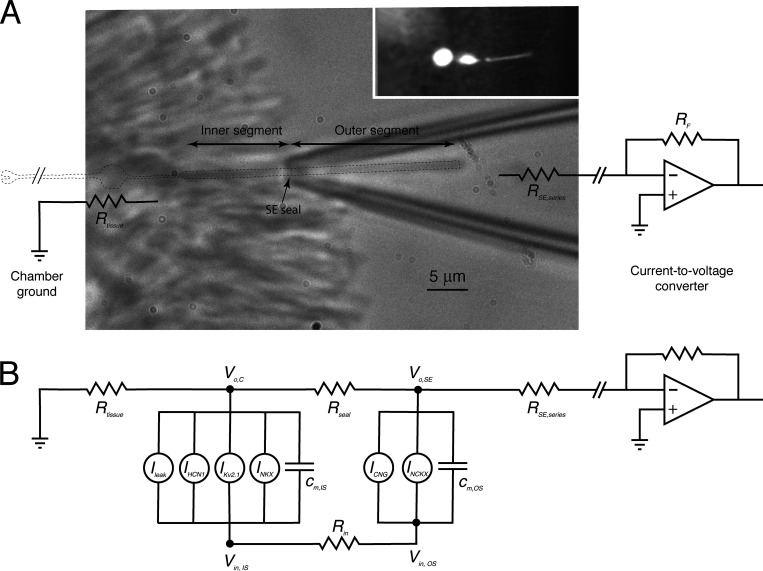
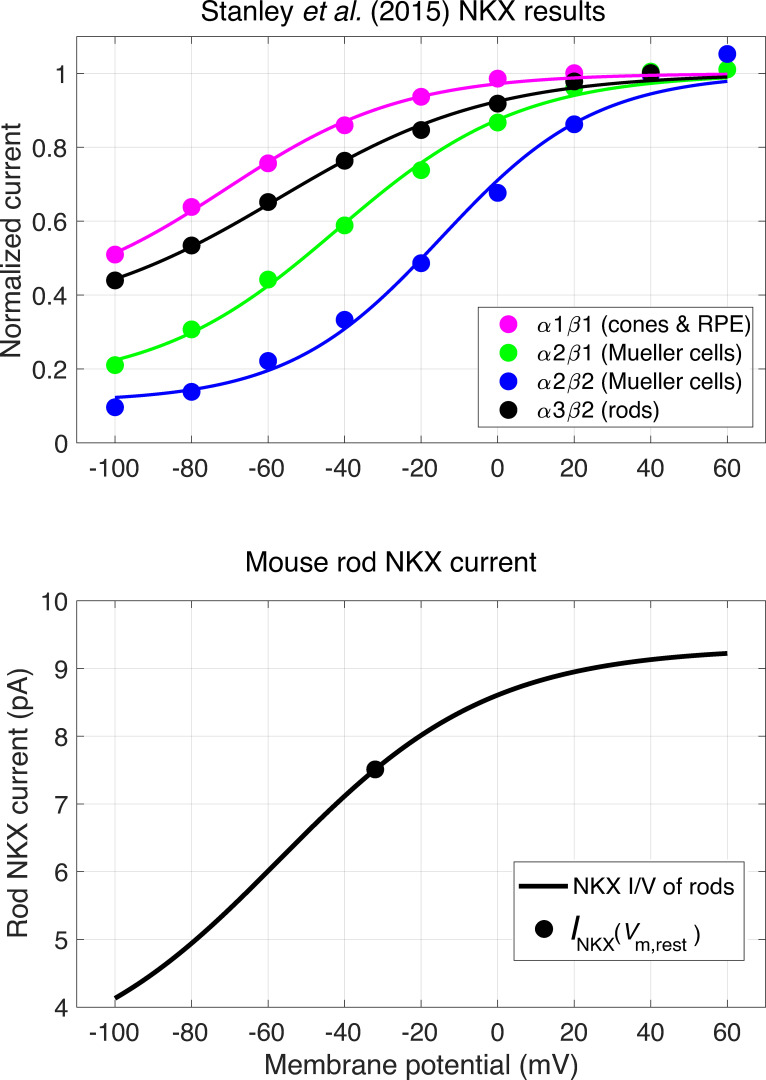
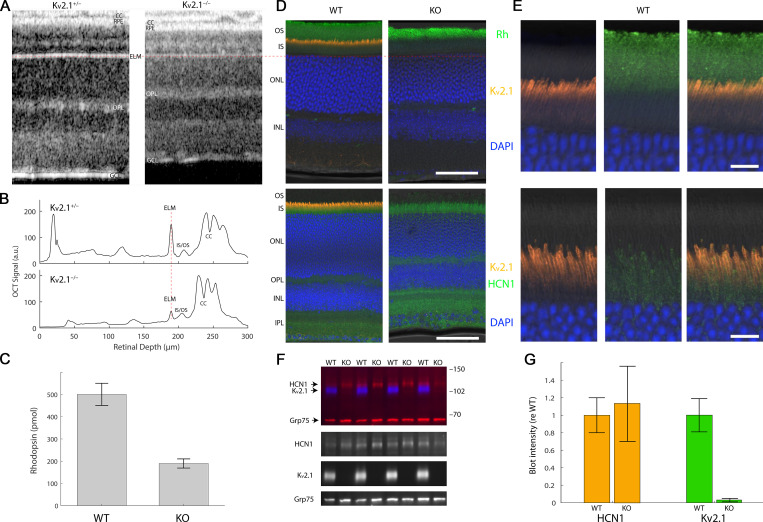
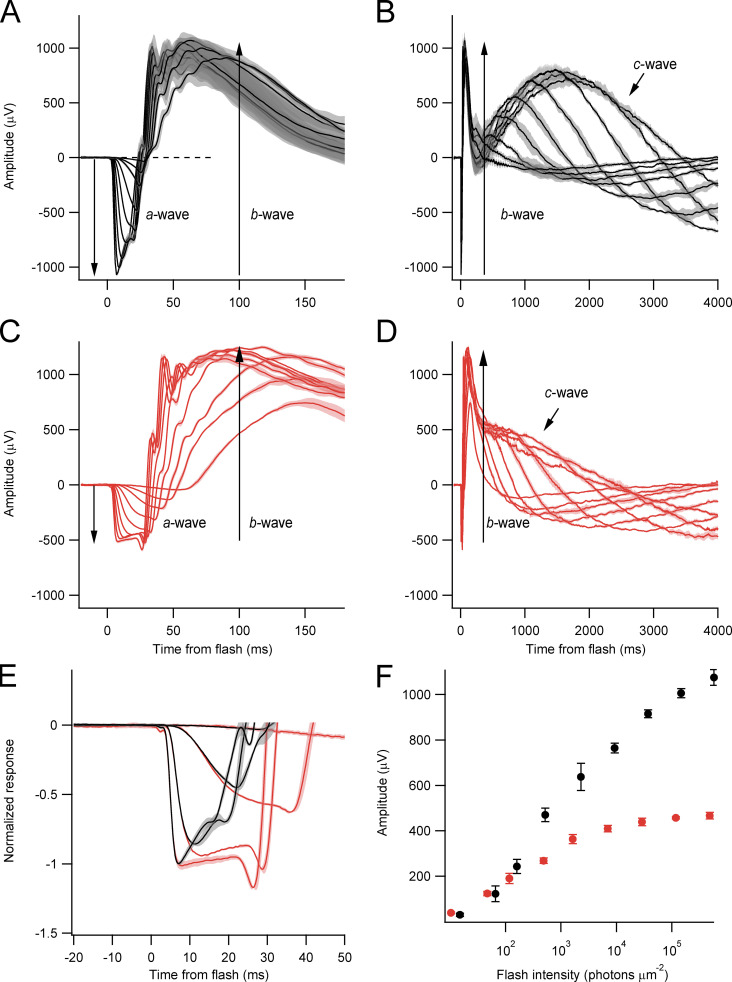
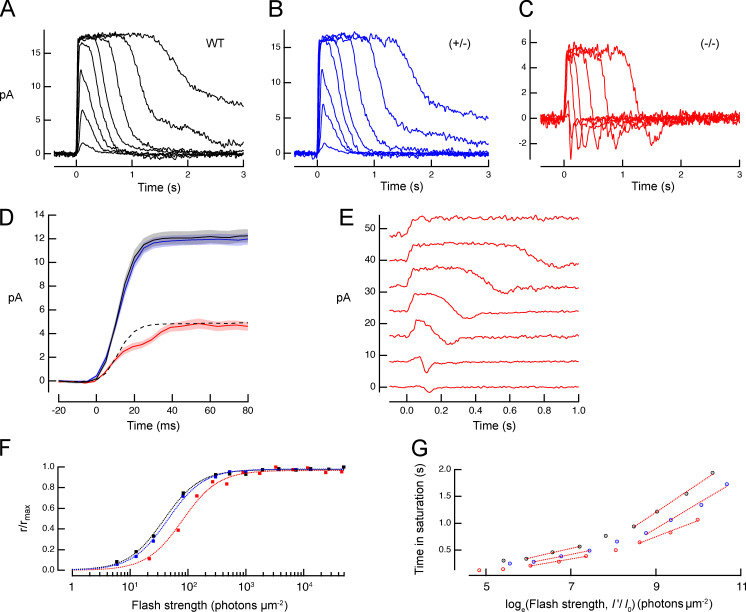
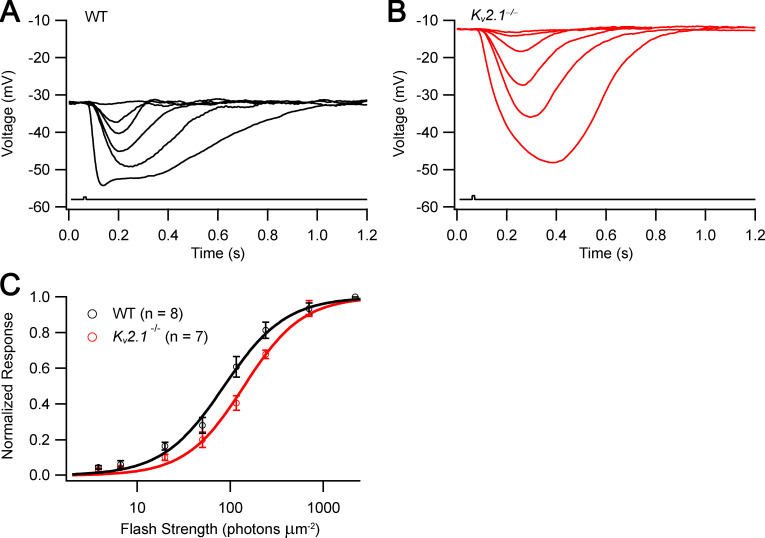
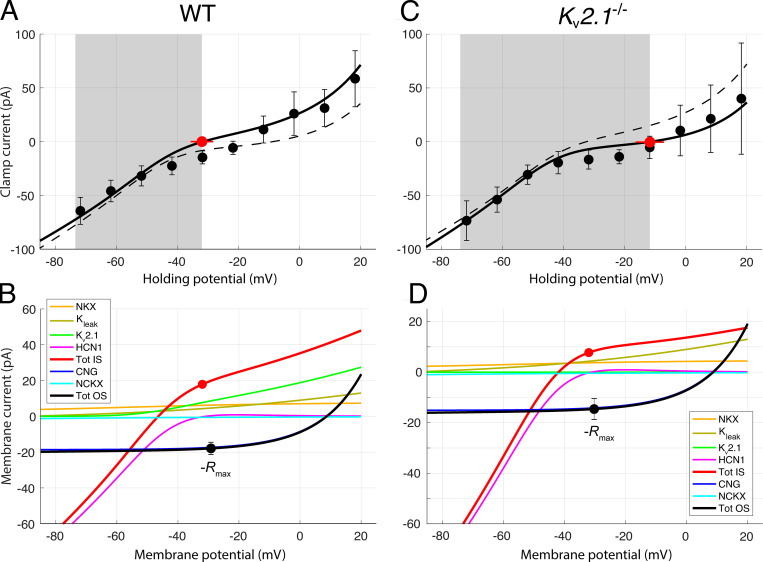
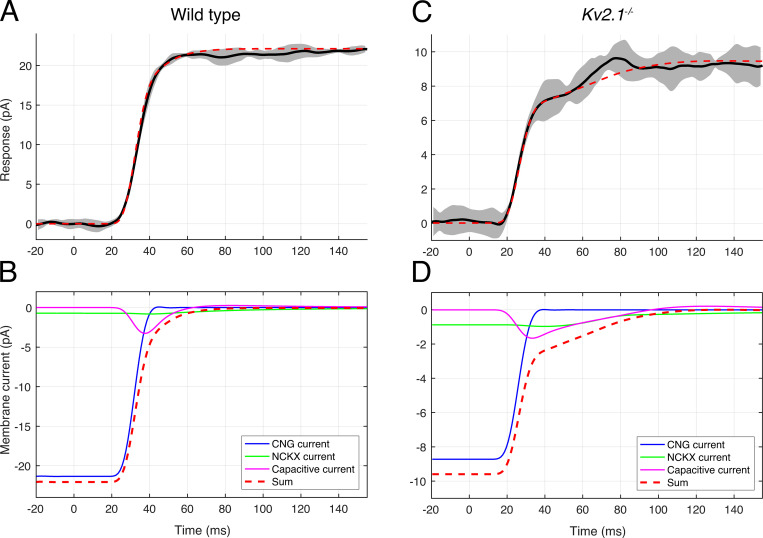
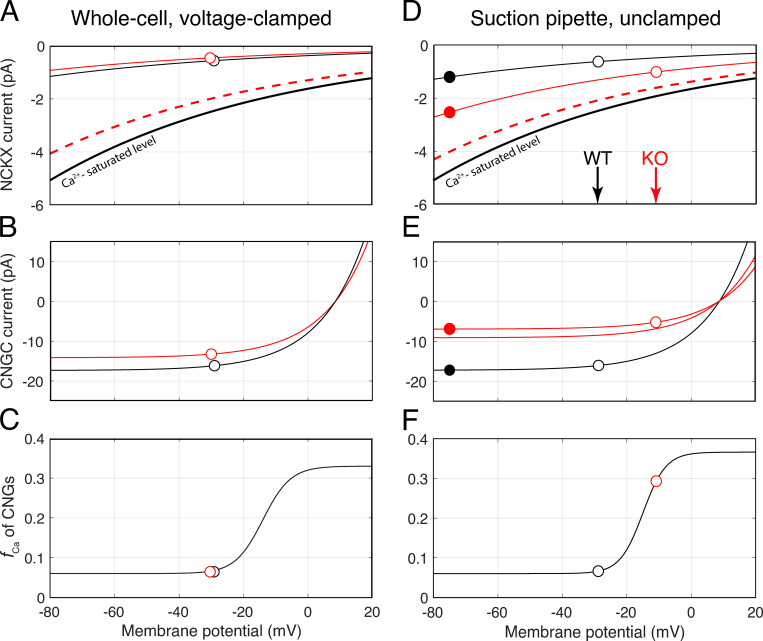
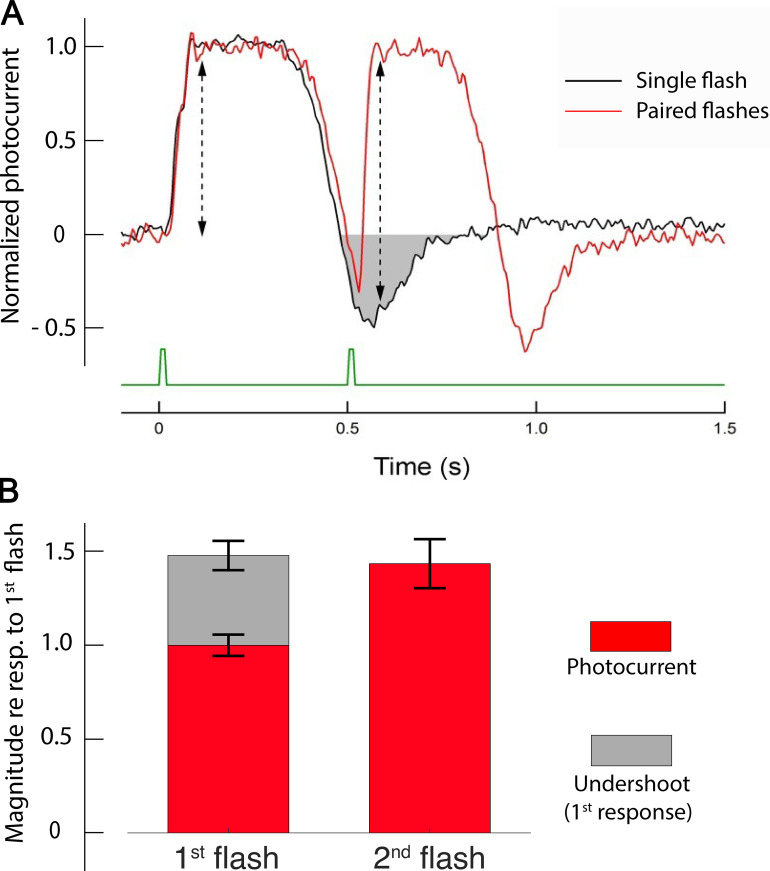
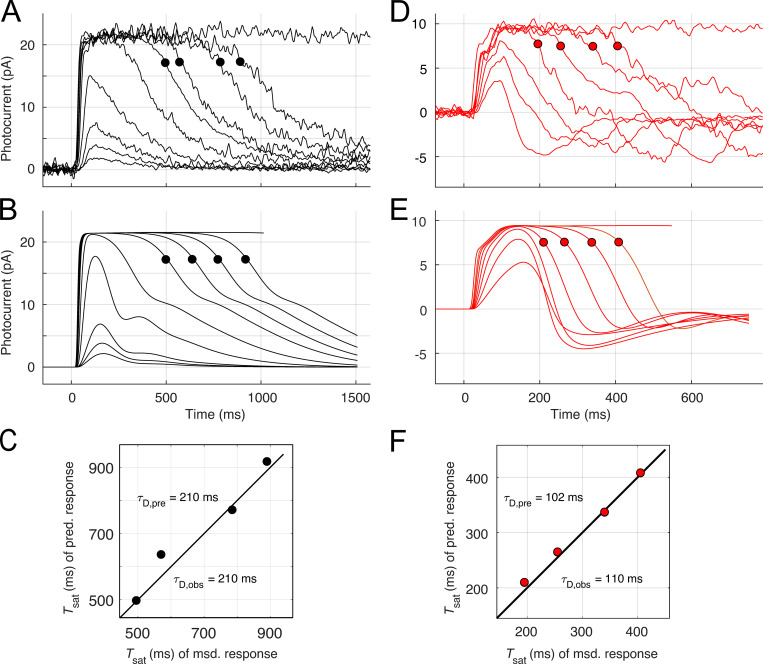
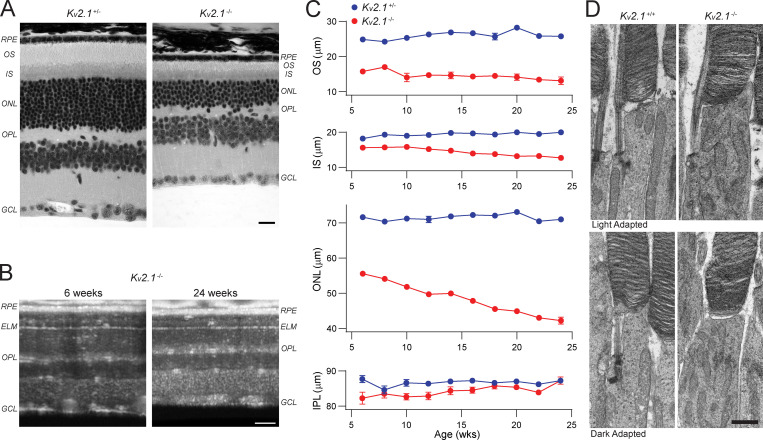
Vertebrate retinal photoreceptors signal light by suppressing a circulating "dark current" that maintains their relative depolarization in the dark. This dark current is composed of an inward current through CNG channels and NCKX transporters in the outer segment that is balanced by outward current exiting principally from the inner segment. It has been hypothesized that Kv2.1 channels carry a predominant fraction of the outward current in rods. We examined this hypothesis by comparing whole cell, suction electrode, and electroretinographic recordings from Kv2.1 knockout (Kv2.1-/-) and wild-type (WT) mouse rods. Single cell recordings revealed flash responses with unusual kinetics, and reduced dark currents that were quantitatively consistent with the measured depolarization of the membrane resting potential in the dark. A two-compartment (outer and inner segment) physiological model based on known ionic mechanisms revealed that the abnormal Kv2.1-/- rod photoresponses arise principally from the voltage dependencies of the known conductances and the NCKX exchanger, and a highly elevated fraction of inward current carried by Ca2+ through CNG channels due to the aberrant depolarization. Kv2.1-/- rods had shorter outer segments than WT and dysmorphic mitochondria in their inner segments. Optical coherence tomography of knockout animals demonstrated a slow photoreceptor degeneration over a period of 6 mo. Overall, these findings reveal that Kv2.1 channels carry 70-80% of the non-NKX outward dark current of the mouse rod, and that the depolarization caused by the loss of Kv2.1 results in elevated Ca2+ influx through CNG channels and elevated free intracellular Ca2+, leading to progressive degeneration.


Figures

Figure 1.
Figure 1.
Schematic of a rod with its outer segment in an SE. (A) Infrared image of a Kv2.1+/− rod outer segment in a suction pipette with overlay of key elements of the electrical recording system, and outline of the outer and inner segments (dashed line). A physical model of the pipette with neck constriction length of 4–5 µm accounts for the measured resistance of the pipette without (2.5 MΩ) and with (5.0 MΩ) the rod drawn into the pipette, constraining the seal and series resistances to Rseal ∼3.3 MΩ and Rseries ∼1.7 MΩ, giving an overall collection efficiency for the current-divider circuit of approximately two thirds. The inset shows an image of a rod filled with fluorescein during a WC recording experiment from a retinal slice; the electrode (hazy fluorescence shadow at left) was sealed to the cell body. (B) Two-compartment electrical schematic of the rod identifying the respective currents of the inner and outer segments. All current components, including those in the outer segment, have material voltage dependence in the highly depolarized Kv2.1/– rod (Fig. 5). Resistance values used: Rtissue = 10 KΩ; Rin = 158 MΩ and 113 MΩ for WT and KO rods, respectively.
Figure S1.
Figure S1.
Extraction of the shoulder amplitudes of Kv2.1−/− rod photocurrents. (A) Saturating photocurrent responses of a Kv2.1−/− rod to flashes of four intensities: 7.3 × 10⁴, 3.9 × 10⁴, 1.9 × 10⁴, and 1.1 × 10⁴ photons μm−2 (identified by the nominal neutral density filters labels f0, f3, f6, and f9). Each trace is the average of 2–4 responses. The raw traces were first scaled by 1.5× to adjust for SE collection efficiency (two thirds), and then were interpolated on a 100-µs time grid using the MATLAB “interp1” routine with the piecewise cubic Hermite interpolating polynomial (pchip) option. (B) Same traces as in A, but slid laterally for concurrence in the initial portion of the rising phase. (C) Average of traces in B (thick black line), plotted with running error bar (gray region) corresponding to ±2 SDs (C is replotted as Fig. S2 F). (D) Amplitudes of the shoulder levels of the traces in B, taken as the average of each trace over the interval 37–43 ms, and plotted as a function of the nominal ND filter density. (E) Saturated amplitudes of the responses in B, taken as the average amplitude over the interval 120–400 ms. (F) Scatterplot of the results in D and E. The tight bunching of the points implies that the shoulder amplitude was invariant with flash strength over this range of intensities. (G) Scatterplot of the amplitudes of the shoulders versus those of the saturating photocurrent for a population of Kv2.1−/− rods recorded with SEs and analyzed as in A–F (Pearson r = 0.84, P < 10−6); each symbol is the result from an analysis such as shown in A–F, and is thus the average of the x and y values in a panel like F. The black line is an unconstrained straight line fitted to the data by least squares, has a slope of 0.72, and accounts for 71% of the variance, i.e., r2 = 0.71. Based on the kinetics and light dependence (compare Fig. 4 and Fig. 7), the component of the photocurrent below the shoulder can be assigned unambiguously to suppression of CNG current, and so the slope of the line indicates that on average, CNG current suppression comprises 72% of the Kv2.1−/− photocurrent regardless of the underlying cause of cell-to-cell variation (which may arise, for example, from outer segment length variation). The blue line is the upper limit set by the hypothesis fCa = 1 (Eq. 5): four of the data points fall above the limit, and many others are situated close to the limit. (H) The magnitudes of the residual (non-CNG channel) saturating Kv2.1−/− rod photocurrents are plotted against the total photocurrent amplitude. In this plot, the hypothesis fCa = 1 is represented by the red line; theory (Eq. 5) predicts that no points can lie below this line if the magnitudes of the two components correspond to the dark levels of the CNG and NCKX currents; many of the points lie very near or below the limit. The closer the points to the line, the higher resting Ca2+ would be expected to be (the cyan symbols in G and H are from the rod whose photocurrents are analyzed in A–F). Avg., average; Sat, saturation.
Figure S2.
Figure S2.
Decomposition of the amplitude and rate-saturated photocurrents of Kv2.1−/− rods into three membrane current components: CNG, NCKX, and capacitive. Related to Fig. 7. The traces (heavy black line) are averages of several responses to flashes of at least three intense flash strengths up to 20,000 photons μm−2. The responses to different flash strengths were interpolated on a 100-µs grid and shifted for maximal congruence with the early rising phase (CNG channel closure) of the most intense flash. The running error (gray shaded region) is ±1 SD. A–H provide three numbers characterizing the theory traces: the saturated photocurrent (PC) amplitude; fNCKX, the fraction of the photocurrent ascribed to NCKX current; and Carest, the estimated Ca2+i in the dark-adapted rod immediately before the flash. The panels are arranged in order of increasing CaD, which ranges from approximately two times normal (A, 560 nM) to >4 µM (G); in the latter case, Carest greatly exceeds the internal binding constant Kex (1.1 µM) of the NCKX, which serves as a gauge (Fig. 7). The “average” value of Carest is 10-fold higher than the normal WT level. The values of fNCKX colored red exceed the naive theoretical limit of 0.33, which neglects the effect of hyperpolarization on the NCKX (the value of the half-saturation constant Kex of the NCKX current limits the reliability of estimating Carest, as it is highly nonlinearly dependent on fNCKX as the latter approaches its limit; thus, Carest estimates >4 µM were not differentiated). The preprocessing of the photocurrent data of each of the rods was performed with the procedure illustrated in Fig. S1.
Figure S3.
Figure S3.
Kinetic features of the two-state Boltzmann models of Kv2.1 and HCN1 channels used in the theoretical model. (A) Steady state activation functions for Kv2.1 (green) and HCN1 (magenta) channels. Dashed lines show description of the IKx current of rabbit rods (Beech and Barnes, 1989) and of Ih current (Demontis et al., 2002). (B) Voltage-dependence of the rate constants of closed → open (green curve) and open → closed (red curve) state transitions of the Kv2.1 model compared with the description (dashed curve) of Beech and Barnes (1989) of IKx kinetics. (C) Voltage dependence of rate constants of closed → open (green curve) and open → closed (red curve) state transitions of the HCN1 model compared with the characterization of Ih kinetics (dashed curve) by Demontis et al. (2002). In B and C, the unbroken black curve is the equilibrium rate constant, the sum of the rates described by the red and green curves (Demontis et al. (2002) did not characterize the deactivation of HCN1 channels in their experiments, and provided no information about their behavior for Vm greater than −60 mV. A two-state Boltzmann model that perfectly recapitulates their results and includes voltage-dependent deactivation predicts that rods reach a saturating hyperpolarization more negative than −80 mV, which has never been reported in rod photovoltage recordings; Baylor and Nunn, 1986; Cobbs and Pugh, 1987; Schneeweis and Schnapf, 1995; Cangiano et al., 2012). In addition, using an HCN1 two-state model that recaps the activation curve and kinetics of Demontis et al. (2002) requires the resting conductance parameter GHCN1 to be 1.75–2 nS to account for the WT I-V data of Fig. 6, because of the leftward voltage shift in pO. Further, adoption of such a two-state model predicts that the photovoltage response to flashes that strongly saturate, i.e., close, the CNG channel current will have a plateau of −60 mV, more negative than ever observed. In contrast, the two-state Boltzmann HCN1 model described herein predicts a photovoltage plateau of −53 mV.
Figure S4.
Figure S4.
Voltage dependence of NKX electrogenic current. (A) Normalized currents of different NKX isoforms from Stanley et al. (2015) (symbols), and identification of the retinal cell types in which they are expressed, including the rod isoform α3β2 (black circles). Data of each isoform were fitted using the MATLAB least squares fitting tool (cftool) with a Boltzmann function of the form of Eq. 12. For the curve describing the rod isoform data γ = 0.33, Vm,0.5 = −57.1 mV, and sNKX = 27.6 mV. (B) The voltage dependence of the NKX current in a WT mouse rod with 22 pA dark current; the smooth curve plots the function fitted to the rod isoform in panel scaled to have the magnitude (7.5 pA) of the NKX current at the resting potential (−32 mV) required to extrude all the Na+ that enters the rod outer segment through CNG channels and the NCKX exchanger. The saturating level of the WT mouse rod NKX current is thus predicted to be 9.3 pA. Analysis of the dependence of the turnover number of the NKX on K+o and Na+i (Stanley et al., 2015) along with the information that K+o = 6 mM in the SRS (Steinberg et al., 1980) predict the turnover number at the Vm,rest to be ∼45 s−1. Consequently, the rod inner segment would have a total of 1.3 × 10⁶ NKX units, and given a membrane surface area 80 µm2 (length, 15 µm; diameter, 1.7 µm), an NKX expression density of ∼16,000 µm−2.
Figure S5.
Figure S5.
Three-state guanylate cyclase (GC)–GCAPs model and Ca2+ buffering by GCAPs and recoverin. (A) Schematic of regulation of rod guanylate cyclase activity through Ca2+ and Mg2+ binding and unbinding to tightly associated GCAP1 protein (after Dizhoor et al., 2010). Each GC holomer is a dimer with three tightly associated guanylate cyclase type 1 activating proteins (GCAP1), and each GCAP1 has three functional EF hand calcium binding sites, for a total of six binding sites per GC. The calcium-bound GCAP1s inhibit the GC (inactive). When Ca2+i declines in the outer segment during the light response, Ca2+ dissociates from GCAP1 and is replaced by Mg2+, stimulating increased GC synthesis of cGMP. The schematic postulates the existence of a transient intermediate state in which the GCAPs are free of divalent cation. A parallel three-state scheme (not shown) is assumed to govern the interaction of GCAP2 with GC. (B) Decomposition of total steady state rod GC activity into a component regulated by GCAP1 and a second component regulated by GCAP2 (after Makino et al., 2008). The function defining total GC activity (black curve) is essentially that of Gross et al. (2012a), but manipulated for Ca2+i greater than the WT level (open circle at 320 nM) so that in a Kv2.1−/− rod at rest (filled circle), cGMP synthesis in the dark gives the appropriate level of CNG channel current (compare Fig. 8 B). The green and blue curves represent the activity of GC-GCAP2 and GC-GCAP1, respectively, and their summed activity is given by the red curve. The blue and green curves are determined Eq. S1 and Eq. S2 with parameters Kcyc,2 = 48 nM, ncyc,2 = 2.0, Kcyc,1 = 103 nM, and ncyc,1 = 2.3, respectively. The absolute scaling of the two curves was set by the least square fitting to the overall activity function (black curve), which saturates at 150 µM s−1; given a total GC concentration of 5 µM and the same turnover for each GC-GCAPj enzyme complex, the fitted concentrations of the two components are GC-GCAP1 = 1.77 µM and GC-GCAP2 = 3.23 µM. (C) Rod Ca2+ buffer power can be described in terms of Ca2+ binding by the EF hand proteins, GCAP1 and GCAP2, with three functional Ca2+ binding sites each; and recoverin, with two functional Ca2+ binding sites. Given the known stoichiometry of Ca2+ binding and the concentrations of GC (taken to be 5 µM referred to the outer segment cytoplasm) and recoverin (taken to be 25 µM), overall buffer power can be computed. The results of the calculation (thickened black curve) are compared with description of calcium buffering of salamander rods by Lagnado et al. (1992) (black dashed curve); also shown is the latter curve scaled by 65% (lighter dashed curve). The symbols plot the calculated Ca2+ buffer power at the resting Ca2+ levels of the WT (open circle) and Kv2.1−/− rod (filled circle; a buffer component with calcium-independent buffer power of 5 is not plotted; this component helps stabilize Ca2+i at nanomolar concentrations where the buffering power of GCAP2 declines).
Scheme 1.
Scheme 1.
Four-state CNG channel model incorporating control by both cGMP and membrane potential (Vm), with the latter determining whether the channel is blocked by divalent cations or unblocked. The four boxes identify the concentrations of channels in the open-blocked (OB), open-unblocked (OU), closed-blocked (CB), and closed-unblocked states. The simplest dynamic version consistent with Eq. 2 has voltage-dependent rates that are independent of cGMP and cGMP-dependent rates independent of membrane potential. The dynamic model potentially allows transitions blocked → unblocked and unblocked → blocked to have different dependence on membrane potential, which could serve to stabilize CNG current against rapid increases in Ca2+.
Figure 2.
Figure 2.
OCT reveals thinning of photoreceptor layers of the Kv2.1−/− retina, and immunostaining distinctive patterns of Kv2.1 and HCN1 expression in the rod IS. (A) OCT B-scans of central retina of live heterozygous and Kv2.1−/− mice. CC, choriocapillaris; OPL, outer plexiform layer; GCL, ganglion cell fiber layer. The OCT B-scans have been aligned at the ELM; a red dashed line through the ELM is extended across the figure to the histochemical sections in D to show alignment of the two kinds of section. (B) Axial profile plots of the scattering intensity of the B-scans in A, aligned at the ELM (red dashed line) to help identify highly scattering retinal features. (C) Measurement of rhodopsin content of WT and Kv2.1−/− (KO) retinas (n = 5 retinas from three mice of each genotype). Error bars are SD. (D) Retinal sections stained for Kv2.1 and HCN1 reveal Kv2.1 expression to be narrowly confined to the apical inner segment compartment of photoreceptors (orange), while HCN1 resides more broadly in the basal inner segment as well as the synaptic layers (bottom, green). Scale bars, 20 µm. (E) Higher magnified views of representative sections of WT retina shown in D, with red, green, and merged channels separately shown to highlight the differences in Kv2.1 and HCN1 channel staining. Scale bars, 5 μm. (F) Representative immunoblot of homogenates of WT and Kv2.1−/− mice labeled with antibodies for Kv2.1 (blue) and HCN1 (red, upper band), with Grp75 served as loading control (red, lower band). Numbers at right indicate positions of molecular weight standards (kD). Individual regions/channels from the blot are also shown below in black and white. (G) Quantification of Kv2.1 and HCN1 protein levels by Western blot (mean ± SEM, n = 10 mice/group). Fluorescence intensities were background-subtracted, normalized by the loading control (Grp75), and expressed relative to WT. HCN1 expression was not statistically different between WT and KO samples (P > 0.05).
Figure 3.
Figure 3.
Rod-driven ERG a-waves are reduced 50% in amplitude in the Kv2.1−/− retina. (A and C) ERG response families from WT (black) and Kv2.1−/− mice (red). The initial corneal-negative component is the a-wave, whose underlying generator is the suppression of the rod circulating current. The immediately following corneal-positive component is the b-wave, whose generators are largely the ON (depolarizing) bipolar cells post-synaptic to the rods and cones (see labels). Range of flash strengths is shown in F. (Lighter bands surrounding the traces are running SEMs of recordings to the same stimuli from multiple mice (n = 4 for Kv2.1−/−; n = 5 for WT, age 42 d). (B and D) The same ERGs as in A and C presented on a much slower time base to display the corneal-positive going c-waves. (E) Representation of a selection of the a-waves from A and C after normalization to −1 reveals the rising phase of the a-waves of the WT and Kv2.1−/− mice to have similar activation kinetics and dependence on flash strength. (F) Dependence of the a-wave amplitude on flash intensity for WT (black symbols) and Kv2.1−/− (red symbols) mice.
Figure 4.
Figure 4.
In the absence of Kv2.1 channels, rods generate a reduced photocurrent response whose rising phase has a shoulder, and whose recovery phase undershoots the dark-adapted baseline. (A–C) Families of photocurrent responses of a WT rod, a rod of a Kv2.1−/− mouse (−/−), and one from a heterozygote (+/−). Flash strengths ranged from 7 to 4,000 photons μm−2. (D) A comparison of averaged saturating photocurrent responses of WT and Kv2.1−/− rods; the dashed line presents the WT response scaled to the amplitude of the Kv2.1−/− response. (E) Selected responses from C separated and replotted on an expanded time scale (arbitrarily shifted vertically with the response to the dimmest flash at the bottom). (F) Response versus intensity relations extracted from the response families in A–C (traces for some strongly saturating responses are not shown in A–C). Data were fitted with exponential saturation functions, 1 − exp(−I/Io) with Io values of 108, 112, and 262 photons μm2 for the WT, +/−, and −/− rod responses, respectively. (G) Pepperberg plot of time in saturation as a function of the logarithm of the flash strength. The abscissa values (I’) were scaled by the ratio of the Io value of each group to Io for the WT group. The slope of the lower component estimates the dominant recovery time constant for flashes producing less than ∼1 photoisomerization per disc face; see Table 2 for average values.
Figure 5.
Figure 5.
Current clamp photovoltage responses of Kv2.1−/− rods have greatly slowed rising phases. (A) Photovoltage family of a WT rod. (B) Photovoltage family of a Kv2.1−/− rod. Flash strengths ranged from 8 to 800 photons μm2. (C) Average response versus intensity functions for photovoltage responses; smooth curves are exponential saturation functions (the flash strengths available in the slice recording apparatus were limited in range to ∼10-fold less than those used in the SE experiments; theory and experiments in other species show that the nose seen in the WT response to the strongest flash [A] is expected to reach approximately −75 mV, with relatively rapid relaxation to the approximately −55 mV plateau; Baylor and Nunn, 1986; Cobbs and Pugh, 1987; Schneeweis and Schnapf, 1995; Cangiano et al., 2012).
Figure 6.
Figure 6.
Contributions of outer segment and inner segment ionic mechanisms to the voltage clamp currents of dark-adapted WT and Kv2.1−/− rods. (A and C) WC voltage clamp current as a function of holding potential for a population of dark-adapted WT (A; n = 5) and Kv2.1−/− (B; n = 5) mouse rods; error bars are 95% confidence intervals, and the shaded gray areas reflect the observed physiological range of membrane potentials measured from the WC recordings. Zero-current holding potentials (filled red symbols with lateral error bars; Table 2) were measured immediately upon WC access. The solid black curves are generated as the sum of the red and black curves in the respective lower panels. In A and C, the dashed curves present the I-V curve used to describe the data of the other genotype; thus, for example, the dashed curve in A replots the unbroken black curve in C. (B) Component analysis of the voltage clamp current of the dark-adapted WT rod. The two outer segment inward components are CNG current (dark blue) and NCKX current (cyan); their sum is given by the black curve; this curve was required to go through the filled black symbols, which plot the negative of the photocurrents (−Rmax, Table 3) measured at the effective outer segment holding potential; the error bars are 95% confidence intervals. The CNG current curve is the Boltzmann function of Eq. 3 with reversal potential VCNG = +8.5 mV and steepness factor sCNG = 14 mV (Baylor and Nunn, 1986). The NCKX current curve is given by Eq. 4, with VNCKX = −14 mV, sNCKX = 70 mV, KNCKX = 1,100 nM (Schnetkamp et al., 1991), and INCKX,sat(VNCKX) = −2.0 pA and −1.6 pA for WT and Kv2.1−/−, respectively (Lagnado and McNaughton, 1991). The inner segment components are the NKX electrogenic current (α3β2 isoform; Eq. 12; Supplemental text), Kv2.1 and HCN1 currents, and an unidentified K+ leak current; the sum of the inner segment components is given by the red curve. The Kv2.1 curve was generated with Eq. 10b with PK adjusted so that the current at Vm,rest is 9.1 pA, corresponding (with EK = −91 mV) to GKv2.1 = 0.18 nS (Eq. 10a). The leak current magnitude is assumed to be identical in both genotypes, and has the magnitude 2.7 pA at −32.0 mV. The HCN1 I-V curve was generated with Eq. 11 with GHCN1,rest = 1.45 nS and EHCN1 = −31 mV. The sum of the red and black curves in B is plotted as the black curve in A. The inner segment zero-current holding potential is plotted as a red circle at the average Vm, rest for WT rods (−32 mV). The filled black circle, which has the same magnitude, is plotted at the resting potential of the outer segment, which is situated slightly positively relative to the red symbol because the circulating current flows through the internal resistance of the rod (Fig. 1). At the WT resting potential, the currents are not only in electrical equilibrium but also produce homeostasis of the permeant ions Na+, K+, and Ca2+, based on the stoichiometry and other properties of the NCXK and NKX exchangers (see Theory). (D) Component analysis of the Kv2.1−/− rod dark current. The components are the same as those of the WT rod, but in the absence of Kv2.1 channels, an unidentified K+ leak current of 5.0 pA at the resting potential (−12 mV) of the inner segment is required for electrical balance. Extrapolated to Vm,rest of the WT rod, this current would have the amplitude 2.7 pA, which is equal to the magnitude of the leak current assigned to the WT rod at Vm,rest in B. For the HCN1 current, GHCN1,rest = 1.6 nS, and EHCN1 = −31 mV as in the WT rod. At the resting potential, the Kv2.1 current accounts for 80% of the total non-NKX, non-HCN1 outward current (the ordinate scale in D has been expanded relative to that in B to facilitate inspection of the component curves).
Figure 7.
Figure 7.
Decomposition of the bright-flash photocurrents of WT and Kv2.1−/− rods into components from CNG channel, NCKX, and capacitive currents. (A) Solid black line presents the average photocurrent of an individual WT rod, adjusted for a suction pipette collection efficiency of two thirds; the gray band presents the running SD of the traces averaged. The position of the data trace on the time axis was not adjusted for the flash duration (10 ms) or the analogue filtering (30 Hz, eight-pole Bessel) in this plot. (B) The three components comprising the theoretical photocurrent response are separately plotted as membrane current (see legend on figure). The theoretical currents were digitally filtered by a 30 Hz, eight-pole Bessel filter whose characteristics matched those used in the suction pipette recordings, and otherwise were adjusted only for a several-millisecond delay arising from the early stages of phototransduction (Lamb and Pugh, 1992), and 5 ms for the flash duration. The sum of the three components (red dashed line) is identical to the dashed red trace shown in A, except for the baseline offset, which converts the trace in A to “photocurrent.” (C and D) The same analysis as in A and B of the photocurrent of a Kv2.1−/− rod. Here the NCKX and capacitive currents contribute almost equally in determining the shoulder amplitude. The fraction of the saturated photocurrent attributable to the NCKX is 0.2, 3.3-fold greater than that (0.06) estimated for the WT mouse rod (Makino et al., 2004), and the estimated Ca2+i 1,030 nM. Similar results were obtained from analysis of the saturating photocurrents of an additional population of Kv2.1−/− rods (Fig. S2).
Figure 8.
Figure 8.
Voltage dependence of NCKX current, CNG channel current, and the fraction of CNG current carried by Ca2+ for voltage clamped and unclamped conditions. (A) Dependence of the NCKX current on membrane potential for the average WT and Kv2.1−/− (KO) rod under WC voltage-clamp to the WT resting potential, −32 mV. The black (WT) and red (KO) curves plot the I-V curve of the rod NCKX (Lagnado and McNaughton, 1990; Eq. 4) scaled to pass through the values (open circles) based on the assumption that the rods have the same normal resting Ca2+i, Cadark = 320 nM. The thicker black curve plots the calcium-saturated NCKX activity function of the WT rod, obtained by scaling the curve for the resting condition by (320 + Kex)/320, with Kex = 1,100 nM (Schnetkamp et al., 1991). The dashed red curve plots the calcium-saturated NCKX activity function of the Kv2.1−/− rod, adjusted for the shorter average length of its outer segment. (B) Dependence of the CNG channel current on membrane potential for WT and Kv2.1−/− rods (Eq. 3); the symbols plot the negative of the Rmax values in Table 3 (the lateral offset of the symbols arises from differential depolarization of the outer segments when the inner segment is clamped to the same potential; cf. Fig. 1). (C) Fraction of the CNG current carried by Ca2+ (the smooth curve is the same at that in F). (D) Dependence of NCKX current on membrane potential of average WT and Kv2.1−/− (KO) rod under unclamped conditions; open symbols plot the values at respective resting potentials, while filled symbols give measured values upon maximal hyper-polarization. (E) CNG channel current dependence on membrane potential; the filled symbols represent the saturated magnitude of recorded currents, while the open symbols represent the values projected along the curves to the unclamped resting potentials. For the WT rod, the saturated photocurrent (CNG + NCKX) is 20 pA; for the KO rod, 9.5 pA. The red curve not drawn through the points represents the CNG current that would have been recorded if the KO rod had the same length as the WT rod. Depolarization alone cannot fully account for the ratio of the KO to WT currents, so based on Eq. 3, an ∼12% reduction in resting cGMP level by elevated Ca2+i is implicated. (F) Dependence of fCa, the fraction of CNG current carried by Ca2+ on membrane potential. The values of fCa for the WT rod in darkness (open black symbol, fCa = 0.072) and the Kv2.1−/− rod (open red symbol, fCa = 0.29) are derived from the homeostasis relation (Eq. 5), given the respective curves in D and E. A “saturating Boltzmann” function (smooth black trace) was fitted through the data points to provide a continuous function fCa(Vm), needed for analysis of dynamic changes in Ca2+ fluxes during phototransduction as the outer segment membrane potential varies. CNGC, CNG channels.
Figure 9.
Figure 9.
Light suppression of the undershoot of Kv2.1−/− rod photoresponses reveals it to arise from CNG channel current. (A) Paired-flash paradigm: the response of the rod to a single saturating flash (black trace); response of the same rod to a pair of identical flashes (red trace), with the second delivered during the undershoot of the response to the first flash. The ordinate scale is normalized by the saturating amplitude of the photocurrent response to the first flash. (B) Bar chart summarizing results from 10 experiments. The red filled region gives the magnitudes of saturating photocurrents to the first and second flashes in the paired-flash experiment; the gray-filled region stacked on the first flash plots the magnitude of the undershoot. All magnitudes are scaled by the amplitude of the response to the first flash, as in A. The magnitude of the photocurrent response to the second flash is indistinguishable from the sum of the magnitudes of the initial photocurrent and its undershoot.
Figure 10.
Figure 10.
Key features of the photocurrent responses of Kv2.1−/− rods can be explained with an extension of phototransduction theory to include the voltage dependence of CNG channels and the NCKX, and the voltage-dependent and voltage-activated conductances of the inner segment. Related to Fig. 1. (A) Response family of a WT rod: with the exception of that to the most intense, the traces were restricted to subsaturating responses and saturated responses that exhibit recovery translation invariance (Nikonov et al., 1998). The measured flash strengths were 4.6, 8.7, 18, 108, 427, 1,422, 2,774, 5,263, 10,570, and 73,000 photons μm−2. The filled symbols are plotted on the traces at the times (Tsat) when the dark currents had recovered 20% from saturation. (B) Predictions of the two-compartment model; filled symbols identify times 20% recovery from saturation, as in A. (C) Comparison of the times in saturation (Tsat) extracted from the empirical traces (msd.) and the predicted traces (pred.). The symbols τD, Obs and τD, pre give the values of the dominant time constants estimated by least-squares fitting of straight lines of Tsat versus the natural log of the flash strength for the observed and predicted traces, respectively (Nikonov et al., 1998). In the theoretical model, the lifetime τE of the Gtα-PDE (G*-E*) complex was assumed equal to τD, Obs (210 ms), and the lifetime of photoactivated rhodopsin (R*) was set to 45 ms (Eq. S9). Theory predicts the points to follow a line of unit slope (unbroken line). (D and E) Response family of a Kv2.1–/– rod and model predictions (the same rods whose response to the most intense flash were predicted and plotted in Fig. 7 on a much faster time scale); the circular symbols plot the times of 20% recovery from saturation (Tsat), as in A and B. The measured flash strengths were 108, 224, 427, 747, 1,423, 2,774, 5,263, and 73,000 photons μm −2. In the model calculations the lifetime τE of the Gtα-PDE (G*-E*) complex was assumed equal to τD, Obs (110 ms), while R* was assumed to deactivate with a time constant of 30 ms for subsaturating flashes, segueing to 70 ms for saturating flashes (Eq. S11). Most other parameters were set to the same value for WT and Kv2.1–/– rods (Table S2). (F) Comparison of the dominant time constants extracted from analysis of the empirically measured and theoretically predicted traces (the predicted responses to the most intense flashes in A and C are provided in Fig. 7; predicting the time course of the recoveries to this intensity flash, estimated to produce more than 75 R* per disc face, is beyond the scope of the model).
Figure 11.
Figure 11.
Kv2.1−/− rods undergo slow degeneration. (A) Paraffin-embedded ultrathin sections of heterozygous and Kv2.1−/− retinas of 6-mo-old mice stained for hematoxylin and eosin. Sections have been aligned at the ELM, showing that the OS, IS, and ONL layers are smaller in the Kv2.1−/− mouse. Scale bar, 10 µm. (B) OCT B-scans of central retina of Kv2.1−/− mice at 6 wk and 24 wk of age. There is a notable decrease in the OS, IS, and ONL layer thickness over time in Kv2.1−/− mice. Scale bar, 100 µm. (C) Quantification of the OS, IS, ONL, and IPL layers in the same mice from 6 wk to 6 mo of age (mean ± SEM, n = 4 per genotype). The OS layer is shorter in Kv2.1−/− mice at all ages, and there is a progressive decline in IS and ONL thickness over time. (D) TEM sections showing individual rod photoreceptors in WT and Kv2.1−/− mice. Mitochondria in the Kv2.1−/− rod inner segments are more abundant and look distorted as compared with WT. Dark adaptation before euthanasia did not change this effect. Scale bar, 1 µm. IPL, inner plexiform layer; OPL, outer plexiform layer; GCL, ganglion cell fiber layer; TEM, transmission EM.

Similar articles

Cited by

References

    1. Aleman, T.S., LaVail M.M., Montemayor R., Ying G., Maguire M.M., Laties A.M., Jacobson S.G., and Cideciyan A.V.. 2001. Augmented rod bipolar cell function in partial receptor loss: an ERG study in P23H rhodopsin transgenic and aging normal rats. Vision Res. 41:2779–2797. 10.1016/S0042-6989(01)00157-2 - DOI - PubMed
    1. Alexander, K.R., and Fishman G.A.. 1984. Supernormal scotopic ERG in cone dystrophy. Br. J. Ophthalmol. 68:69–78. 10.1136/bjo.68.2.69 - DOI - PMC - PubMed
    1. Ames, J.B., and Ikura M.. 2002. Structure and membrane-targeting mechanism of retinal Ca2+-binding proteins, recoverin and GCAP-2. Adv. Exp. Med. Biol. 514:333–348. 10.1007/978-1-4615-0121-3_20 - DOI - PubMed
    1. Ames, J.B., Dizhoor A.M., Ikura M., Palczewski K., and Stryer L.. 1999. Three-dimensional structure of guanylyl cyclase activating protein-2, a calcium-sensitive modulator of photoreceptor guanylyl cyclases. J. Biol. Chem. 274:19329–19337. 10.1074/jbc.274.27.19329 - DOI - PubMed
    1. Attwell, D., and Wilson M.. 1980. Behaviour of the rod network in the tiger salamander retina mediated by membrane properties of individual rods. J. Physiol. 309:287–315. 10.1113/jphysiol.1980.sp013509 - DOI - PMC - PubMed

Publication types