. 2021 Jan 26;34(4):108683.
doi: 10.1016/j.celrep.2020.108683.

Proton-activated chloride channel PAC regulates endosomal acidification and transferrin receptor-mediated endocytosis

Affiliations

Proton-activated chloride channel PAC regulates endosomal acidification and transferrin receptor-mediated endocytosis

James Osei-Owusu et al. Cell Rep. .

Abstract

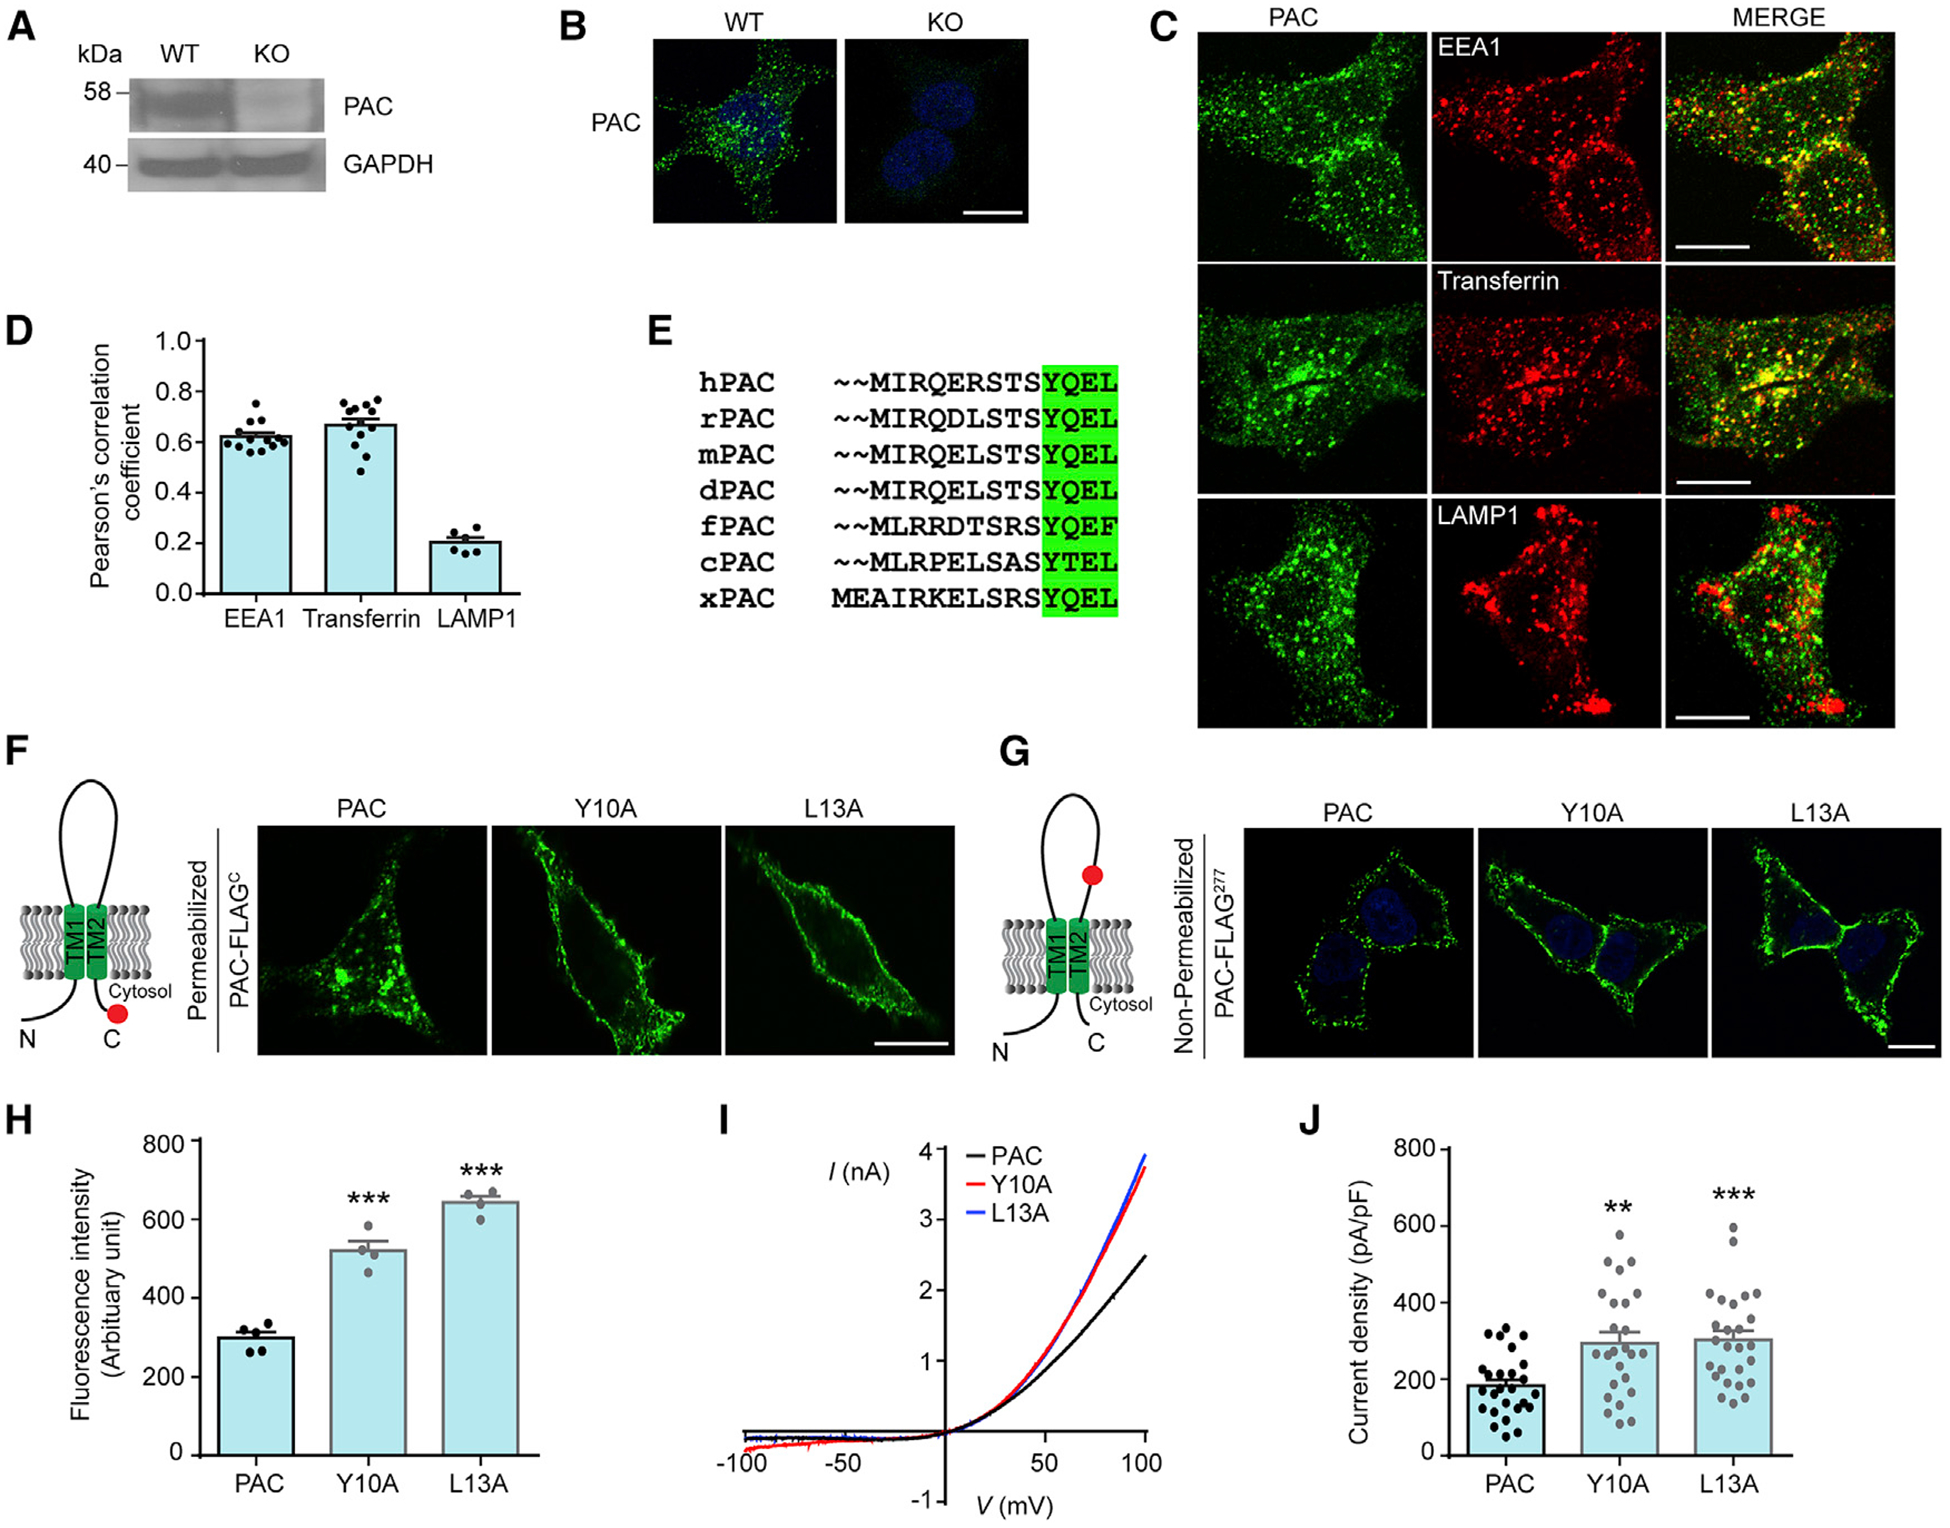
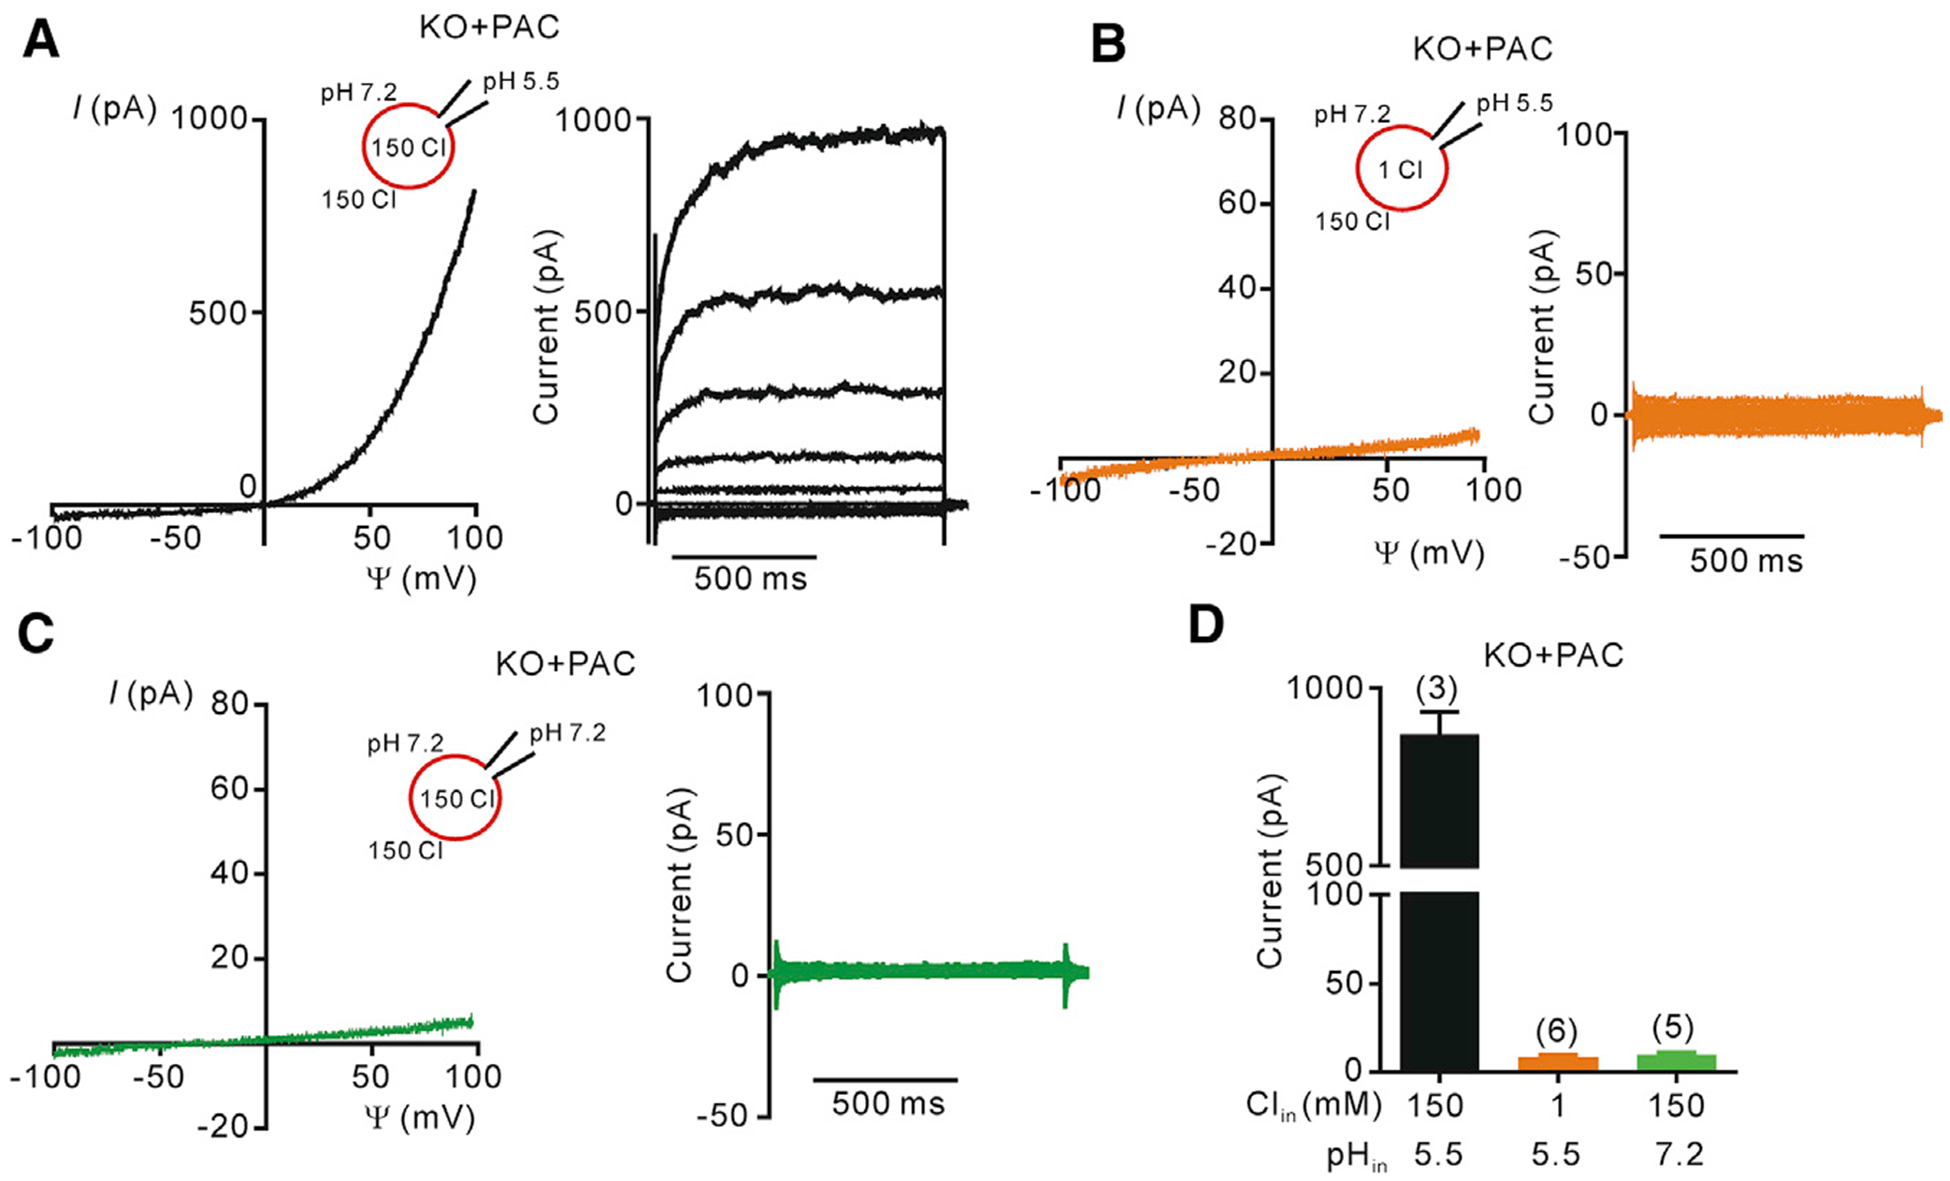
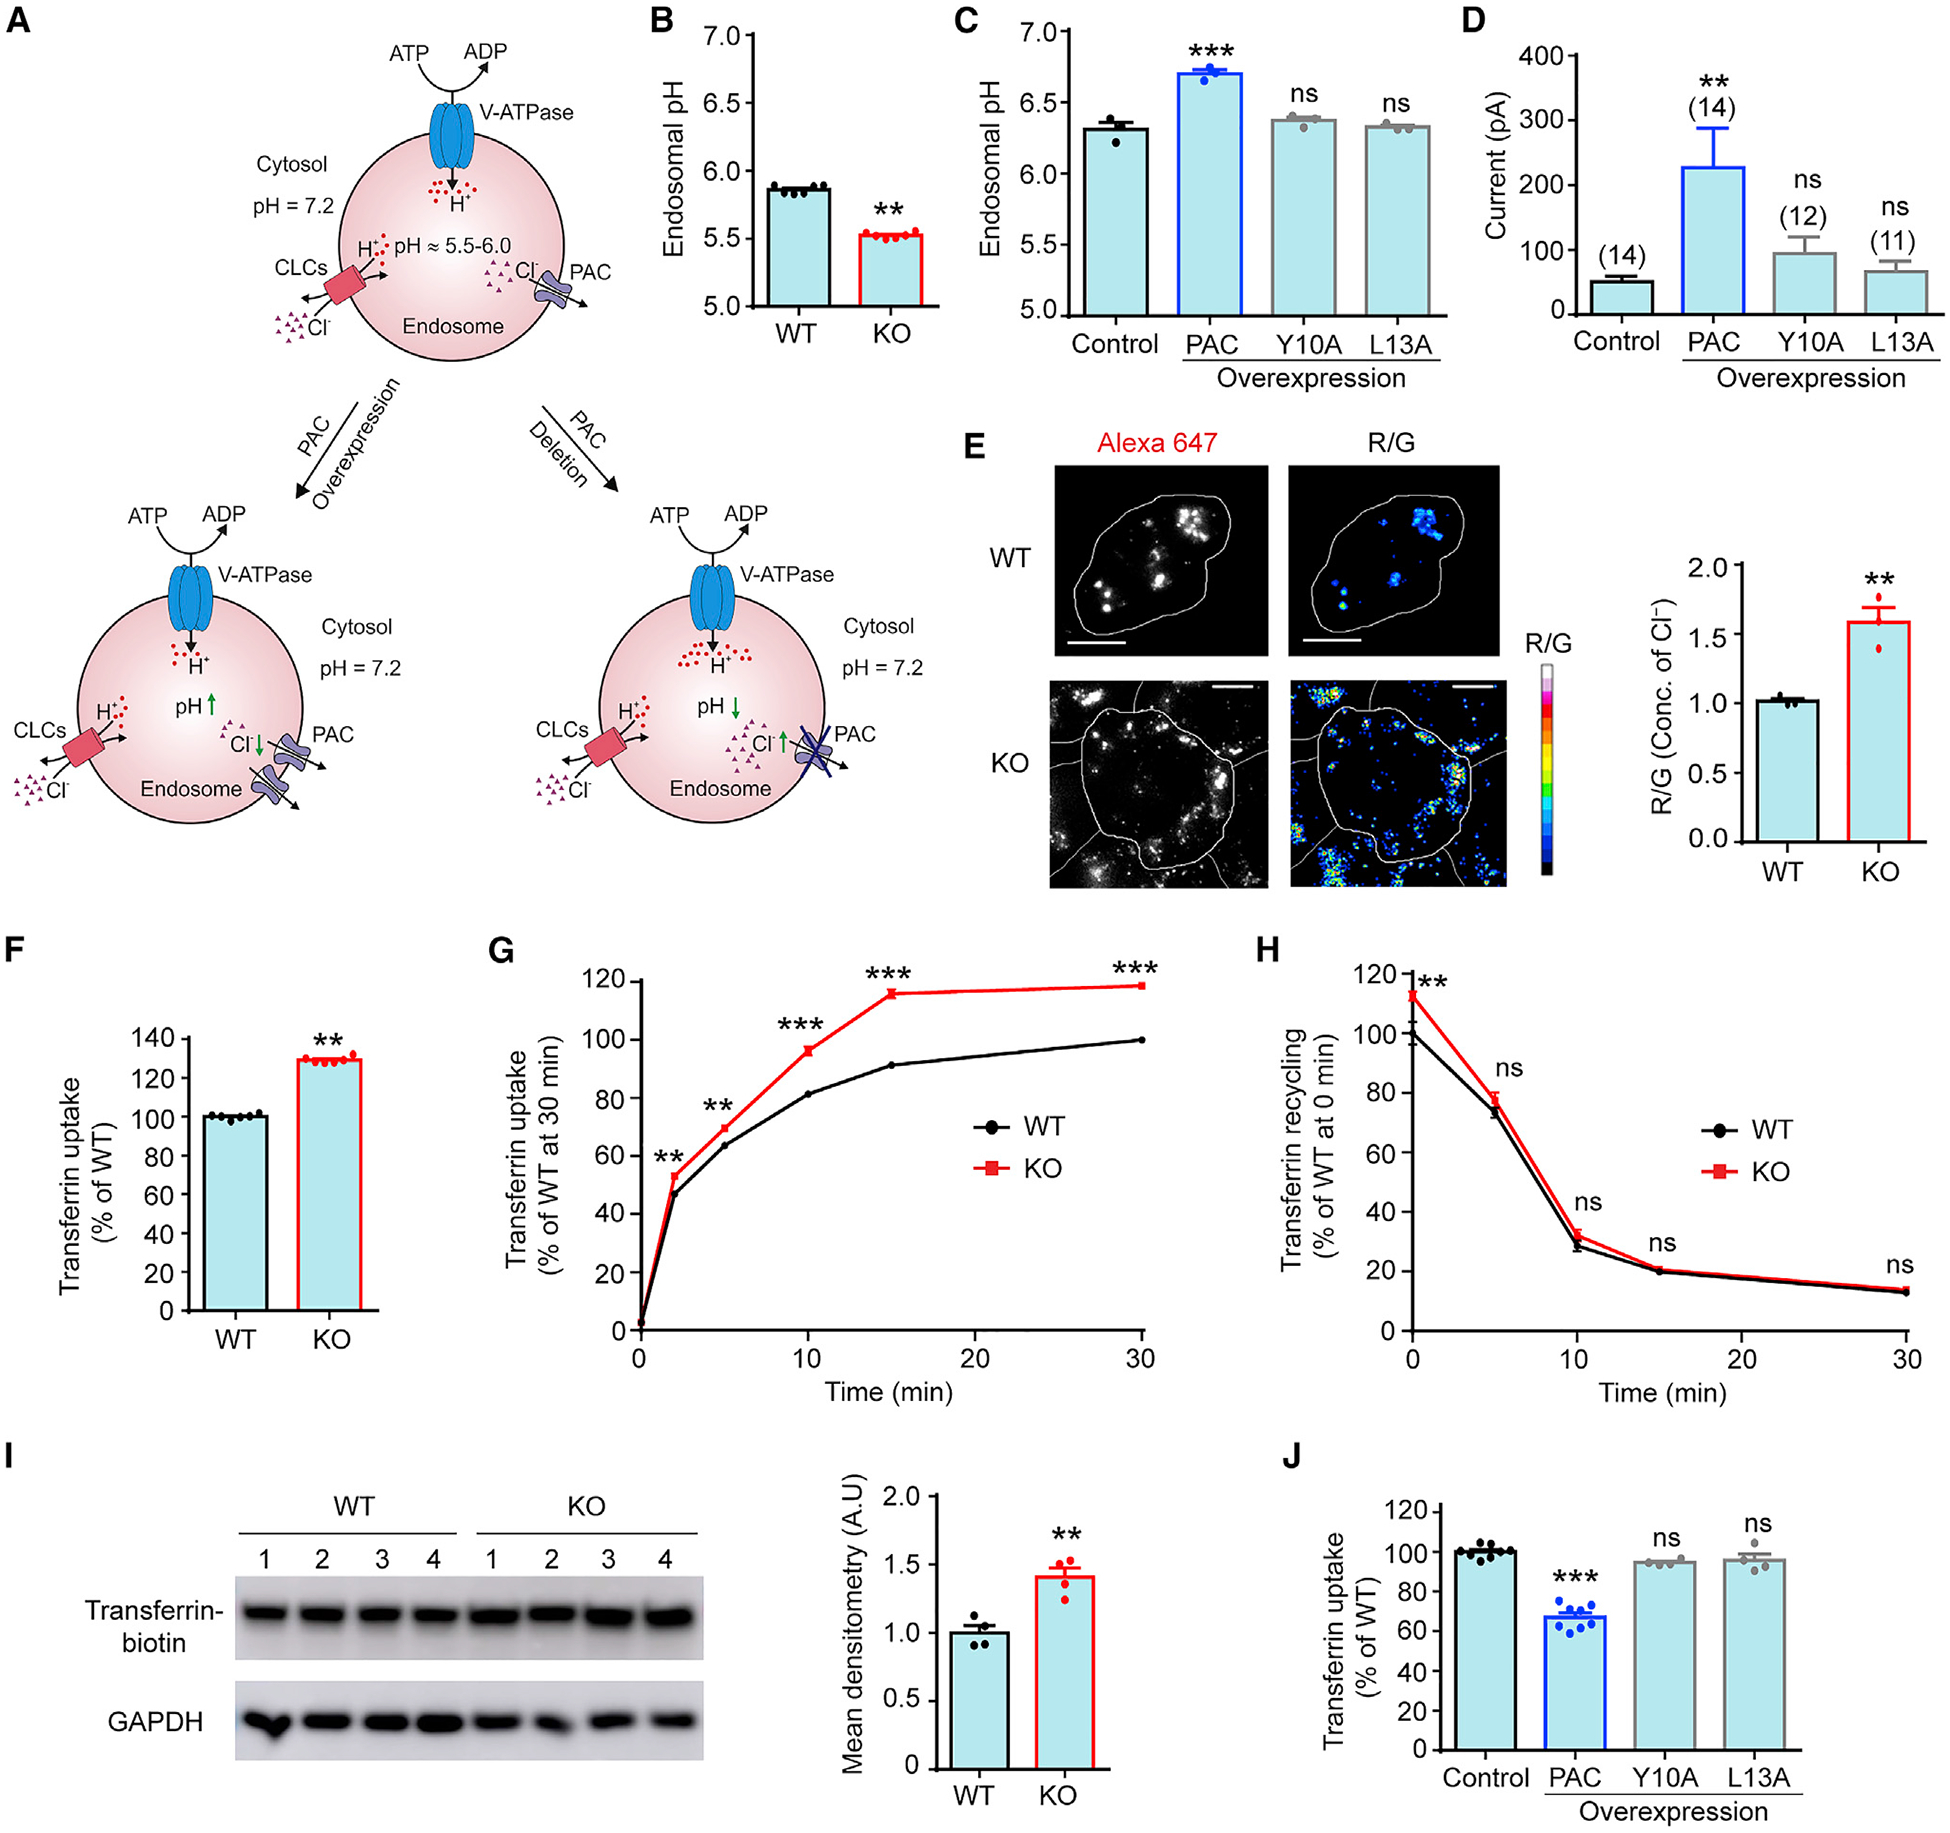
During vesicular acidification, chloride (Cl-), as the counterion, provides the electrical shunt for proton pumping by the vacuolar H+ ATPase. Intracellular CLC transporters mediate Cl- influx to the endolysosomes through their 2Cl-/H+ exchange activity. However, whole-endolysosomal patch-clamp recording also revealed a mysterious conductance releasing Cl- from the lumen. It remains unknown whether CLCs or other Cl- channels are responsible for this activity. Here, we show that the newly identified proton-activated Cl- (PAC) channel traffics from the plasma membrane to endosomes via the classical YxxL motif. PAC deletion abolishes the endosomal Cl- conductance, raises luminal Cl- level, lowers luminal pH, and increases transferrin receptor-mediated endocytosis. PAC overexpression generates a large endosomal Cl- current with properties similar to those of endogenous conductance, hypo-acidifies endosomal pH, and reduces transferrin uptake. We propose that the endosomal Cl- PAC channel functions as a low pH sensor and prevents hyper-acidification by releasing Cl- from the lumen.

Keywords: ASOR; PACC1; PAORAC; TMEM206; hPAC; organellar ion channel.


Conflict of interest statement

Declaration of interests The authors declare no competing interests.

Figures

Figure 1.
Figure 1.. PAC is localized to the early and recycling endosomes via the classic YxxL trafficking motif
(A) Validation of PAC antibody by western blot analysis using WT and PAC KO HEK293T cell lysates. (B) Immunostaining of endogenous PAC (green) and DAPI (blue) in WT and KO HEK293T cells. Scale bar, 10 μm. (C and D) Immunostaining (C) and quantification (D) of PAC with endolysosomal markers showing that PAC colocalizes with EEA1 and transferrin. Scale bars, 10 μm. Error bars in (D) represent mean ± SEM. EEA1, n = 13 cells; transferrin, n = 13 cells; and LAMP1, n = 6 cells. (E) Sequence alignment of PAC from different vertebrate animals showing a conserved YxxL motif in the N terminus. UniProt protein sequences shown here are from human (hPAC), rat (rPAC), mouse (mPAC), dog (dPAC), zebrafish (fPAC), chicken (cPAC), and frog (xPAC). (F) Left: schematic representation of PAC-FLAGC showing FLAG tag (red) at the C terminus. Right: immunostaining of low-tetracycline-induced PAC-FLAGC WT-, Y10A-, and L13A-overexpressing stable cells. The cells were permeabilized to allow intracellular access to FLAG antibody. Scale bar, 10 μm. (G) Left: schematic representation of PAC-FLAG277 showing FLAG tag (red) at position 277 of the extracellular domain. Right: immunostaining of low-tetracycline-induced PAC-FLAG277 WT-, Y10A-, and L13A-overexpressing stable cells. The cells were not permeabilized to allow only plasma membrane staining of PAC-FLAG277. Scale bar, 10 μm. (H) Fluorescence intensity of (G) measured by flow cytometry analysis of ~10,000 cells per each biological replicate n (mean ± SEM; n = 4–5). ***p < 0.0001, one-way analysis of variance (ANOVA) with Bonferroni post hoc test. (I) pH 5.0-induced PAC currents monitored by voltage-ramp protocol in HEK293 stable cells expressing PAC-FLAGC WT, Y10A, and L13A. (J) Current density of (I) at +100 mV (mean ± SEM; n = 25–26 cells). **p < 0.01; ***p < 0.001, one-way ANOVA with Bonferroni post hoc test. See also Figure S1.
Figure 2.
Figure 2.. PAC is required for an acid-sensitive Cl conductance in endosomes
(A) Diagrams illustrating the technique and nomenclature used in whole-endosome recording. Top: endosomes are enlarged by transiently transfecting HEK293T cells with mCherry-tagged Rab5-Q79L, which is colocalized with endogenous PAC. Scale bar, 5 μm. Bottom: enlarged endosomes are individually released from Rab5-Q79L-transfected cells ruptured by a glass pipette and are subject to whole-endosome recording (Chen et al., 2017). Δψ is the electrical potential across the endosomal membrane, with lumen used as the reference (Bertl et al., 1992; Cang et al., 2015). Outward currents are plotted as positive values, representing the movement of negative charges (Cl) out of the endosomal lumen into the topological space equivalent to cytosol (bath). (B–D) Acid-sensitive currents monitored by voltage-ramp (left) and voltage-step (right) protocols in WT endosomes: (B) (pH 5.5) 150 mM luminal and cytosolic Cl; (C) (pH 5.5) 1 mM luminal and 150 mM cytosolic Cl; and (D) (pH 7.2) 150 mM luminal and cytosolic Cl. (E) Acid-sensitive currents monitored by voltage-ramp (left) and voltage-step (right) protocols in PAC KO endosomes (pH 5.5; 150 mM luminal and cytosolic Cl). (F) Current amplitudes of (B)–(E) at +100 mV. Error bars represent mean ± SEM.
Figure 3.
Figure 3.. PAC recapitulates the properties of the endogenous endosomal Cl channel
(A–C) PAC-mediated acid-sensitive currents monitored by voltage-ramp (left) and voltage-step (right) protocols in PAC KO endosomes: (A) (pH 5.5) 150 mM luminal and cytosolic Cl; (B) (pH 5.5) 1 mM luminal and 150 mM cytosolic Cl; and (C) (pH 7.2) 150 mM luminal and cytosolic Cl. (D) Current amplitudes of (A)–(C) at +100 mV. Error bars represent mean ± SEM.
Figure 4.
Figure 4.. PAC regulates endosomal pH, Cl concentration, and transferrin-receptor-mediated endocytosis
(A) A simple model focusing on Cl in endosomal pH regulation: PAC functions as a pH sensor in endosomes and prevents hyper-acidification by releasing Cl from the lumen. Loss and gain of PAC function result in high and low Cl, hyper- and hypo-acidification, respectively. (B) Ratiometric measurement of endosomal pH in WT and PAC KO HEK293T cells. Flow cytometry analysis of ~10,000 cells for each biological replicate n (mean ± SEM; n = 6). **p < 0.01, two-tailed Student’s t test. (C) Ratiometric measurement of endosomal pH in low-tetracycline-induced PAC WT-, Y10A-, and L13A-overexpressing stable cells. The parental T-REx HEK293 cell line was used as control. Flow cytometry analysis of ~10,000 cells for each biological replicate n (mean ± SEM; n = 3). ***p < 0.0001, one-way analysis of variance (ANOVA) with Bonferroni post hoc test. ns, not significant. (D) Current amplitudes of PAC-mediated endosomal Cl currents at +100 mV for stable cells in (C). Luminal pH 5.5, 150 mM luminal and cytosolic Cl. Error bars represent mean ± SEM. **p < 0.01, one-way ANOVA with Bonferroni post hoc test. ns, not significant. (E) Representative Cl maps and relative Cl concentration of recycling endosomes in the transferrin pathway labeled with ClensorTf in WT and KO HEK293T cells. Pseudocolored R/G images represent the intensity of the reference dye Alexa Fluor 647 (R) divided by the intensity of the Cl-sensitive dye BAC (G). Scale bars, 10 μm. Analysis of ~150 endosomes from 15 cells for each biological replicate n. Error bars represent mean ± SEM; n = 3. **p < 0.01, two-tailed Student’s t test. (F) Normalized transferrin uptake at 30 min in WT (as 100%) and PAC KO HEK293T cells. Flow cytometry analysis of ~10,000 cells for each biological replicate n (mean ± SEM; n = 6). **p < 0.01, two-tailed Student’s t test. (G) Normalized transferrin uptake kinetics of WT and KO HEK293T cells. Flow cytometry analysis of ~10,000 cells for each biological replicate n (mean ± SEM; n/time point = 3). **p < 0.01; ***p < 0.0001, two-way ANOVA with Bonferroni post hoc test. ns, not significant. Unapparent error bars are smaller than symbols in (G) and (H). (H) Normalized transferrin recycling kinetics of WT and KO HEK293T cells. Flow cytometry analysis of ~10,000 cells for each biological replicate n (mean ± SEM; n/time point = 3). **p < 0.01, two-way ANOVA with Bonferroni post hoc test. ns, not significant. (I) Cell-surface biotinylation (left) and densitometry analysis (right) of total accessible transferrin receptor on the cell surface of WT and PAC KO HEK293T cells. GAPDH is the loading control. Error bars represent mean ± SEM; n = 4 cell lysates. **p < 0.01, two-tailed Student’s t test. (J) Normalized transferrin uptake at 30 min in low-tetracycline-induced PAC WT-, Y10A-, and L13A-overexpressing stable cells. Control (as 100%) is the parental T-REx HEK293 cell line. Flow cytometry analysis of ~10,000 cells for each biological replicate n (mean ± SEM; n = 4–8) ***p < 0.0001, one-way ANOVA with Bonferroni post hoc test. ns, not significant. See also Figure S2.

Similar articles

Cited by

References

    1. Bertl A, Blumwald E, Coronado R, Eisenberg R, Findlay G, Gradmann D, Hille B, Köhler K, Kolb HA, MacRobbie E, et al. (1992). Electrical measurements on endomembranes. Science 258, 873–874. - PubMed
    1. Cang C, Bekele B, and Ren D (2014). The voltage-gated sodium channel TPC1 confers endolysosomal excitability. Nat. Chem. Biol 10, 463–469. - PubMed
    1. Cang C, Aranda K, Seo YJ, Gasnier B, and Ren D (2015). TMEM175 Is an Organelle K(+) Channel Regulating Lysosomal Function. Cell 162, 1101–1112. - PubMed
    1. Capurro V, Gianotti A, Caci E, Ravazzolo R, Galietta LJ, and Zegarra-Moran O (2015). Functional analysis of acid-activated Cl− channels: properties and mechanisms of regulation. Biochim. Biophys. Acta 1848 (1 Pt A), 105–114. - PubMed
    1. Chakraborty K, Leung K, and Krishnan Y (2017). High lumenal chloride in the lysosome is critical for lysosome function. eLife 6, e28862. - PMC - PubMed

Publication types

LinkOut - more resources