. 2021 Jan 26;34(4):108678.
doi: 10.1016/j.celrep.2020.108678.

Metabolic compensation activates pro-survival mTORC1 signaling upon 3-phosphoglycerate dehydrogenase inhibition in osteosarcoma

Affiliations

Metabolic compensation activates pro-survival mTORC1 signaling upon 3-phosphoglycerate dehydrogenase inhibition in osteosarcoma

Richa Rathore et al. Cell Rep. .

Abstract

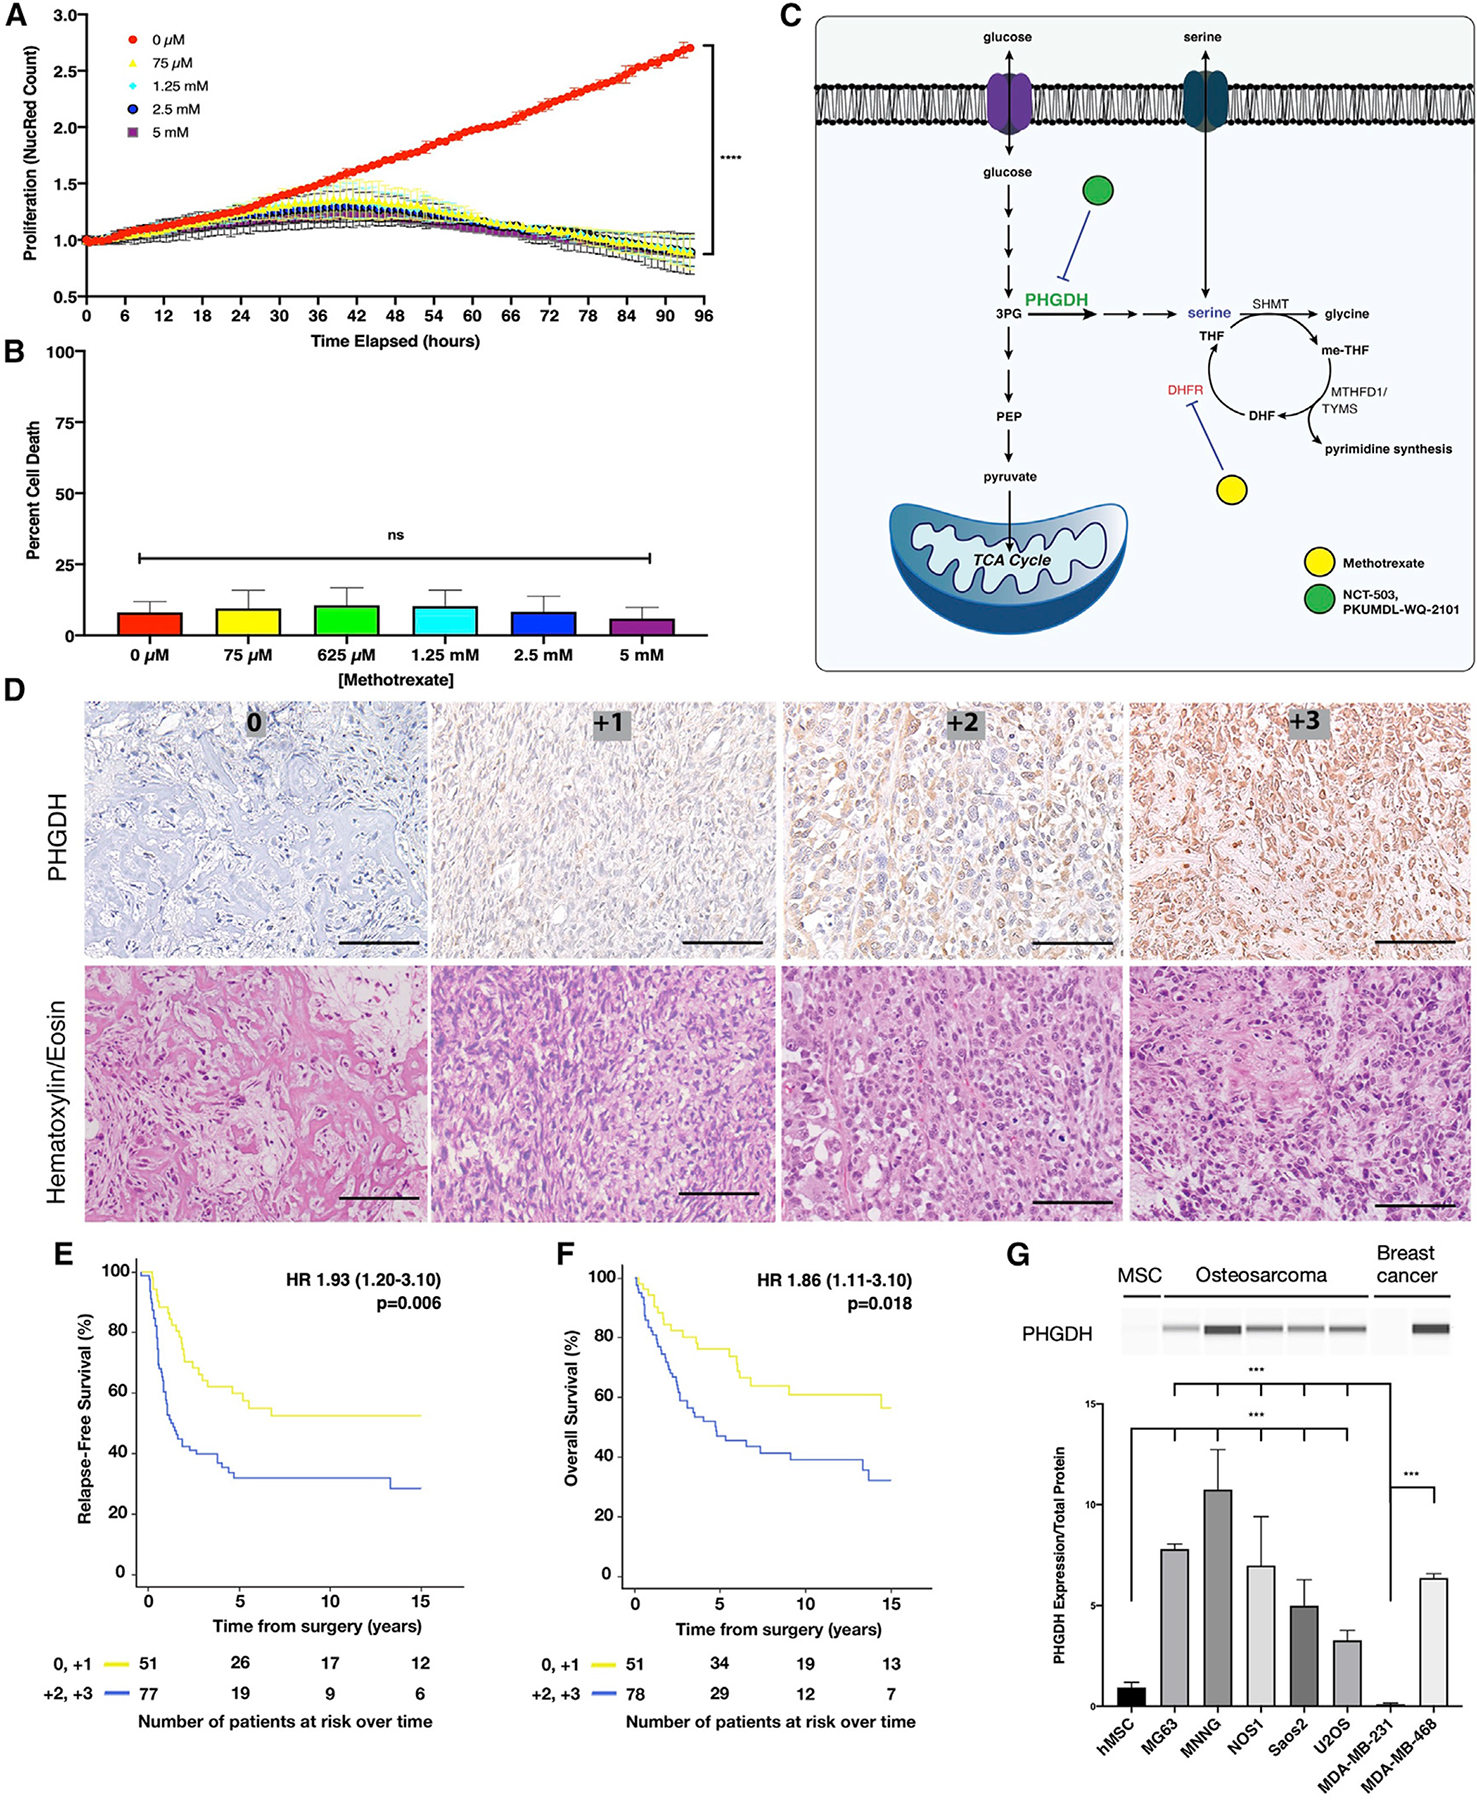
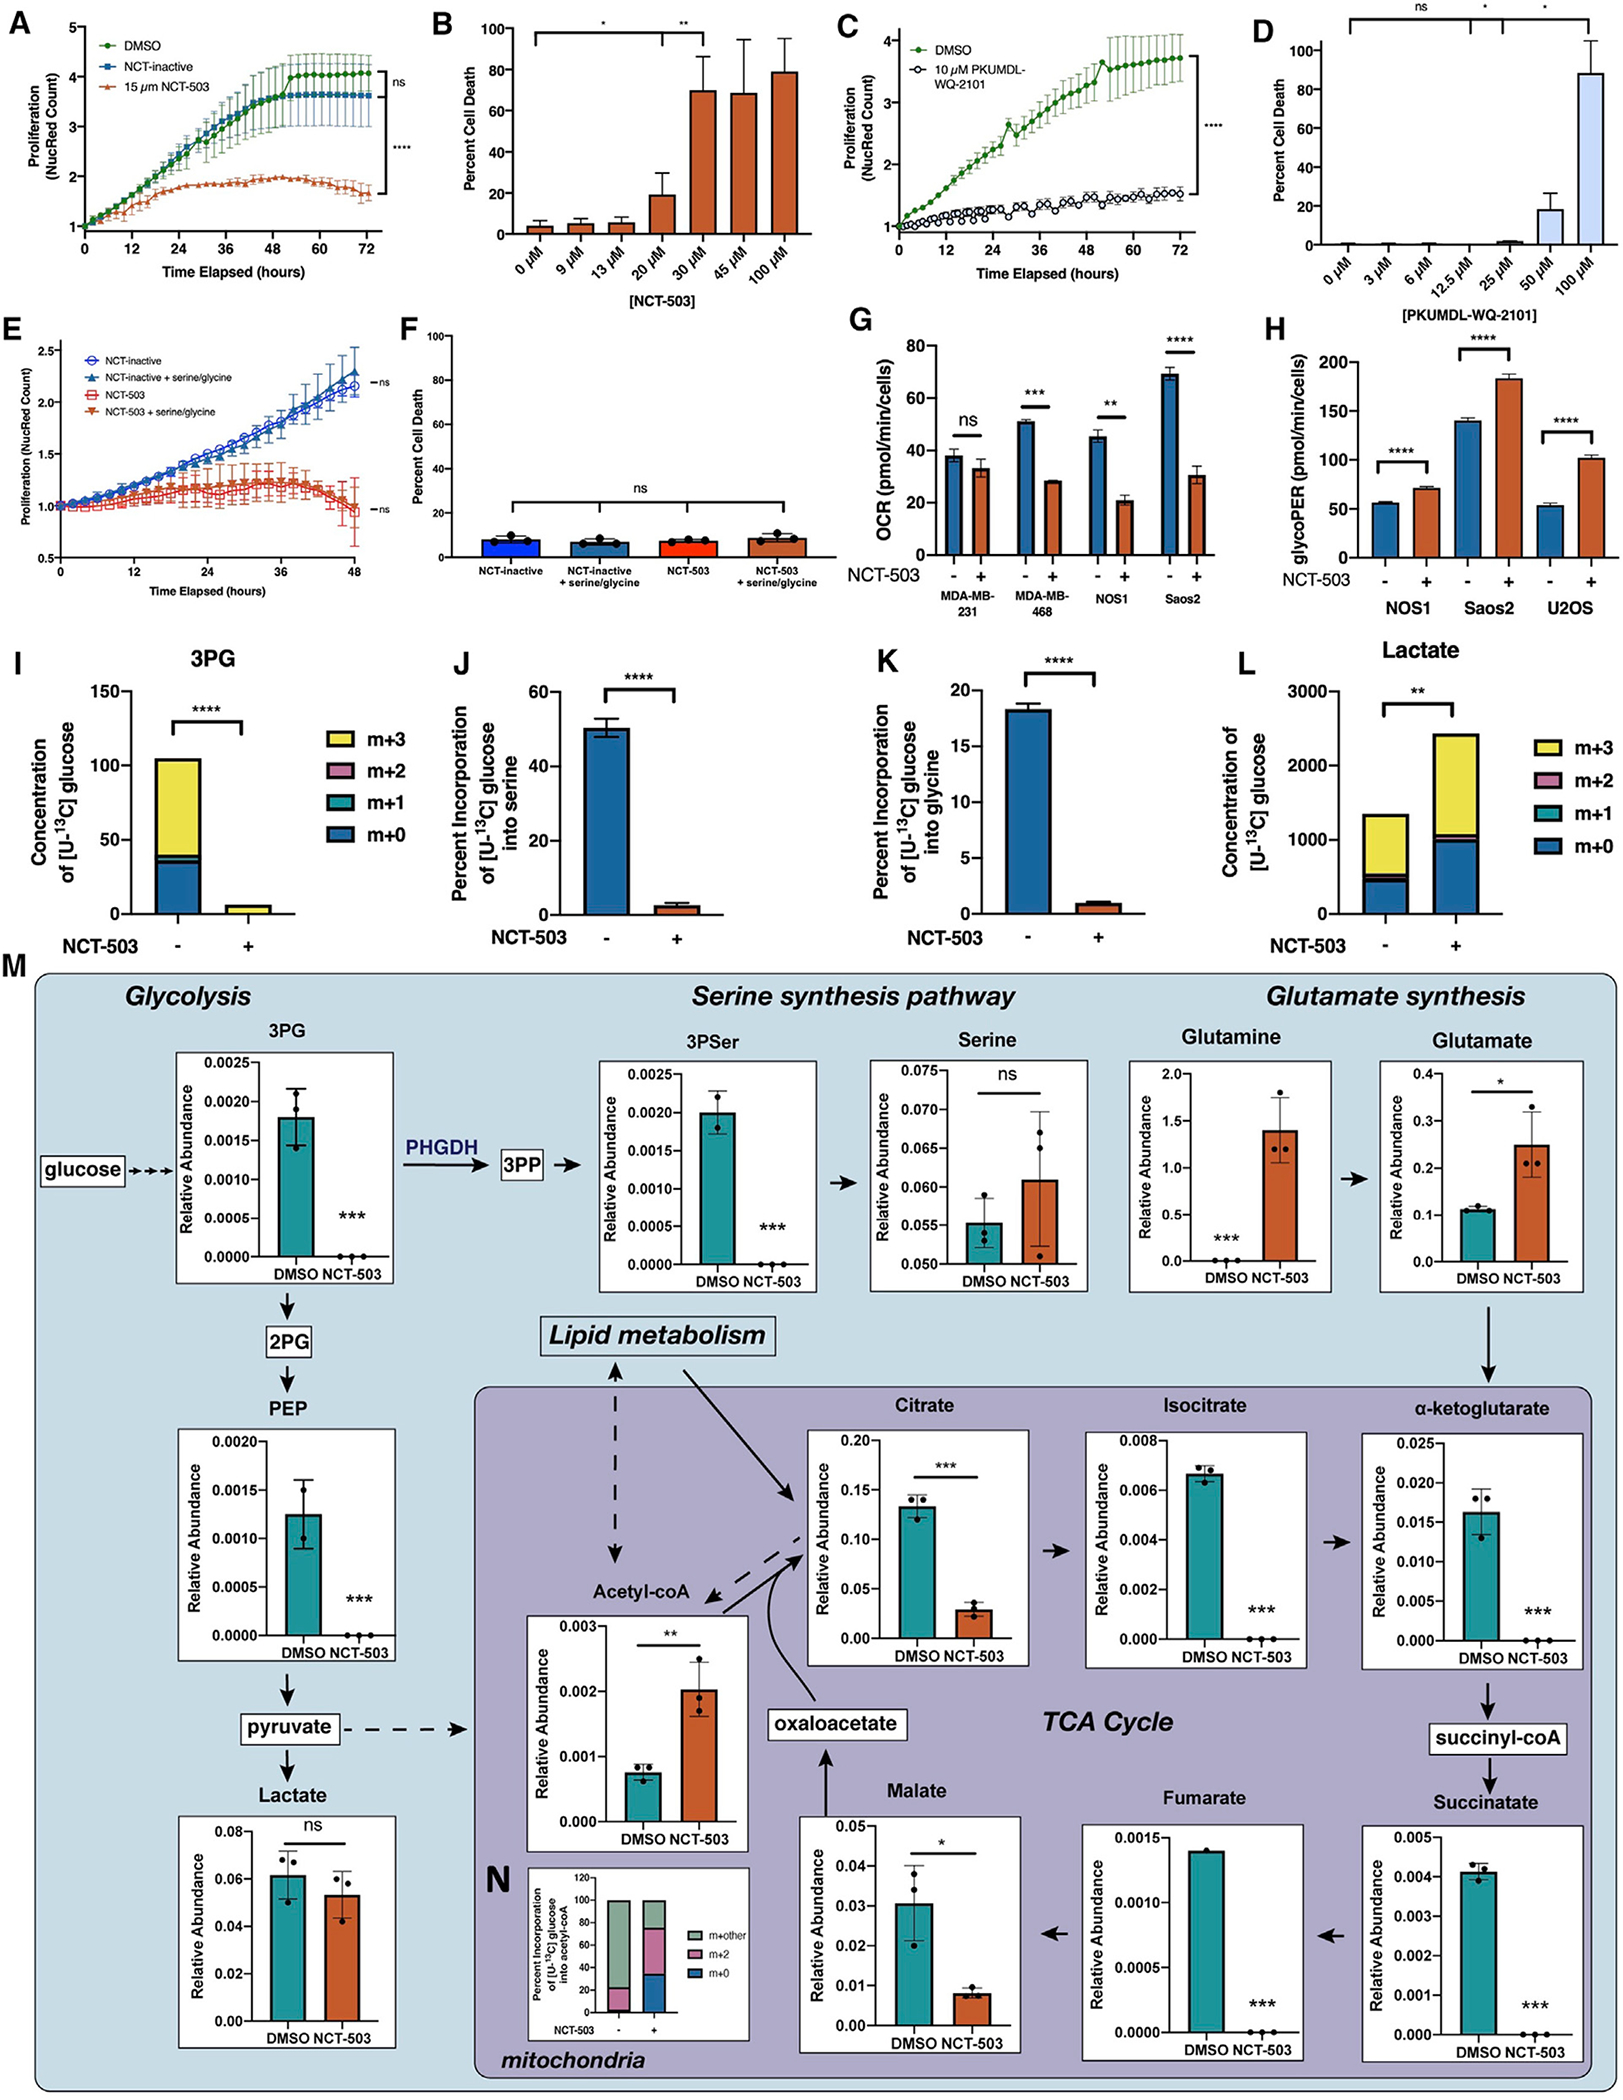
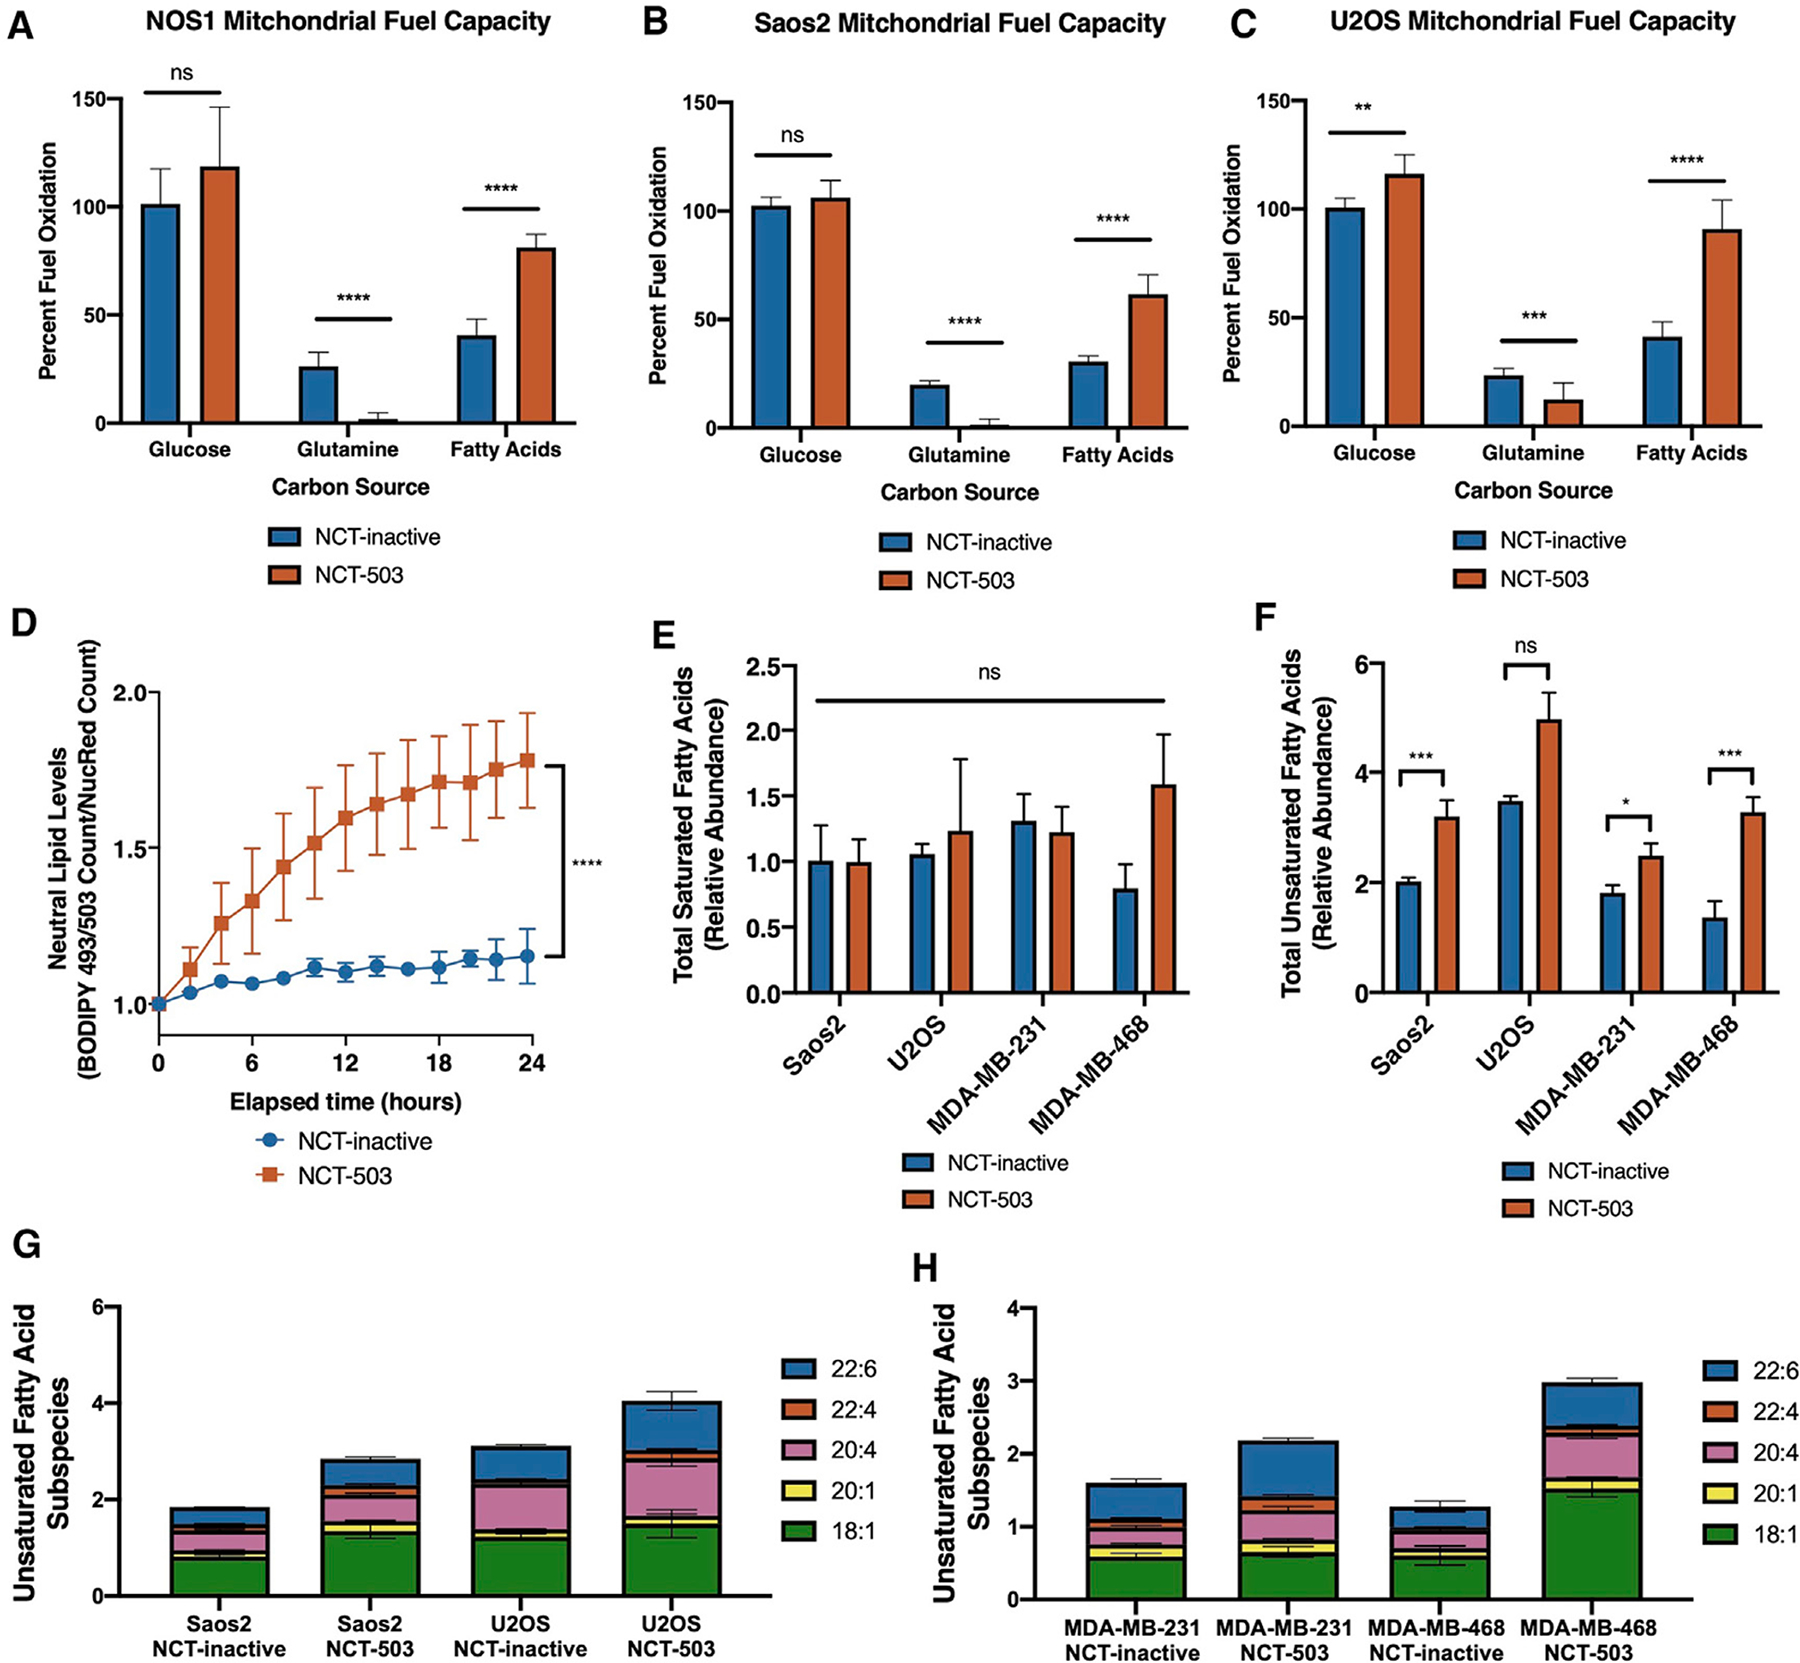
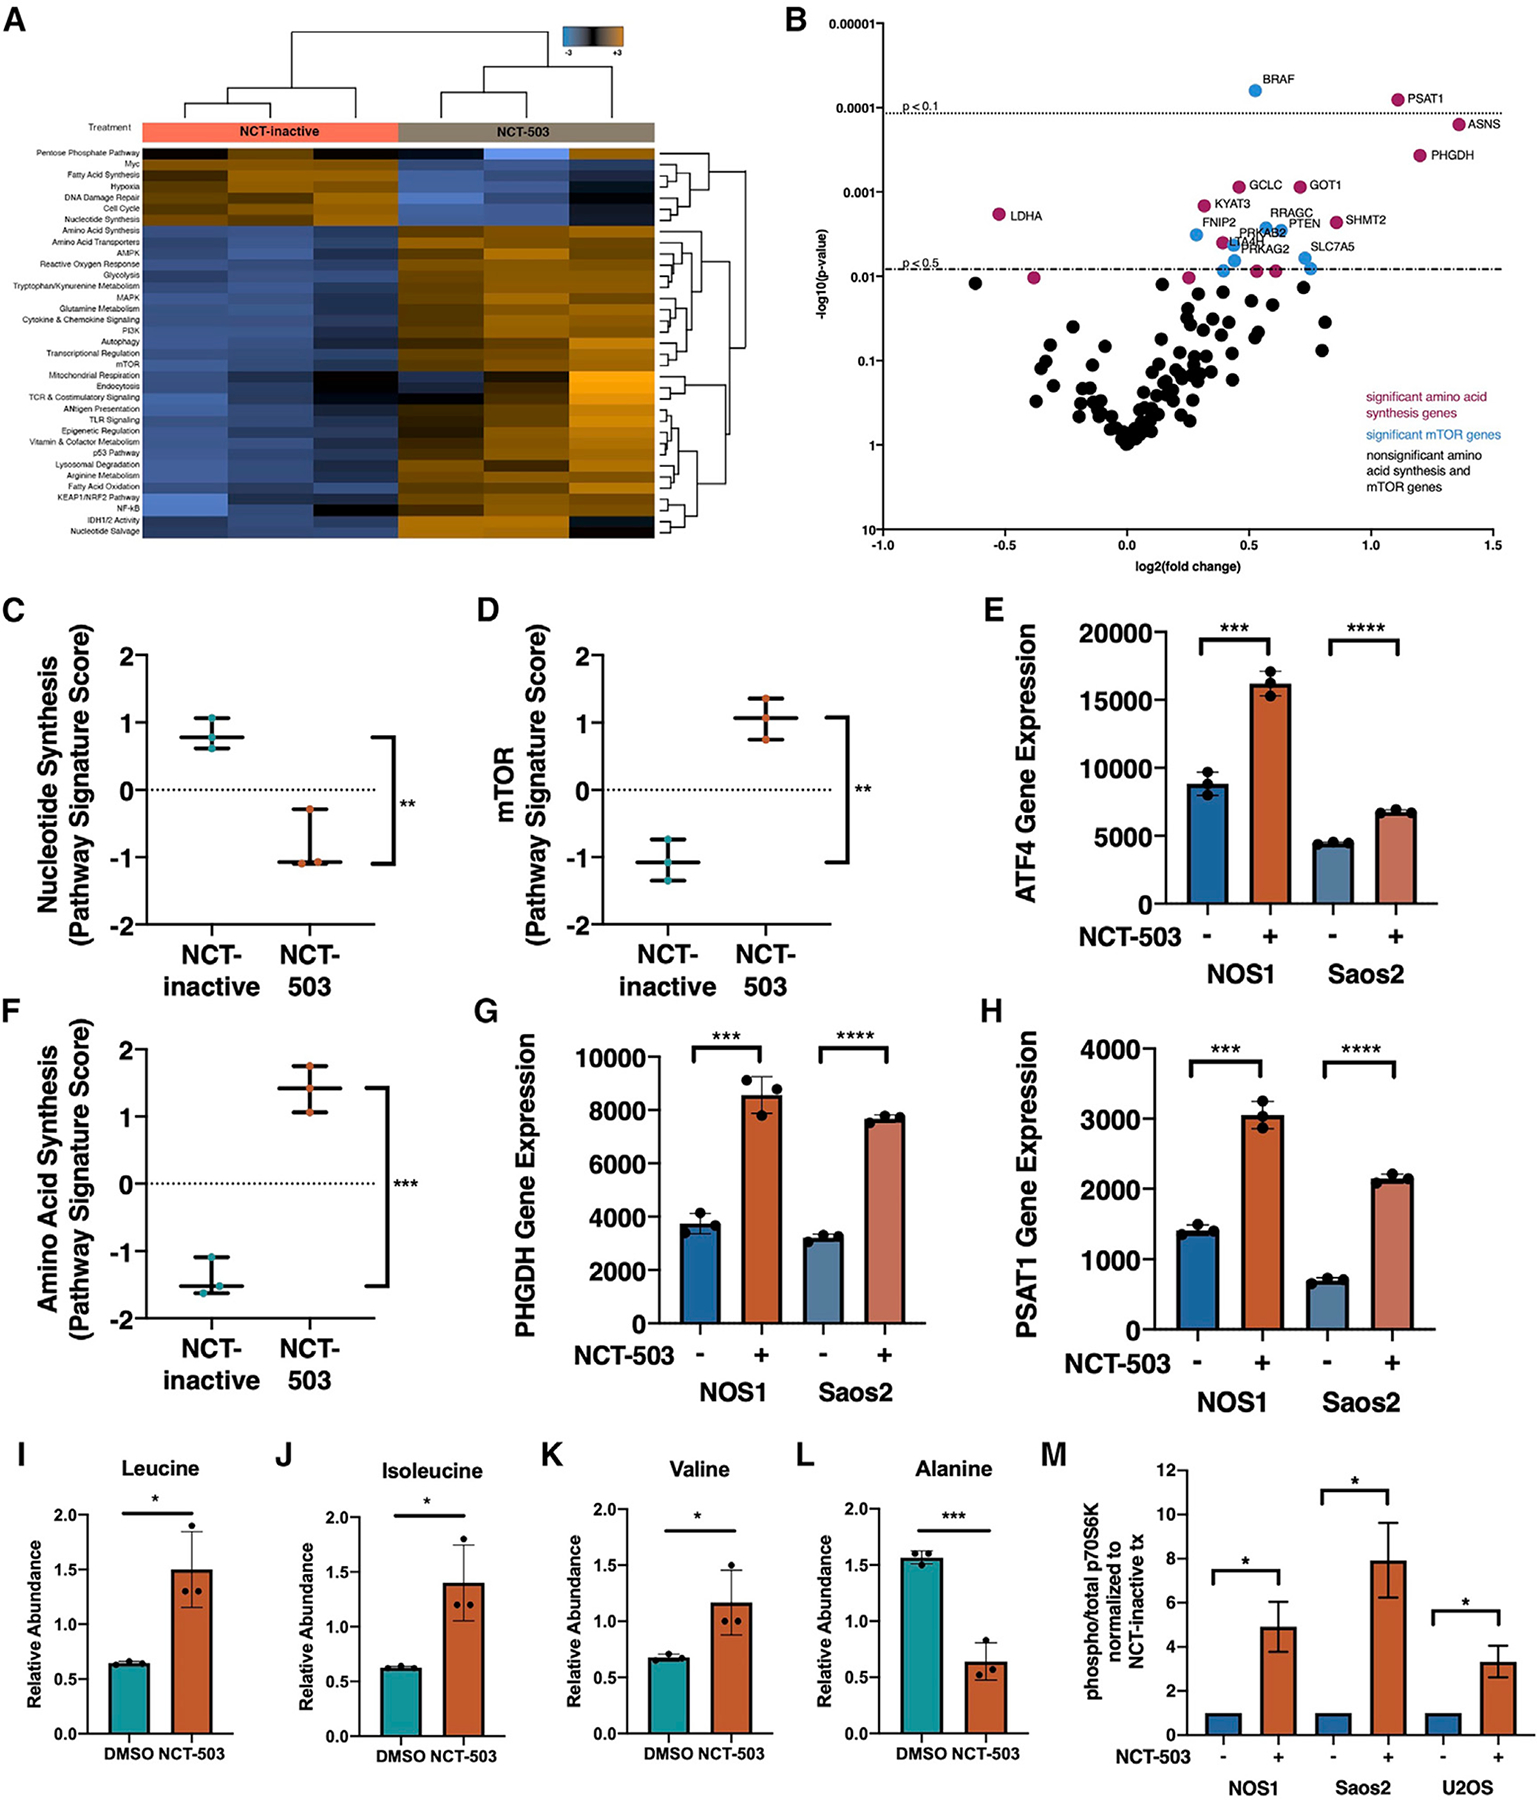
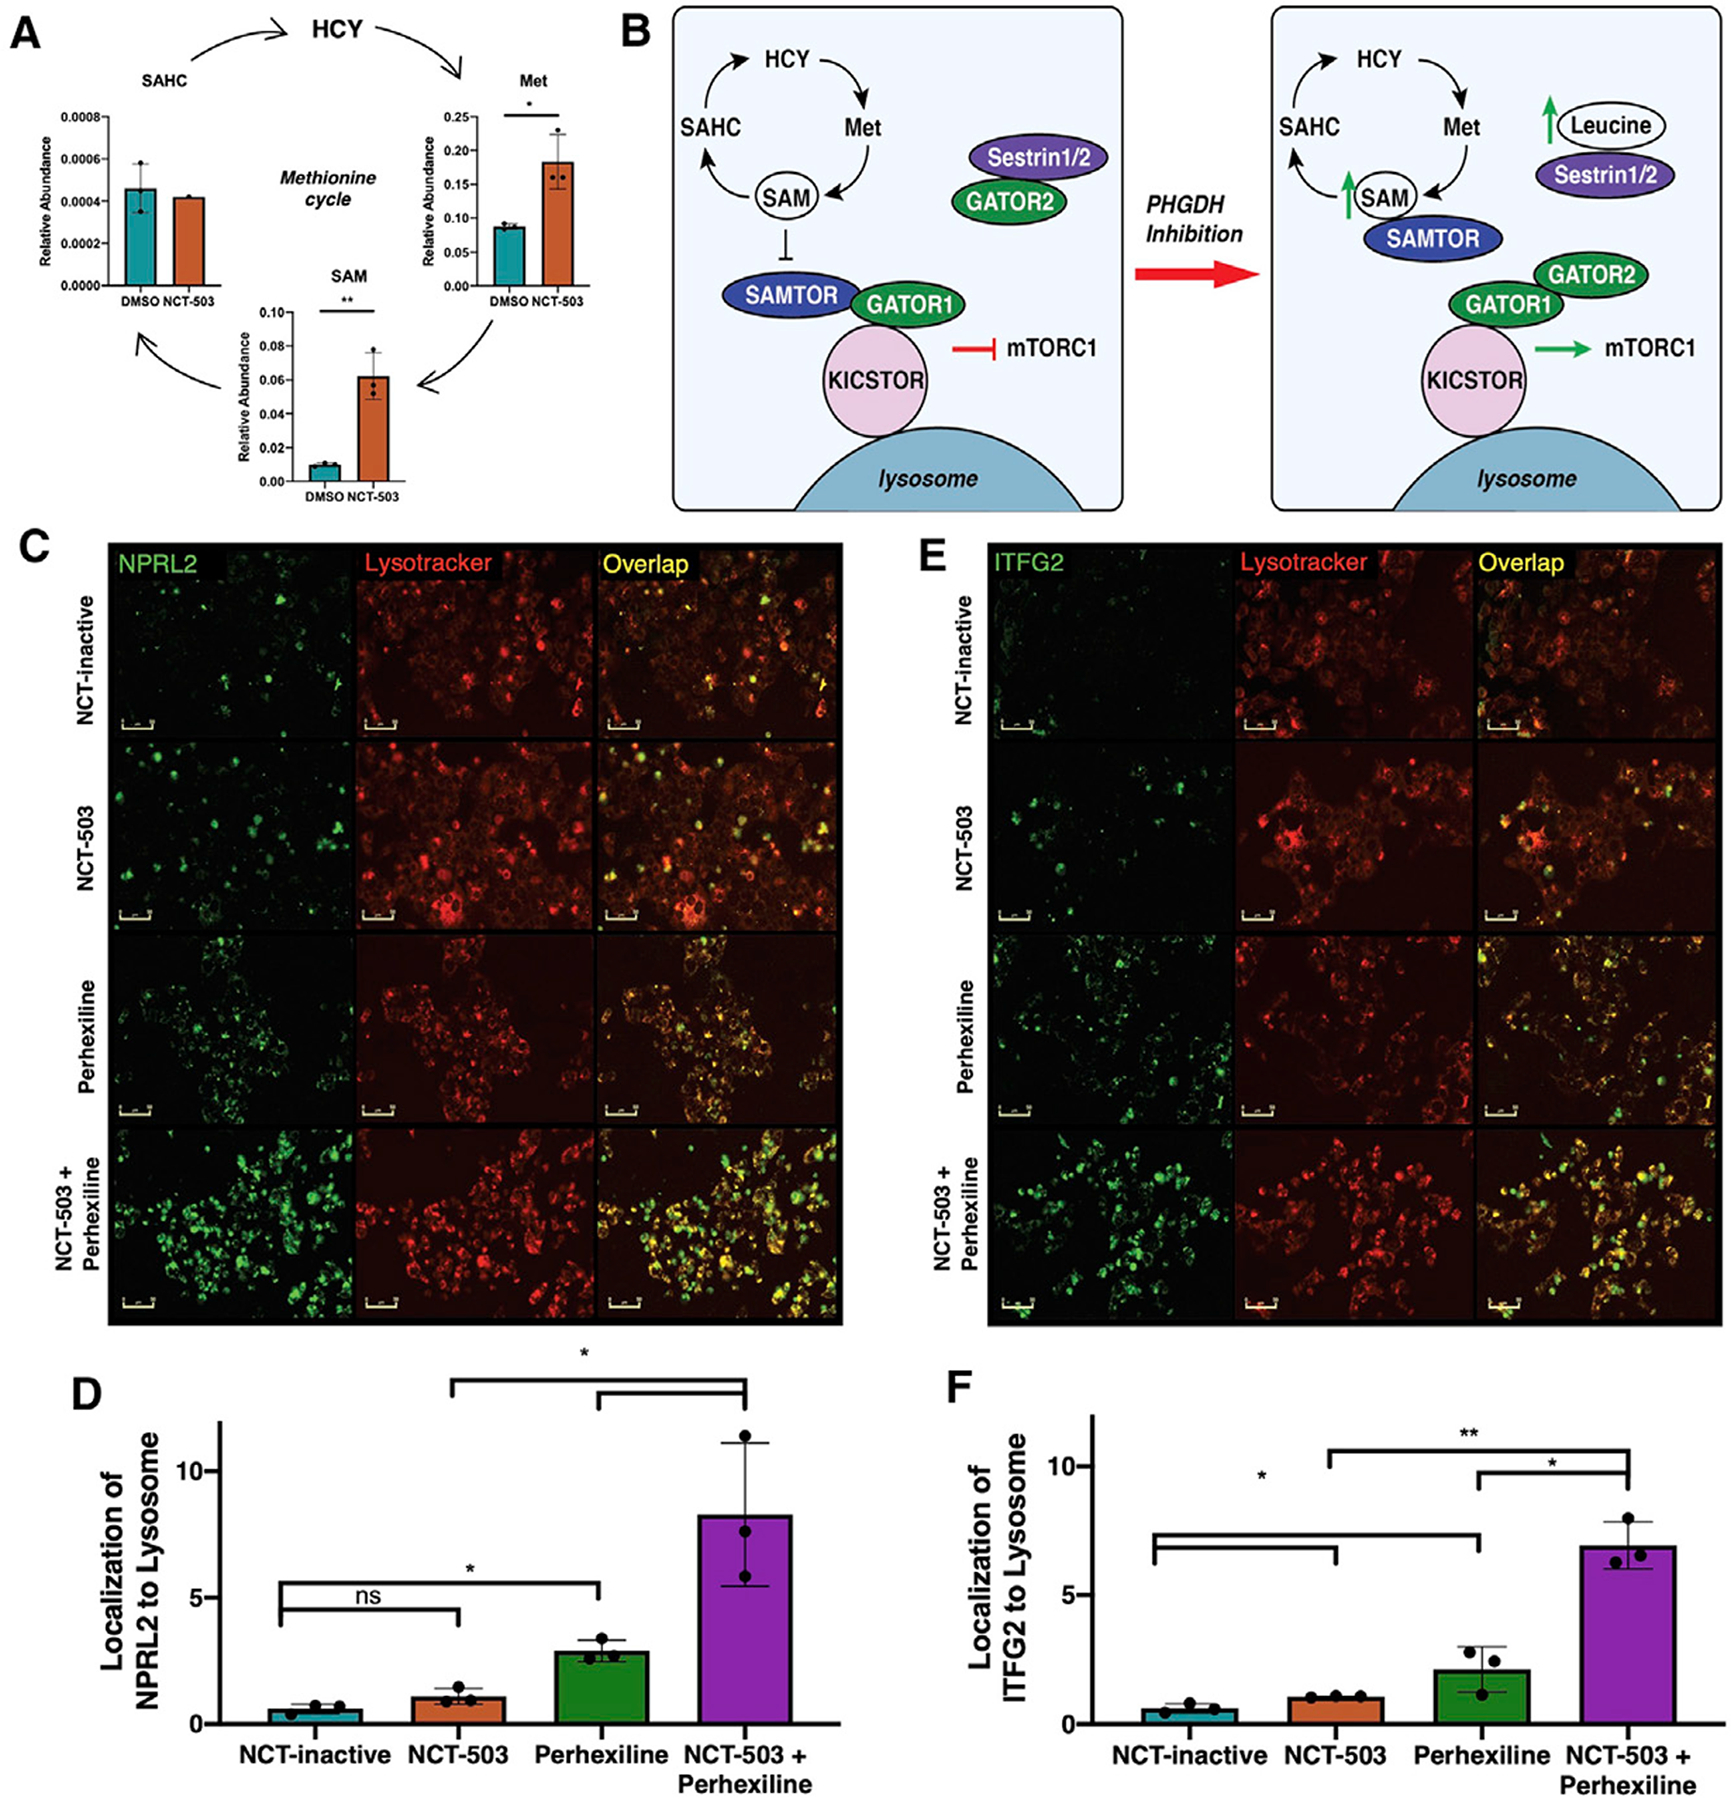
Osteosarcoma is the most common pediatric and adult primary malignant bone cancer. Curative regimens target the folate pathway, downstream of serine metabolism, with high-dose methotrexate. Here, the rate-limiting enzyme in the biosynthesis of serine from glucose, 3-phosphoglycerate dehydrogenase (PHGDH), is examined, and an inverse correlation between PHGDH expression and relapse-free and overall survival in osteosarcoma patients is found. PHGDH inhibition in osteosarcoma cell lines attenuated cellular proliferation without causing cell death, prompting a robust metabolic analysis to characterize pro-survival compensation. Using metabolomic and lipidomic profiling, cellular response to PHGDH inhibition is identified as accumulation of unsaturated lipids, branched chain amino acids, and methionine cycle intermediates, leading to activation of pro-survival mammalian target of rapamycin complex 1 (mTORC1) signaling. Increased mTORC1 activation sensitizes cells to mTORC1 pathway inhibition, resulting in significant, synergistic cell death in vitro and in vivo. Identifying a therapeutic combination for PHGDH-high cancers offers preclinical justification for a dual metabolism-based combination therapy for osteosarcoma.

Keywords: GATOR; PHGDH; SAMTOR; lipid metabolism; mTORC1; methotrexate; one-carbon metabolism; osteosarcoma; perhexiline; serine biosynthesis.


Conflict of interest statement

Declaration of interests B.C.P. declares current employment at Aveda. B.A.V.T. declares grants from Merck; grants and personal fees from Pfizer; grants from TRACON Pharmaceuticals; grants, personal fees, and other remunerations from GlaxoSmithKline; personal fees from Polaris Inc.; personal fees from Lilly; personal fees from Caris Life Sciences; personal fees from Novartis; personal fees from CytRX; personal fees from Plexxikon; personal fees from Epizyme; personal fees from Daiichi Sankyo; personal fees from Adaptimmune; personal fees from Immune Design; personal fees from Bayer; personal fees from Cytokinetics; and personal fees from Deciphera; he has a patent issued for the use of ME1 as a biomarker and ACXT3102. The other authors declare no competing interests.

Figures

Figure 1.
Figure 1.. Osteosarcomas exhibit cytostasis with folate cycle inhibition and demonstrate correlation between upstream PHGDH expression and poor patient prognosis
(A) Nuclear red count in NOS1 cell lines treated with increasing doses of methotrexate for up to 96 h, normalized to starting nuclear red count. (B) Percentage of cell death at 72 h in the NOS1 cell line treated with increasing doses of methotrexate. (C) Schematic of metabolic pathways linking folate metabolism to de novo serine synthesis pathway. (D) Representative immunohistochemistry for PHGDH of a tumor microarray containing 392 tumor samples from 260 osteosarcoma patients, with hematoxylin and eosin cross-staining. Scale bars represent 100 μm. (E) Relapse-free survival for osteosarcoma patients with medium to high levels of PHGDH (blue) compared with none to low levels of PHGDH (yellow). (F) Overall survival for patients with osteosarcoma and medium to high levels of PHGDH (blue) compared with those with none to low levels of PHGDH (yellow). (G) Protein expression of PHGDH in precursor mesenchymal stem cell; osteosarcoma cell lines MG63, MNNG, NOS1, Saos2, and U2OS; and breast cancer cell lines MDA-MB-231 and MDA-MB-468. Cell lysates were analyzed using the Wes automated capillary blotting system, normalized to total protein levels, and a representative band image was used. 3PG, 3-phosphoglycerate; PEP, phosphoenolpyruvate; PHGDH, 3-phosphoglycerate dehydrogenase; SHMT, serine hydroxymethyl transferase; me-THF, methylene tetrahydrofolate; MTHFD1, methylene tetrahydrofolate dehydrogenase; TYMS, thymidylate synthetase; DHF, dihydrofolate; DHFR, dihydrofolate reductase; THF, tetrahydrofolate. Bars represent means of values; error bars represent SEM. All assays were conducted with n = 3 replicates. *p < 0.05, **p < 0.01, ***p < 0.005, ****p < 0.001.
Figure 2.
Figure 2.. PHGDH inhibition causes attenuation of cellular proliferation and TCA cycle activity
(A) Nuclear red count in NOS1 cells treated with DMSO (vehicle control), 10 μM NCT-503 inactive control, or 15 μM NCT-503. (B) Percentage of cell death at 72 h in NOS1 cells treated with increasing doses of NCT-503. (C) Nuclear red count in NOS1 cells treated with DMSO or 10 μM PKUMDL-WQ-2101. (D) Percentage of cell death at 72 h in NOS1 cells treated with increasing doses of PKUMDL-WQ-2101. (E and F) Nuclear red count (E) and percentage of cell death (F) in NOS1 cells cultured with media containing dialyzed fetal bovine serum (FBS) ± supplementation with 286 μM serine and glycine and treated with NCT-inactive or NCT-503. (G) Oxygen consumption rate (OCR) for MDA-MB-231, MDA-MB-468, NOS1, and Saos2 cells treated with NCT-inactive or NCT-503. (H) Glycolytic proton efflux rate (GlycoPER) for NOS1, Saos2, and U2OS cells treated with NCT-inactive or NCT-503. (I) Concentration of 13C and unlabeled C in 3PG in Saos2 cells treated with NCT-inactive or NCT-503. (J and K) Percentage of incorporation of [U-13C] labeled glucose into serine (J) and glycine in Saos2 cells treated with NCT-inactive or NCT-503 (K). (L) Concentration of 13C and unlabeled C in lactate in Saos2 cells treated with NCT-inactive or NCT-503. (M) Metabolite levels in NOS1 cells treated with DMSO or NCT-503 for 48 h. Dashed lines indicate potential sources of acetyl-coA. (N) Percentage of incorporation of [U-13C] labeled glucose into carbons of acetyl-coA in Saos2 cells treated with NCT-inactive or NCT-503. 3PP, 3-phosphohydroxypyruvate; 3PSer, 3-phophoserine. Bars represent means of values; error bars represent SEM. All assays were conducted with n = 3 replicates. *p < 0.05, **p < 0.01, ***p < 0.005, ****p < 0.001.
Figure 3.
Figure 3.. PHGDH inhibition causes accumulation of intracellular unsaturated fatty acids
(A–C) Percentage of fuel oxidation of mitochondrial capacity to use fuel sources glucose, glutamine, and fatty acids, after treatment with 48 h of NCT-inactive or NCT-503 in NOS1 (A), Saos2 (B), and U2OS (C) cells. Bars represent means of values; error bars represent SEM n = 6 replicates. (D) Counts of green BODIPY 493/503 staining in NOS1 cells treated with NCT-inactive or NCT-503. (E and F) Relative abundance by peak area ratio of total saturated fatty acids (E) and total unsaturated fatty acids measured by liquid chromatography-mass spectrometry (LC-MS) (F) in Saos2, U2OS, MDA-MB-231, and MDA-MB-468 cells treated with NCT-inactive or NCT-503. (G and H) Relative abundance by peak area ratio of five most abundant unsaturated fatty acids in osteosarcoma cell lines (G) and breast cancer cell lines (H) (statistics presented in Figures S2C and S2D). Bars represent means of values; error bars represent SEM. All assays were conducted with n = 3 replicates unless otherwise specified. *p < 0.05, **p < 0.01, ***p < 0.005, ****p < 0.001.
Figure 4.
Figure 4.. Inhibition of serine synthesis and subsequent accumulation of branched chain amino acids leads to mTORC1 activation
(A) Heatmap of pathway scores for pathways characterized by NanoString Metabolism Gene Panel in NOS1 cells treated with NCT-inactive or NCT-503. Shades of orange indicate upregulation; shades of blue indicate downregulation. (B) Gene set analysis plot for significant and non-significant (black) genes in amino acid synthesis pathway (purple) and mTOR pathway (blue). (C) Pathway signature score for nucleotide synthesis pathway and (D) mTOR pathway in NOS1 cells treated with NCT-inactive or NCT-503, relative to NCT-inactive. (E) Linear normalized gene counts for ATF4 in NOS1 and Saos2 cells treated with NCT-inactive or NCT-503. (F) Pathway signature score for amino acid synthesis pathway in NOS1 cells treated with NCT-inactive or NCT-503, relative to NCT-inactive. (G and H) Linear normalized gene counts for PHGDH (G) and PSAT1 (H) in NOS1 and Saos2 cells treated with NCT-inactive or NCT-503. (I–L) Levels of amino acids in NOS1 cells treated with DMSO or NCT-503 for 48 h, including leucine (I), isoleucine (J), valine (K), and alanine (L). (M) Ratio of protein expression of phosphorylated (Thr389) p70S6K to total p70S6K in NOS1, Saos2, and U2OS cell lines in presence of NCT-inactive or NCT-503. Cell lysates were analyzed using Wes automated capillary blotting system, normalized to total protein levels, and a representative band image was used. Bars represent means of values; error bars represent SEM. All assays were conducted with n = 3 replicates. *p < 0.05, **p < 0.01, ***p < 0.005, ****p < 0.001.
Figure 5.
Figure 5.. Perhexiline, but not rapamycin, causes cell death in osteosarcoma and other PHGDH-high cell lines when combined with PHGDH inhibition
(A) Nuclear red count in NOS1 cells treated with DMSO (vehicle control) or 10 μM rapamycin. (B) Percentage of cell death at 72 h in NOS1 cells treated with DMSO (vehicle control), NCT-503, rapamycin, or a combination of NCT-503 and rapamycin. (C) Total protein levels of RSP6 in NOS1 cells treated with NCT-inactive, perhexiline, rapamycin, or a no treatment serum control. (D) Nuclear red count in NOS1 cells treated with DMSO (vehicle control), 5 μM perhexiline, or 10 μM perhexiline. (E) Percentage of cell death at 72 h in NOS1 cells treated with NCT-inactive, NCT-503, 5 μM perhexiline, or a combination of NCT-503 and 5 μM perhexiline. (F) Percentage of cell death at 72 h in NOS1 cells treated with 10 μM PKUMDL-WQ-2101, 5 μM perhexiline, or a combination of PKUMDL-WQ-2101 and 5 μM perhexiline. (G) Plot of combination index (CI) against fractional effect for the interaction of increasing doses of NCT-503 combined with increasing doses of perhexiline in NOS1 cells. CI > 1.0, antagonistic; 1.1 < CI < 0.9, additive; CI < 0.9, synergistic. (H and I) Percentage of cell death at 72 h in MDA-MB-468 (H) and MDA-MB-231 (I) cells treated with NCT-inactive, NCT-503, perhexiline, or a combination of NCT-503 and perhexiline. (J) Tumor volume of U2OS xenografts under various conditions: vehicle (n = 10), NCT-503 (n = 10), perhexiline (n = 10), and NCT-503 combined with perhexiline (n = 10). Bars represent means of values; error bars represent SEM. All assays were conducted with n = 3 replicates unless otherwise specified. *p < 0.05, **p < 0.01, ***p < 0.005, ****p < 0.001.
Figure 6.
Figure 6.. Accumulation of SAM and methionine contribute to activation of GATOR pathway, suggesting mTORC1 inhibitory mechanism of perhexiline
(A) Levels of methionine cycle metabolites methionine (Met), S-adenosyl methionine (SAM), and S-adenosyl homocysteine (SAHC) in NOS1 cells treated with DMSO (vehicle control) or NCT-503 for 48 h. (B) Schematic of effect of PHGDH inhibition on SAM and leucine metabolite levels, downstream mTORC1 pathway activation. (C) Images of NOS1 cells labeled with fluorescent antibody against NPRL2 (GATOR1) (green), fluorescent Lysotracker dye (red), and overlay of green and red showing NPRL2 localization at lysosome (yellow) in various conditions: NCT-inactive, NCT-503, perhexiline, and NCT-503 combined with perhexiline for 48 h. Scale bars represent 50 μm. (D) Quantification of overlap of NPRL2 antibody with Lysotracker, normalized to cell count. (E) Images of NOS1 cells labeled with fluorescent antibody against ITFG2 (KICSTOR) (green), fluorescent Lysotracker dye (red), and overlay of green and red showing ITFG2 localization at lysosome (yellow) in various conditions: NCT-inactive, NCT-503, perhexiline, and NCT-503 combined with perhexiline for 48 h. Scale bars represent 50 μm. (F) Quantification of overlap of ITFG2 antibody with Lysotracker, normalized to cell count. Bars represent means of values; error bars represent SEM. All assays were conducted with n = 3 replicates. *p < 0.05, **p < 0.01, ***p < 0.005, ****p < 0.001.

Similar articles

Cited by

References

    1. Baksh SC, Todorova PK, Gur-cohen S, Hurwitz B, Ge Y, Novak JSS, Tierney MT, Cruz-racelis J, Fuchs E, and Finley LWS (2020). Extracellular serine controls epidermal stem cell fate and tumour initiation. Nat. Cell Biol 22, 779–790. - PMC - PubMed
    1. Balgi AD, Fonseca BD, Donohue E, Tsang TCF, Lajoie P, Proud CG, Nabi IR, and Roberge M (2009). Screen for chemical modulators of autophagy reveals novel therapeutic inhibitors of mTORC1 signaling. PLoS ONE 4, e7124. - PMC - PubMed
    1. Barretina J, Caponigro G, Stransky N, Venkatesan K, Margolin AA, Kim S, Wilson CJ, Lehár J, Kryukov GV, Sonkin D, et al. (2012). The Cancer Cell Line Encyclopedia enables predictive modelling of anticancer drug sensitivity. Nature 483, 603–607. - PMC - PubMed
    1. Beadle RM, Williams LK, Kuehl M, Bowater S, Abozguia K, Leyva F, Yousef Z, Wagenmakers AJM, Thies F, Horowitz J, and Frenneaux MP (2015). Improvement in cardiac energetics by perhexiline in heart failure due to dilated cardiomyopathy. JACC Heart Fail. 3, 202–211. - PubMed
    1. Ben-Sahra I, Hoxhaj G, Ricoult SJH, Asara JM, and Manning BD (2016). mTORC1 induces purine synthesis through control of the mitochondrial tetrahydrofolate cycle. Science 351, 728–733. - PMC - PubMed

Publication types

MeSH terms

Substances