. 2021 Jan 26;34(4):108690.
doi: 10.1016/j.celrep.2021.108690.

CDK2 limits the highly energetic secretory program of mature β cells by restricting PEP cycle-dependent KATP channel closure

Affiliations

CDK2 limits the highly energetic secretory program of mature β cells by restricting PEP cycle-dependent KATP channel closure

Sophia M Sdao et al. Cell Rep. .

Abstract

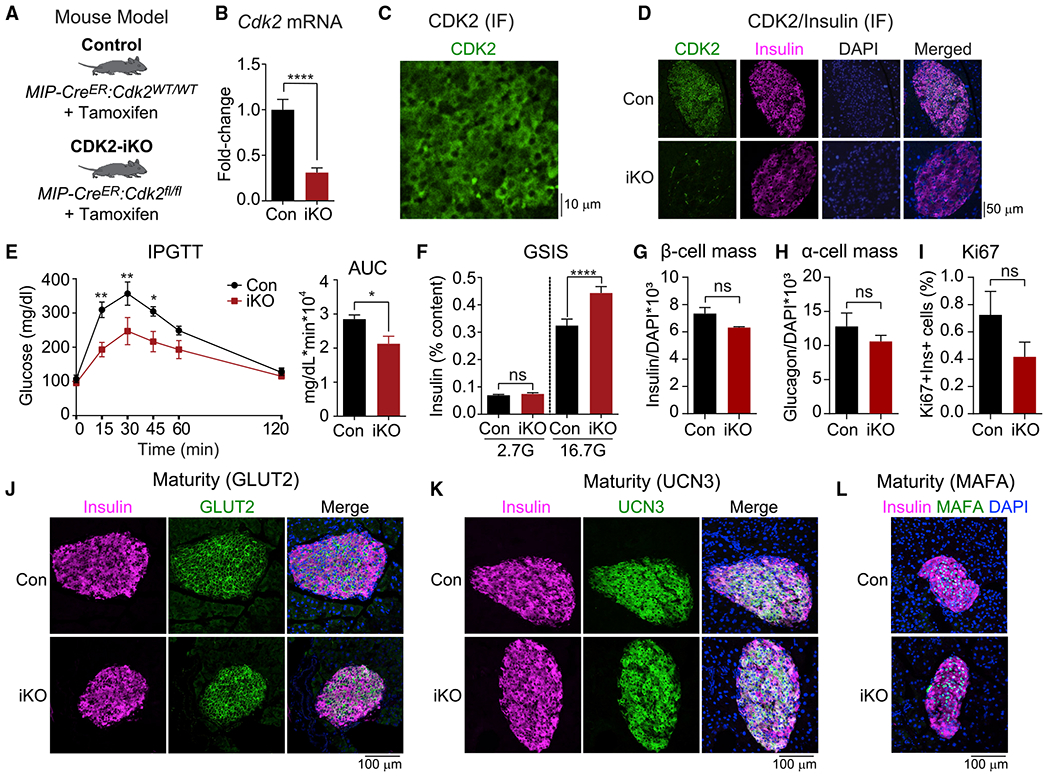
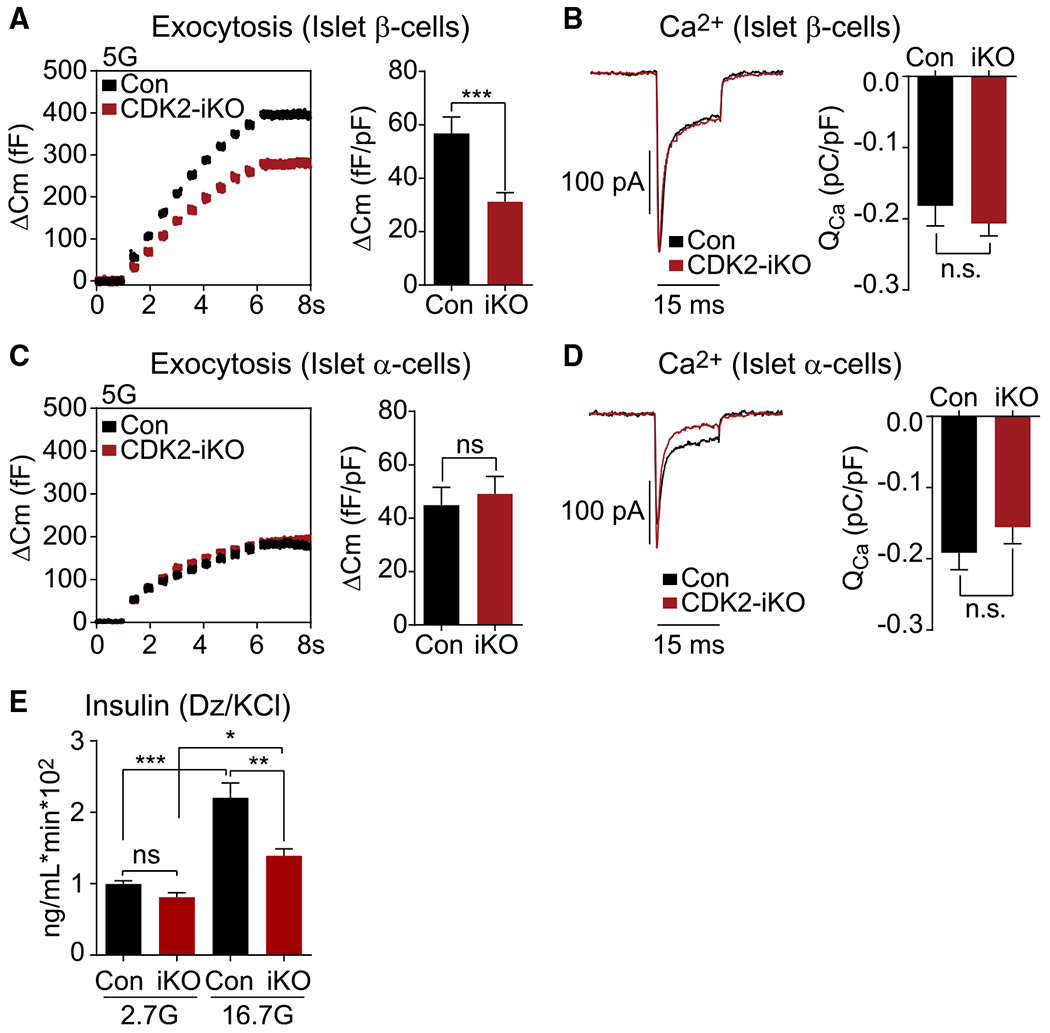
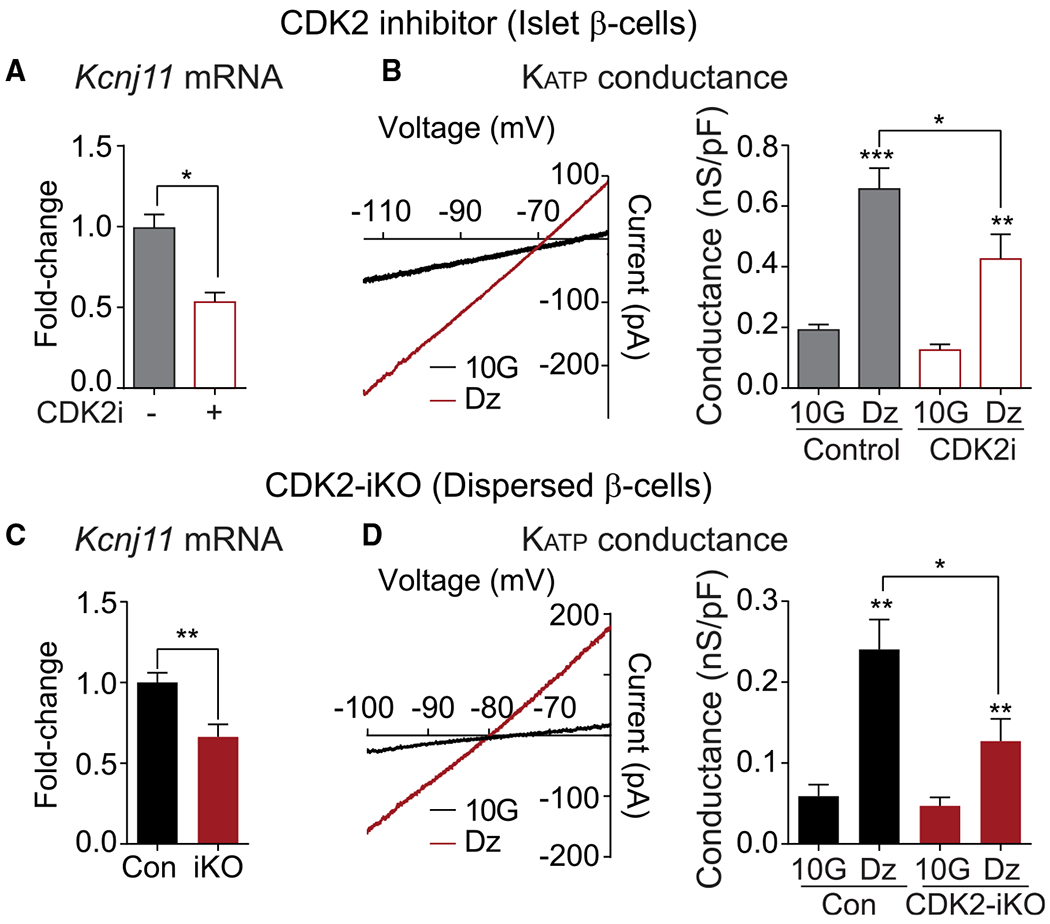
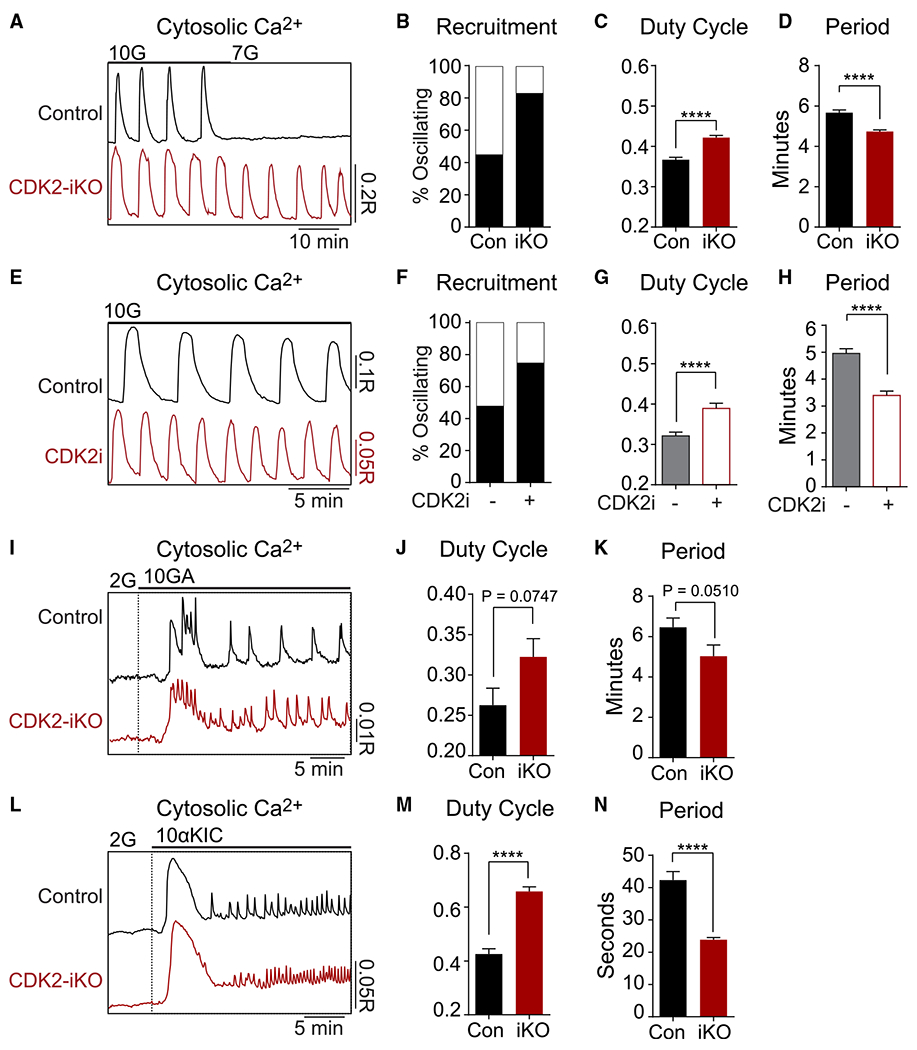
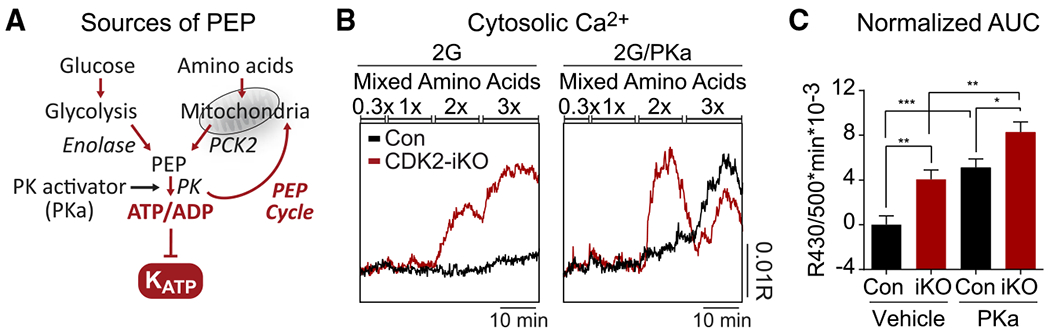
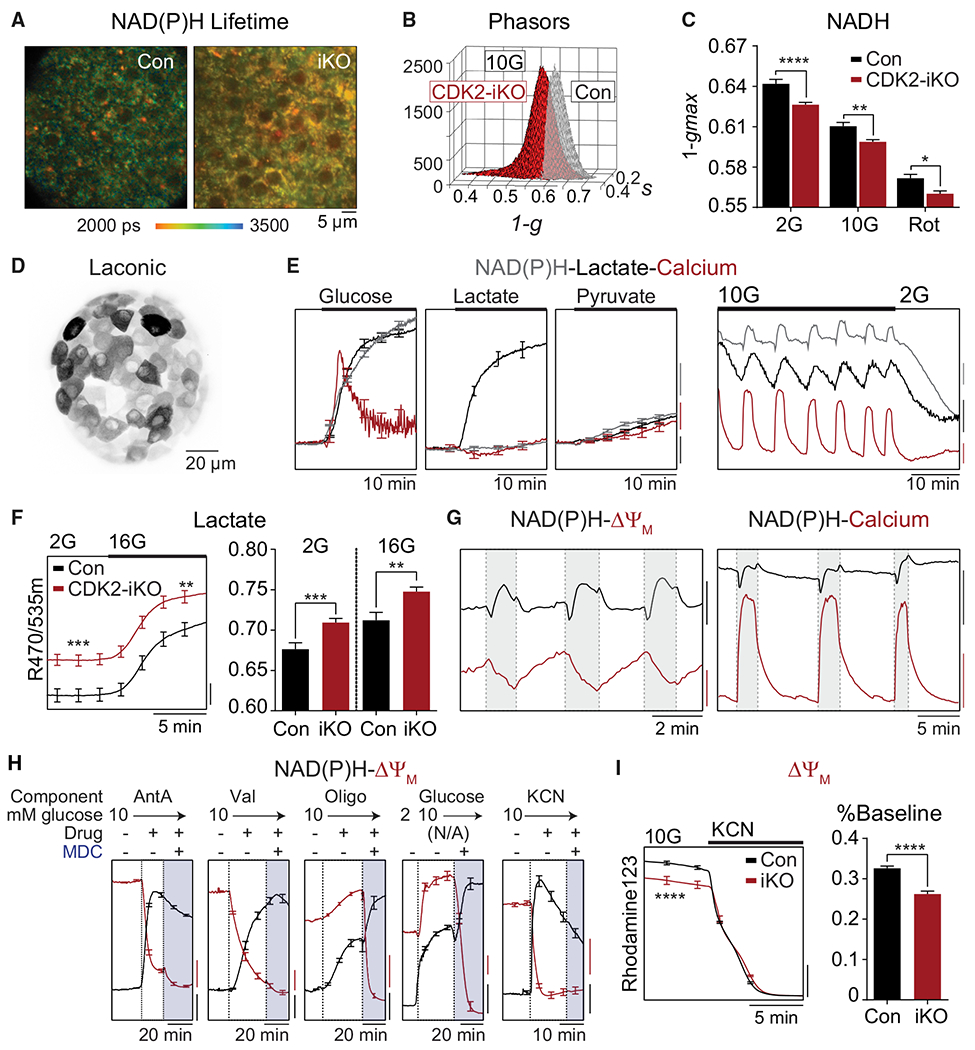
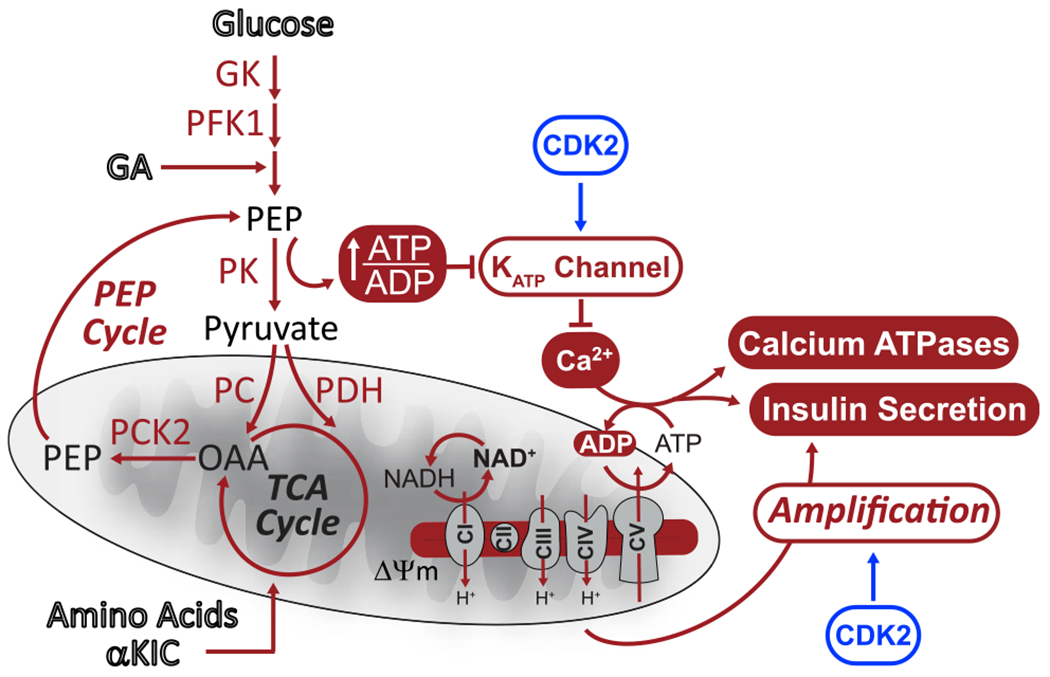
Hallmarks of mature β cells are restricted proliferation and a highly energetic secretory state. Paradoxically, cyclin-dependent kinase 2 (CDK2) is synthesized throughout adulthood, its cytosolic localization raising the likelihood of cell cycle-independent functions. In the absence of any changes in β cell mass, maturity, or proliferation, genetic deletion of Cdk2 in adult β cells enhanced insulin secretion from isolated islets and improved glucose tolerance in vivo. At the single β cell level, CDK2 restricts insulin secretion by increasing KATP conductance, raising the set point for membrane depolarization in response to activation of the phosphoenolpyruvate (PEP) cycle with mitochondrial fuels. In parallel with reduced β cell recruitment, CDK2 restricts oxidative glucose metabolism while promoting glucose-dependent amplification of insulin secretion. This study provides evidence of essential, non-canonical functions of CDK2 in the secretory pathways of quiescent β cells.

Keywords: CDK2; K(ATP) channel; PEP cycle; amplifying pathways; biosensor imaging; calcium; electrophysiology; insulin secretion; metabolic oscillations; β cell metabolism.


Conflict of interest statement

Declaration of interests The authors declare no competing interests.

Figures

Figure 1.
Figure 1.. Short-term CDK2 restriction enhances insulin secretion from mouse islets and improves glucose tolerance
(A) Mouse model used to inducibly delete CDK2 from adult β cells. Tamoxifen was injected intraperitoneally into Cdk2fl/fl-MIPCreER (CDK2-iKO) and MIP-CreERT controls (Con) at 10 weeks of age. Mice were given 4 weeks to clear tamoxifen and phenotyped at 14 weeks of age. (B) Cdk2 mRNA expression measured by qPCR in pancreatic islets isolated from Con (n = 15) and CDK2-iKO (n = 16) mice. (C) CDK2 immunofluorescence (green) in a mouse pancreatic section. (D) CDK2 (green) and insulin (pink) immunofluorescence in pancreatic sections from Con and CDK2-iKO mice. (E) Glucose tolerance test (GTT) in Con (n = 5) and CDK2-iKO (n = 4) mice, quantified by area under the curve (AUC). (F) Ex vivo glucose-stimulated insulin secretion (GSIS) normalized to insulin content, measured in isolated islets from Con (n = 3) and CDK2-iKO (n = 4) mice. (G–I) Quantification of β cell mass (G), α cell mass (H), and Ki67-positive β cells (I) in Con (n = 4) and CDK2-iKO (n = 5) pancreatic sections. (J–L) Insulin (pink) and maturation marker (green) GLUT2 (J), UCN3 (K), and MAFA (L) immunofluorescence in pancreatic sections from Con and CDK2-iKO mice. Data are shown as mean ± SEM. *p < 0.05, **p < 0.01, ****p < 0.0001 by t test.
Figure 2.
Figure 2.. Reduced metabolic amplifying pathway in CDK2-iKO β cells
(A and C) Capacitance increases in response to 10 step depolarizations from −70 mV to 0 mV in (A) β cells (Con, n = 19; CDK2-iKO, n = 39) and (C) α cells (Con, n = 14; CDK2-iKO, n = 14) isolated from 4 Con and 3 CDK2-iKO mice. (B and D) Averaged leak-subtracted calcium current (Ica) and influx (Qca) from β cells (B) and α cells (D), measured during a 15-ms step depolarization from −70 mV to 0 mV for each cell above. (E) Ex vivo KCl-stimulated insulin secretion normalized to DNA content, measured in isolated islets from Con (n = 3) and CDK2-iKO (n = 4) mice, quantified by AUC. Data are shown as mean ± SEM. *p < 0.05, **p < 0.01, ***p < 0.001 by t test (B and D) or one-way ANOVA (E).
Figure 3.
Figure 3.. Islets with short-term CDK2 restriction have reduced Kir6.2 mRNA, resulting in reduced KATP channel activity
(A and C) Kcnj11 expression measured by qPCR in pancreatic islets treated with vehicle Con or CDK2i (n = 3 mice) (A) or islets isolated from Con and CDK2-iKO mice (n = 3 mice per genotype) (C). (B and D) Measurements of KATP conductance in islets treated with vehicle Con or CDK2i (B) or CDK2-iKO islets (C). Left: representative current-voltage relationship collected during a voltage ramp, showing conductance (slope) changes in β cells measured in 10 mM glucose (10G) and after treatment with 200 μM diazoxide (DZ). Right: KATP conductance was reduced in CDK2i-treated (n = 7) relative to vehicle-treated Con (n = 11) β cells (B) and in CDK2-iKO β cells relative to Cons treated with Ad-Cre (n = 11 cells from 3 mice each genotype) (D). Data are shown as mean ± SEM. *p < 0.05, **p < 0.01, ***p < 0.001 by t test (A and C) or one-way ANOVA (B and D).
Figure 4.
Figure 4.. Increased islet recruitment underlies enhanced insulin secretion following short-term CDK2 restriction
(A) Representative recordings of cytosolic calcium oscillations in islets isolated from 4 Con and 4 CDK2-iKO mice stimulated by 10G or 7 mM glucose (7G). (B) Percentage of islets that continued oscillating at 7G (Con, n = 89; CDK2-iKO, n = 95). (C and D) CDK2-iKO increased the duty cycle (C) and reduced the period (D) of glucose-stimulated calcium oscillations (Con, n = 168 islets; CDK2-iKO, n = 182 islets). (E) Representative recordings of cytosolic calcium oscillations in vehicle- or CDK2i-treated islets isolated from 2 wild-type (WT)/B6J mice stimulated by 10G. (F) Percentage of islets that oscillated at 6 mM glucose (vehicle Con, n = 30; CDK2i, n = 32). (G and H) CDK2i increased the duty cycle (G) and reduced the period (H) of glucose-stimulated calcium oscillations (vehicle Con, n = 40; CDK2i, n = 44). (I) Representative recordings of cytosolic calcium response to 10 mM glyceraldehyde (10GA) at 2 mM glucose (2G) in islets isolated from 3 Con and 3 CDK2-iKO mice. (J and K) CDK2-iKO increased the duty cycle (J) and reduced the period (K) of glyceraldehyde-stimulated calcium oscillations (Con, n = 34; CDK2-iKO, n = 29). (L) Representative recordings of cytosolic calcium response to 10 mM α-ketoisocaproate (10aKIC) at 2G in islets isolated from 2 Con and 2 CDK2-iKO mice. (M and N) CDK2-iKO increased the duty cycle (M) and reduced the period (N) of keto-isocaproate-stimulated calcium oscillations (Con, n = 29; CDK2-iKO, n = 24). Data are shown as mean ± SEM. #p < 0.1, ****p < 0.0001 by t test.
Figure 5.
Figure 5.. Amino acid-stimulated PEP cycling is sufficient to enhance islet recruitment in CDK2-iKO islets
(A) PEP can be generated from glycolytic enolase or from mitochondrial oxaloacetate conversion via PCK2 and export to the cytosol. Addition of amino acids fuels the TCA cycle and activates the PEP cycle, and pyruvate kinase activator (PKa) also activates the PEP cycle. (B) Representative recordings of cytosolic calcium elevation in response to an amino acid ramp at 2G and in the absence (left) or presence (right) of PKa in islets isolated from 3 Con and 3 CDK2-iKO mice. At 1×, physiological amino acids (PAA) is (in μM) 2,100 alanine, 600 glutamine, 700 glycine, 550 valine, 500 leucine, 350 serine, 200 arginine, 218 lysine, and 121 threonine. (C) Quantification of (B) by AUC at 2× mixed amino acids, normalized to Con/vehicle. (Con/vehicle, n = 44; CDK2-iKO/vehicle, n = 48; Con/PKa, n = 38; CDK2-iKO/PKa, n = 44). Data are shown as mean ± SEM. *p < 0.05, **p < 0.01, ***p < 0.001 by one-way ANOVA.
Figure 6.
Figure 6.. Enhanced metabolism in CDK2-iKO islets
(A) Representative NAD(P)H fluorescence lifetime images from Con and CDK2-iKO islets imaged in 10G. Scale bar, 5 μM. (B) Phasor histograms showing the frequency distribution of NAD(P)H lifetimes (1-g, s) in islets isolated from Con (n = 4) and CDK2-iKO (n = 4) mice imaged in 10G. (C) Projection of the phasor histogram peak along the 1-g axis was used to quantify NAD(P)H utilization in the presence of 2G, 10G, and complex I inhibitor (5 μM rotenone [Rot], 15 min) as indicated (n = 10 islets per mouse for each condition). (D) Maximum intensity projection of intact islet expressing Ad-RIP-Laconic in β cells imaged using a 2-photon Nikon TE-300 inverted confocal microscope. (E) Left: response of each metabolite to 10G (n = 10 islets), 20 mM lactate (n = 12 islets), or 20 mM pyruvate (n = 10 islets) in islets isolated from 1 WT/B6J mouse, normalized to baseline signal at 2G. Scale bars, 2% baseline. Right: representative traces demonstrating the phase relationship between oscillations in NAD(P)H (endogenous, blue trace; scale bar, 200 IU), cytosolic lactate (Ad-RIP-Laconic, black trace; scale bar, 0.02 R470/535 m), and cytosolic calcium (FuraRed, red trace; scale bar, 0.05R 430/500×) at 10G and 2G. (F) Increased lactate levels in CDK2-iKO islets (n = 59 islets from 3 mice) relative to Con (n = 72 islets from 4 mice) at 2G and 10G. Scale bar, 0.01 R470/535 m. (G) Phase relationships between oscillations in NAD(P)H and ΔΨm (left) and cytosolic calcium (right). NAD(P)H: black scale bar, 100 IU (left) or 500 IU (right). ΔΨm: red scale bar, 50 IU. FuraRed (Ca2+): red scale bar, 0.2 R430/500×. (H) Response of ΔΨm (red traces) and NAD(P)H (black traces) to the ETC inhibitors antimycin A(AntA; 1 μM, n = 10 islets), valinomycin (Val; 1 μM, n = 11 islets), and oligomycin (Oligo; 2 μM, n = 12 islets); to 10G (n = 11 islets); and to 5 mM cyanide (n = 11 islets) in islets isolated from 1 WT/B6J mouse. ΔΨm is normalized to fluorescence after depolarization with MDC. NAD(P)H is normalized to fluorescence at the beginning of the recording. Scale bars, 0.1 normalized IU. (I) ΔΨm is depolarized in CDK2-iKO islets (n = 70 islets from 3 mice) relative to Con islets (n = 85 islets from 4 mice), normalized to fluorescence after depolarization with cyanide, quantified as percentage of baseline. Scale bar, 0.2 normalized IU. Data are shown as mean ± SEM. *p < 0.05, **p < 0.01, ***p < 0.001, ****p < 0.0001 by one-way AVOVA (C) or t test (F and I).
Figure 7.
Figure 7.. Model of CDK2 regulation of β cell metabolism
CDK2 regulates β cell excitability, oxidative metabolism, and insulin secretion. CDK2 activates KATP channel conductance independent of the PEP source. KATP channel activation limits β cell excitability and calcium influx, which alleviates ATP consumption by exocytosis and calcium removal through calcium ATPases, limiting oxidative metabolism. Additionally, CDK2 promotes metabolic amplification of insulin secretion.

Similar articles

Cited by

References

    1. Abulizi A, Cardone RL, Stark R, Lewandowski SL, Zhao X, Hillion J, Ma L, Sehgal R, Alves TC, Thomas C, et al. (2020). Multi-Tissue Acceleration of the Mitochondrial Phosphoenolpyruvate Cycle Improves Whole-Body Metabolic Health. Cell Metab. 32, 751–766. e11. - PMC - PubMed
    1. Ackeifi C, Wang P, Karakose E, Manning Fox JE, González BJ, Liu H, Wilson J, Swartz E, Berrouet C, Li Y, et al. (2020). GLP-1 receptor agonists synergize with DYRK1A inhibitors to potentiate functional human β cell regeneration. Sci. Transl. Med 12, eaaw9996. - PMC - PubMed
    1. Affourtit C, Alberts B, Barlow J, Carré JE, and Wynne AG (2018). Control of pancreatic β-cell bioenergetics. Biochem. Soc. Trans 46, 555–564. - PubMed
    1. Aguilar V, and Fajas L (2010). Cycling through metabolism. EMBO Mol. Med 2, 338–348. - PMC - PubMed
    1. Ahn S-H, Granger A, Rankin MM, Lam CJ, Cox AR, and Kushner JA (2019). Tamoxifen suppresses pancreatic β-cell proliferation in mice. PLoS ONE 14, e0214829. - PMC - PubMed

Publication types

LinkOut - more resources