. 2021 Jan 26;34(4):108656.
doi: 10.1016/j.celrep.2020.108656.

FOS licenses early events in stem cell activation driving skeletal muscle regeneration

Affiliations

FOS licenses early events in stem cell activation driving skeletal muscle regeneration

Albert E Almada et al. Cell Rep. .

Abstract

Muscle satellite cells (SCs) are a quiescent (non-proliferative) stem cell population in uninjured skeletal muscle. Although SCs have been investigated for nearly 60 years, the molecular drivers that transform quiescent SCs into the rapidly dividing (activated) stem/progenitor cells that mediate muscle repair after injury remain largely unknown. Here we identify a prominent FBJ osteosarcoma oncogene (Fos) mRNA and protein signature in recently activated SCs that is rapidly, heterogeneously, and transiently induced by muscle damage. We further reveal a requirement for FOS to efficiently initiate key stem cell functions, including cell cycle entry, proliferative expansion, and muscle regeneration, via induction of "pro-regenerative" target genes that stimulate cell migration, division, and differentiation. Disruption of one of these Fos/AP-1 targets, NAD(+)-consuming mono-ADP-ribosyl-transferase 1 (Art1), in SCs delays cell cycle entry and impedes progenitor cell expansion and muscle regeneration. This work uncovers an early-activated FOS/ART1/mono-ADP-ribosylation (MARylation) pathway that is essential for stem cell-regenerative responses.

Keywords: AP-1; ART1; FOS; MARylation; early activation; muscle satellite cells; muscle stem cells; post-translational regulation.


Conflict of interest statement

Declaration of interests A.J.W. is a scientific advisor for Frequency Therapeutics, and A.J.W. and L.L.R. are co-founders and scientific advisory board members and hold private equity in Elevian, Inc., a company that aims to develop medicines to restore regenerative capacity. Elevian also provides sponsored research to the Wagers lab.

Figures

Figure 1.
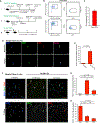
Figure 1.. Abundant Fos mRNA is a feature of SCs freshly isolated from uninjured skeletal muscle
(A) Experimental strategy for transcriptional profiling of fresh SCs from uninjured skeletal muscle and 5-day cultured SCs (cells from 3 mice). (B) Clustered heatmap (dendrograms not shown) showing 45 transcription factors (TFs) enriched (>2-fold change, FDR < 0.02) in fresh relative to cultured SCs. AP-1 and AP-1-associated TFs are highlighted. (C) The most enriched and notable TFs in fresh SCs along with their rank (i.e., enrichment in fresh SCs), fold change (FC), and false discovery rate (FDR). (D) All mRNAs detected in fresh SCs ranked by reads per kilobase of transcript per million mapped reads (RPKM) expression. RPKM values for duplicate RNA-seq datasets from fresh SCs were averaged for each gene as in Ryall et al. (2015). (E) qPCR showing mean (±SD) relative Fos mRNA expression (normalized to glyceraldehyde 3-phosphate dehydrogenase [GAPDH]) in fresh SCs from uninjured skeletal muscle, 5-day cultured SCs in GM, differentiating myoblasts in differentiation medium (DM) for 24 h, and terminal myotubes in DM for 72 h (cells from 3 mice). One-way ANOVA with Tukey post hoc test, ***p < 0.001 comparing fresh SCs with all other conditions. (F) Genome view around the Fos locus, displaying RNA-seq read count density and H3K27ac (chromatin immunoprecipitation sequencing [ChIP-seq]) read coverage. See also Figures S1 and S2.
Figure 2.
Figure 2.. FOS is transiently and heterogeneously induced in SCs within hours after muscle trauma
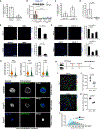
(A) Workflow for isolating fresh SCs (I) and single fibers (II) from skeletal muscle and time points included in the in vivo injury time course (III). (B) Dot plots showing analysis for (II) GFP expression in CD45/CD11b/Ter119/CD31/Sca1/β1-Integrin+/CXCR4+ fresh SCs (I) from uninjured muscles of wild-type (FMO-WT, top) or FosGFP (bottom) mice. SSC-A, side scatter area. Data were pre-gated on physical and live cell parameters (see STAR methods for details). (C) Mean (±SD) percentage of fresh FosGFP SCs expressing GFP (compiled analysis from 15 mice). (D) Pre-fixed (bottom) or non-pre-fixed (standard isolation, top) single fibers co-stained for PAX7 (green), FOS (red), and DAPI (blue). (E) Quantification (mean ± SD) of the percentage of PAX7+ SCs expressing FOS in freshly isolated single fibers stained as in (D). Data represent enumeration of more than 100 SCs across a minimum of 30 fibers per biological replicate for each condition (n = 3 mice per condition). (F) Fresh-frozen muscle sections co-stained for PAX7 (green), FOS (red), and DAPI (blue) 0, 1.5, and 12 h after cardiotoxin (CTX; 10 μM) injury. All channels are shown separately for the 1.5 h post-injury field (bottom row) and merged for 0, 1.5, and 12 h (top row). (G and H) Quantification of immunofluorescence (IF) data shown in (F), including (G) mean (±SD) percentage of PAX7+ SCs expressing FOS protein and (H) mean (±SD) number of PAX7+ SCs quantified per TA/extensor digitorum longus (EDL) section per condition (n = 3 mice per time point). Student’s two-tailed unpaired t test (E) and one-way ANOVA with Tukey post hoc test (G and H). The scale bars represent 50 mm (D) and 100 μm (F). See also Figure S3.
Figure 3.
Figure 3.. FosGFP marks a subset of SCs with enhanced regenerative activity
(A) Gating strategy for sorting CD45/CD11b/Ter119/CD31/Sca1/β1-integrin+/CXCR4+ fresh FosGFP− and FosGFP+ SCs based on a fluorescence minus one (FMO) control (SCs from WT mice). Data were pre-gated on physical and live cell parameters (see STAR methods for details). (B) 2,000 FosGFP− or 2,000 FosGFP+ SCs were cultured in growth medium (GM) for 6 h prior to IF for MYOD (magenta). Hoechst is shown in blue. Also shown is the mean (±SD) percentage of MYOD+ cells after 6 h in culture (analysis from 3 mice). (C) Mean (±SD) percentage of single GFP+ or GFP− cells that gave rise to viable myogenic colonies (left) and to colonies containing more than 200, 100–200, 50–100, and fewer than 50 cells per colony (right). A total of 82 and 86 colonies for FosGFP− and FosGFP+ cells were quantified, respectively (cells from 2 mice). (D) 2,000 FosGFP+ and 2,000 FosGFP− fresh SCs cultured in GM for 3 days and pulsed with EdU 3 h before harvest, showing EdU+ (magenta) and Hoechst+ (blue) nuclei. Shown is the mean (±SD) percentage of EdU+ nuclei among total Hoechst+ nuclei after 3 or 6 days in culture (n = 3 mice each time point). (E) Regenerating TA muscle transplanted with 3,000 fresh FosGFP+ or 3000 FosGFP− SCs 3 weeks prior. (F and G) Total number of engrafted DYSTROPHIN+ (red) muscle fibers (F) and fold difference in DYSTROPHIN+ muscle fiber engraftment (G) upon transplantation with FosGFP+ or FosGFP− cells from the same donor (n = 5 donor and recipient mice). Dots represent data for individual recipient animals overlaid with mean ± SD. Student’s two-tailed unpaired (B–D) and paired (F) t test. Scale bars, 100 mm (B and D) and 200 μm (E). See also Figure S4.
Figure 4.
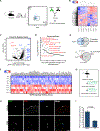
Figure 4.. Fresh FosGFP+ SCs express a pro-regenerative transcriptional gene signature
(A) Schematic showing the experimental design and FACS gating strategy for isolation of 1,000 Fresh FosGFP+ and 1,000 FosGFP− SCs directly sorted for RNA-seq analysis (SCs isolated from 4 mice). (B) Hierarchically clustered heatmap showing all 3,387 differentially expressed genes (DEGs; >1.5 FC, FDR < 0.05) in FosGFP+ versus FosGFP− SCs. (C) Volcano plot highlighting known SC regulator genes enriched (blue) or depleted (red) in fresh FosGFP+ SCs. Notable mRNAs not significantly changed are indicated in black. (D) Top ranked Biocarta pathways associated with enriched genes in FosGFP+ fresh SCs. (E) Venn diagrams showing overlap in genes enriched in FosGFP+ or FosGFP− SCs and in T3 (standard isolation, top) or T0 (in-situ-fixed, quiescent SCs, bottom) SCs, respectively (Machado et al., 2017). The p values were determined by Fisher’s exact test of significance. (F) Heatmap of MAPK targets expressed in FosGFP+ SCs relative to FosGFP SCs. (G) Strategy for testing whether p38 MAPK induces FOS in freshly isolated single fibers. (H) Single fibers co-stained for PAX7 and FOS after isolation in the presence of vehicle or the p38 MAPK inhibitor SB202190 (SB). Scale bar, 50 μm. (I) Mean (±SD) percentage of PAX7+ SCs expressing FOS protein after isolation under the indicated condition. Data represent enumeration of more than 100 SCs across a minimum of 30 fibers per biological replicate for each condition (n = 3 mice per condition). The Z score equals the number of SDs from the mean expression of all genes (C and F). Fisher’s exact test (E) and Student’s two-tailed unpaired t test (I). See also Figure S5.
Figure 5.
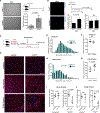
Figure 5.. FoscKO SCs display diminished regenerative activity
(A) 1,500 FoscKO or 1,500 fresh control SCs were cultured for 7 days in GM. Shown is quantification of the mean (±SD) number of Hoechst+ cells per well (n = 3 mice per genotype). (B) 2,000 fresh FoscKO or 2,000 control SCs cultured in GM for 4 or 7 days and pulsed with EdU 3 h before harvest, displaying EdU-positive (magenta) and Hoechst-positive (blue) nuclei and mean (±SD) percentage of EdU+ nuclei among total Hoechst+ cells after 4 (n = 2–4 mice per genotype) or 7 days (n = 3 mice per genotype) in culture. (C) Schematic showing the tamoxifen (TAM) treatment regimen before and after a freeze muscle injury (cryoinjury) in the TA muscle. (D) Representative Laminin-stained FoscKO and control muscle sections (20×) from uninjured mice (top) and from mice 7 (center) and 50 (bottom) days after freeze injury. (E and F) Distribution (E) and mean (±SD) cross-sectional area (CSA; F) of fiber sizes from uninjured FoscKO or control animals (n = 4 mice per genotype). (G and H) Distribution (G) and mean (±SD) CSA (H) of regenerating (centrally nucleated) muscle fibers 7 days after freeze injury (n = 5 mice per genotype). (I) Quantification of the total number of muscle fibers per TA/EDL section in control and FoscKO mice before (left) and 50 days after freeze injury (right) (n = 5 mice per genotype per condition). (J) Total number of Pax7+ SCs in uninjured and injured (50 dpi, freeze) TA/EDL muscle sections of control (left) and FoscKO mice (right) (n = 5 mice per genotype per condition). Dots represent data for individual control or FoscKO animals overlaid with mean ± SD. Student’s two-tailed unpaired (A, B, F, H, and I) and paired (J) t test and Mann-Whitney U test (E and G). Scale bars, 100 μm (A, B, and D). See also Figure S6.
Figure 6.
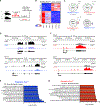
Figure 6.. FoscKO SCs fail to induce the early-activated pro-regenerative transcriptional program
(A) 1,000 FoscKO and 1,000 fresh control SCs were directly sorted from uninjured muscle tissue for RNA-seq analysis. (B) Clustered heatmap (dendogram not shown) displaying 69 DEGs (>2-fold with FDR < 0.05) between FoscKO and control SCs. The Z score equals the number of SDs from the mean expression of all genes. (C) Venn diagrams indicating overlap of all comparisons between FosGFP+ and FosGFP− enriched genes, with 27 genes depleted in FoscKO SCs and 42 genes enriched in FoscKO SCs. The p values represent Fisher’s exact test of significance. (D and F) Genome view showing RNA-seq read count density around (D) MyoD and Hmga1 and (F) Sprouty1 (Spry1) and HeyL loci. (E and G) The top 12 enriched Gene Ontology (GO) terms among genes depleted in FoscKO cells (E) and genes enriched in FoscKO cells (G) relative to control cells.
Figure 7.
Figure 7.. Art1 is a direct FOS target whose pharmacological and genetic disruption impairs SC function
(A) RNA-seq (normalized read counts) showing mean (±SD) Art1 mRNA expression in fresh FoscKO and control SCs. (B) ChIP-qPCR assays using a FOS or immunoglobulin G (IgG)-only antibody to immunoprecipitate chromatin isolated from cultured SCs ectopically expressing FOS(+FOS) or GFP (+GFP) (n = 3 independent ChIP experiments using SCs from 3 mice). 5 different probes targeted the Art1 promoter near the FOS/AP-1 DNA motif. (C) RNA-Seq (normalized read counts) showing mean (±SD) Art1 mRNA expression in fresh SCs isolated from in-situ-fixed (T0) or non-pre-fixed (standard, T3) skeletal muscle (Machado et al., 2017). (D) qPCR showing mean (±SD) Art1 mRNA expression (normalized to GAPDH) in fresh relative to 7-day-cultured SCs. (E) 3,000 fresh SCs were cultured for 3 days with vehicle or MIBG (50 μM). Shown are images and quantification of the mean (±SD) percentage of EdU+ nuclei among Hoechst+ SCs (top). 3,000 fresh SCs were cultured for 6 days with vehicle or MIBG (50 μM). Shown are images and quantification of the total number (mean ± SD) of Hoechst+ nuclei (bottom) (n = 4 mice each condition). (F) 3,000 fresh SCs were infected with lentivirus on the day of isolation with a non-targeting control (NTC) shRNA or one of two distinct shRNAs targeting Art1 mRNA and cultured for 6 days. Shown are images and quantification of the mean percentage (±SD) of EdU+ nuclei among Hoechst+ nuclei (top) or the total number (mean ± SD) of Hoechst+ nuclei (bottom) (n = 4 mice per condition). (G) Distribution of ADP ribosylation levels (corrected total cell fluorescent signal [CTCF]) on individual vehicle/MIBG-treated (left), control/FoscKO (center), and shNTC/shArt1-expressing (right) SCs cultured for 3 days. IF was performed under non-permeabilization conditions to ensure extracellular signal. n = 250 cells (vehicle)/80 cells (MIBG) from 3 mice, n = 588 cells (control)/395 cells (FoscKO) from 4 mice, and n = 1,300 cells (shNTC)/695 cells (shArt1) from 4 mice. Red lines represent the median value, and lower and upper black lines represent the first and third quartiles of the data. shArt1-expressing SCs have reduced cell-surface ADP ribosylation in a small subset of the population, specifically in the first quartile (highlighted in Figure S7F). Shown are three representative images of cellsurface ADP ribosylation (green) on Hoechst+ (blue) control and FoscKO fresh SCs after 3 days in culture. (H) Experimental design. We performed two consecutive injections for 2 days (1 injection per day) of MIBG (50 μM) or vehicle into the TA muscle following a CTX injury and then harvested regenerating muscle 7 dpi. (I) Representative images showing PAX7+ SCs associated with regenerating (centrally nucleated) fibers 7 days after CTX injury. Pax7 (red), nuclei (DAPI), and Laminin (Green) are shown. (J) Quantification of the total number of PAX7+ SCs per TA/EDL muscle section in vehicle- and MIBG-treated mice (n = 5 mice per treatment). (K and L) Enumeration of the mean CSA (K) and distribution (L) of regenerating (centrally nucleated) muscle fibers in vehicle- and MIBG-treated mice at 7 dpi (n = 5 mice per condition). Two-way ANOVA with post hoc Holm-Sidak test (B), one-way ANOVA with Tukey post hoc test (F), Student’s two-tailed unpaired t test (D, E, J, and K), and Mann-Whitney U test (G and L). Scale bars represent 100 μm (E and F), 10 mm (G), and 50 μm (I). See also Figure S7.

Similar articles

Cited by

References

    1. Anders S, Pyl PT, and Huber W. (2015). HTSeq–a Python framework to work with high-throughput sequencing data. Bioinformatics 31, 166–169. - PMC - PubMed
    1. Barth AL, Gerkin RC, and Dean KL (2004). Alteration of neuronal firing properties after in vivo experience in a FosGFP transgenic mouse. J. Neurosci 24, 6466–6475. - PMC - PubMed
    1. Bentzinger CF, Wang YX, von Maltzahn J, Soleimani VD, Yin H, and Rudnicki MA (2013). Fibronectin regulates Wnt7a signaling and satellite cell expansion. Cell Stem Cell 12, 75–87. - PMC - PubMed
    1. Bjornson CR, Cheung TH, Liu L, Tripathi PV, Steeper KM, and Rando TA (2012). Notch signaling is necessary to maintain quiescence in adult muscle stem cells. Stem Cells 30, 232–242. - PMC - PubMed
    1. Bolstad BM, Irizarry RA, Astrand M, and Speed TP (2003). A comparison of normalization methods for high density oligonucleotide array data based on variance and bias. Bioinformatics 19, 185–193. - PubMed

Publication types

Substances

LinkOut - more resources